c
Owned by the authors, published by EDP Sciences, 2015
Recent results from telescope array
Masaki Fukushimaafor the Telescope Array Collaboration
Institute for Cosmic Ray Research, The University of Tokyo, Kashiwanoha 5-1-5, Kashiwa, Chiba 277-8582, Japan
Abstract. The Telescope Array (TA) is an experiment to observe Ultra-High Energy Cosmic Rays (UHECRs). TA’s recent results, the energy spectrum and anisotropy based on the 6-year surface array data, and the primary composition obtained from the shower maximum (XMAX) are reported. The spectrum demonstrates a clear dip and cutoff. The shape of the spectrum is well
described by the energy loss of extra-galactic protons interacting with the cosmic microwave background (CMB). Above the cutoff, a medium-scale (20◦radius) flux enhancement was observed near the Ursa-Major. A chance probability of creating this hotspot from the isotropic flux is 4.0σ. The measuredXMAXis consistent with the primary being proton or light nuclei for
energies 1018.2eV–1019.2eV.
1. Introduction
A cutoff of the cosmic ray energy spectrum around 1020eV
was suggested by Greisen, Zatsepin and Kuzmin (GZK) in 1966 [1] just after the discovery of the cosmic microwave background (CMB). When the energy of cosmic ray proton approaches to ultra-high energies, pion photo-production with the CMB starts. The creation and decay of the nucleon resonance deprives a significant energy from the propagating proton. This process produces a cutoff and a horizon for UHECRs arriving at the Earth. Precise measurements of the pion photo-production cross section by accelerator experiments, and of the CMB radiation temperature by space experiments allowed a precise prediction for the cutoff energy and the horizon, assuming certain models for cosmic ray production and its cosmological development [2]. Thus, a search for the GZK cutoff became an important subject for cosmic ray experiments, and a search for UHECR sources within the GZK horizon became a realistic hope.
Searches for the GZK effect by ground based air shower arrays have been associated with the experimental difficulties such as the very low arrival rate, one event per year on an area of 100 km2 at ∼1020eV, and large ambiguities in the determination of primary energy and composition by the sparse sampling of shower particles arriving on the ground.
A new air fluorescence technique for measuring UHECRs was established by the Fly’s Eye (FE) and High Resolution FE (HiRes) [3,4] by 2000. In this technique, the longitudinal development of air shower in the atmosphere was recorded by fast imaging telescopes, and the primary cosmic ray energy was determined by integrating the profile of the shower development. A stochastic measurement of the primary composition became possible by observing the average and fluctuation of XMAXover many shower samples.
ae-mail:[email protected]
The Telescope Array (TA) employs an array of Surface Detectors (SDs) covering a large ground area of 700 km2, together with a set of Fluorescence Detectors (FDs) overlooking the SD area [5,6]. It is installed in the West Desert of Utah, USA, and has been taking data since 2008. Whenever possible the SDs and FDs make simultaneous measurement of the event, however the operation of FD is limited to moonless clear nights and its duty factor is at a level of 10%. The SD runs with close to 100% duty, collects higher statistics, and its sky sampling is uniform in equatorial longitude. A similar type of hybrid experiment was installed at the Pierre Auger Observatory (PAO) in the Argentinian pampas [7], and has been taking data since 2004 with 3000 km2SD array.
The search for the GZK effect, and understanding the nature of UHECRs is rapidly proceeding with the two large-scale hybrid experiments, TA and PAO. We report here the recent results from TA as of summer 2014.
2. TA experiment
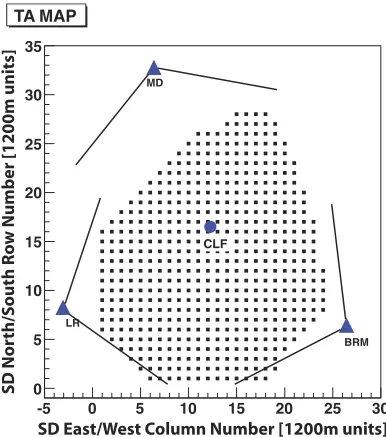
The TA is located in Utah, USA at a latitude of 39.3◦ North and a longitude of 112.9◦ West. The altitude is approximately 1400 m above the sea level. The TA encloses 507 SDs, 3 stations of FDs and several calibration devices on site (see Fig.1).
The TA SDs are deployed in a 1.2 km grid covering the ground area of 700 km2. Each SD is made of 2 layers of 1.2 cm thick, 3 m2large plastic scintillaters overlaid on
top of each other [5]. Each layer is read out independently with a PMT using wavelength shifter fibers. The waveform is locally recorded by 12bit, 50 MHz FADC for any hit with more than 0.3 Minimum Ionizing Particles (MIPs) in both scintillators in coincidence. These events are also locally histogrammed and used for the calibration. The stored waveforms are read out using a 2.4 GHz wireless network when more than 3 MIPs are recorded in 3 adjacent SDs within 8µs.
-5 0 5 10 15 20 25 30 0
5 10 15 20 25 30 35
CLF MD
BRM LR
TA MAP
SD East/West Column Number [1200m units]
SD Nor
th/South Ro
w Number [1200m units]
Figure 1. Detector layout of the TA experiment. Filled black
squares indicate the locations of the SDs, and triangles are the FD stations. The Central Laser Facility (CLF) is shown by the circle at the center of the array.
The TA FD is composed of 38 fluorescence telescopes installed in 3 FD stations at Black Rock Mesa (BRM), Long Ridge (LR) and Middle Drum (MD) surrounding the SD array. The FD at MD station, FD(MD), is instrumented with the refurbished HiRes telescopes with 5.1 m2 spherical mirror, and the FD(BRM) and FD(LR)
are newly designed telescopes with 6.8 m2spherical mirror
[6]. Each FD station monitors the night sky from 3◦to 31◦ (MD) or 33◦ (BRM, LR) in the elevation, and 112◦(MD) or 108◦(BRM, LR) in the azimuth. The readout pixel of PMT camera is approximately 1.0◦cone for all 3 stations. The PMT signal is recorded by the HiRes-1 sample and hold electronics at the MD station, and by a 10 MHz, 14-bit equivalent FADCs at the BRM and LR stations. A Central Laser Facility (CLF) is installed at the equidistant point from the 3 FD stations and regularly shoots a YAG laser into the sky for atmospheric monitoring. An Electron Light Source (ELS), a 40 MeV electron linac, is installed 100 m in front of the FD(BRM) to make an end-to-end calibration by shooting an electron beam into the sky.
3. Energy spectrum
The E3multiplied differential flux measured by the TA SD
is plotted in Fig.2 where E is the energy of the primary cosmic rays. The spectrum is composed of 17,763 events above 1018.2eV collected in 6 years of SD operation from May 2008 to May 2014. The corresponding exposure is 5400 km2sr year above 1018.8eV.
The analysis of the SD data is described in our previous publication [8]. For each SD event, the shower core location and the arrival direction were determined by fitting the shower lateral distribution and the SD hit timings with empirical formulae. For the spectrum measurement, the following cuts were applied to select events: 5 or more SDs, zenith angleθ less than 45◦, the core location
(E/eV)
10
log
18 18.5 19 19.5 20 20.5 21
]
2
eV
×
-1
sr
×
-1
s
×
-2
[ m
24
/ 10
3
E
×
J(E)
1
Differential Flux ×
3 E
Figure 2. Energy spectrum obtained from the 6-year TA SD data.
Solid black lines show the broken power law fit to the data. The red line is the extrapolation of the central segment to higher energies.
(E/eV)
10
TA SD, log
17 17.5 18 18.5 19 19.5 20 20.5 21
(E/eV)
10
TA Hybrid, log
17 17.5 18 18.5 19 19.5 20 20.5
21 Entries Entries 551551
Figure 3. Scatter plot of ESD/1.27 (abscissa) and EFD (ordinate)
for 551 hybrid events taken for May 2008 – May 2013. The red line corresponds to the equality of the rescaled ESDand EFD.
more than 1200 m inside the array boarder, and the fitting χ2 and uncertainty estimates of energy and angle are
within certain limits [8]. The energy of the reconstructed event was determined by comparing the observed particle density 800 m away from the shower axis, S(800), with the expected particle density estimated by the air shower simulation. The CORSIKA and GEANT4 simulation tools and the de-thinning method were used for the primary proton to produce large numbers of air shower particles on the ground [9]. The hadronic interaction model QGSJET-II-03 was used in the air shower generation.
The obtained SD energy, ESD, is then compared
with EFD, the energy measured by the FD for SD-FD
Table 1. Results of the BPL fit.
E1 1st break energy (ankle) 1018.70±0.02eV
E2 2nd break energy (cutoff) 1019.74±0.04eV
E1/2 GZK energy ([2]) 1019.73±0.04eV
γ1 power index for E<E1 −3.30±0.03
γ2 power index for E1<E<E2 −2.67±0.03
γ3 power index for E2<E −4.54±0.44
1018.5eV. As seen in the Figure, a simple rescaling of ESD
restores a good equality between two measured energies. The aperture and the resolution of the accepted events were calculated by generating MC events according to the measured spectrum, and applying exactly the same analysis and the selection criteria as the data. Distributions of simulated events for S(800), core location, energy, zenith and azimuth angles were checked for consistency with the distributions of data events. The acceptance is about 10% at 1018.2eV and rises to 100% above 1018.8eV. The energy resolution above 1019eV is 20% and the directional resolution is 1.0◦above 1019.7eV [8,26].
As seen in Fig.2, the energy spectrum is well fitted by a broken power law (BPL) demonstrating the structure of “ankle” and “cutoff”. These structures were first observed by the HiRes experiment[10] in 2008. The PAO also saw a strong flux suppression around this energy in 2008 [11]. The fitted BPL parameters are listed in Table1. The energy E1/2, where the integral flux with cutoff becomes lower by
a factor of 2 than the power-law extrapolation, is 1019.73eV
for the data, and it agrees well with the prediction of the GZK cutoff (1019.72eV) by Berezinsky, Gazizov and
Grigorieva [2].
Above the energy E2, 32 events are observed, whereas
85.9 events are expected if the second break (cutoff) at E2 does not exist. It signifies a 6.6 σ deviation from the
continued spectrum without the cutoff.
The observed spectrum is fitted with the expectation from the cosmic ray transport calculation and simulation [12]. The rate of cosmic ray production at redshift z is modeled as
Q(E,z)=αE−p(1+z)(3+m), E<Emax, z<zmax where p and m are the spectral index and the cosmological evolution parameter. The values of Emax=1021eV and
zmax=2.0 were used such that these parameters do not
affect the spectral shape in the fitting region. The generated protons are transported rectilinearly in the extra-galactic space, and energy losses caused by the interactions with the cosmic microwave background and infra-red photons were calculated. The calculation by the transport equation (TransportCR) and the MC simulation (CRPropa) were compared and they agreed well after some updates are applied to the CRPropa parameters [13].
The observed spectrum was fitted by optimizing 4 parameters in the transport calculation: p, m, overall normalization (α) and the energy scale (E). For the
simulated spectrum, events were generated, transported with energy loss and the energy smearing same as the data resolution was applied before histogramming in the spectrum. For the data spectrum, only the statistical error was considered in the fitting. The best fit to the
23.2 23.4 23.6 23.8 24 24.2 24.4 24.6 24.8
18.5 19 19.5 20 20.5
log(E
3 J(E)[eV 2 /m 2 /s/str])
log(Energy[eV]) Uniform
LSS
Uniform zmin = 0.01
Figure 4. TA’s 5-year energy spectrum fitted with the simulation
of extra-galactic protons. Three cases of calculation are shown: (Uniform) uniform cosmic ray source distribution as described in the text, (LSS) source distribution according to the 2MASS Galaxy Redshift Catalog (XSCz) up to 250 Mpc, and uniform beyond 250 Mpc, (Uniform zmin=0.01) uniform source
distribution for 0.01<z, but no source for z<0.01. In plotting this Figure, the best fit energy shiftE is not applied to the data, instead−E is applied to the simulated spectrum.
2 2.1 2.2 2.3 2.4 2.5 2.6 2.7
p 0
1 2 3 4 5 6 7 8 9 10
m
0.0001 0.001 0.01 0.1 1
P-value
99.7% C.L. 95.4% C.L. 68.3% C.L.
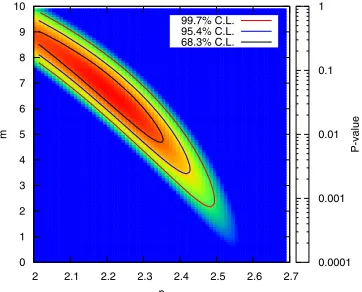
Figure 5. Permitted region of the source power index, p, and
the evolution parameter, m, of uniformly distributed cosmic ray proton sources in z<0.7.
data spectrum was obtained with p=2.2, m=6.4 and logE =−0.05 withχ2/NDF=21.3/17. It is shown in Fig.4as “Uniform”1. The best fit energy scale logE = −0.05 is well within the systematic uncertainty of 21% for the TA hybrid events [15].
Figure 4 demonstrates that the TA 5-year SD spectrum can be fitted well with uniformly distributed, cosmologically evolving cosmic ray proton sources without requiring contributions from other components. The allowed region of the p and m are shown in Fig.5. It should be noted that most particles above 1018.2eV are
1The value of logE=−0.05 means the best fit was obtained
when the measured energy is decreased by 10%. Adding the flux systematic error of ∼3% in quadrature [14] changed the best fit to p=2.2, m=6.7 and logE=−0.03 withχ2/NDF=
Figure 6. Detector layout of TALE. The TALE FD is installed
next to the FD(MD). The area between FD(MD) and the TA SD will be filled with in-fill arrays.
coming from z<0.7, and constraints in Fig.5apply only for such sources.
4. Energy spectrum by TALE
The TA Low Energy extension, TALE, is a hybrid addition to the TA installed next to the north FD station of TA, FD(MD) (see Fig.6). It is composed of 10 additional FD telescopes refurbished from HiRes observing the higher elevation of 31◦ −59◦ above the FoV of FD(MD). The azimuthal coverage is ∼100◦. An infill array of 105 SDs is located in between the TALE FDs and the TA SD with 400 m, 600 m and 1200 m spacings. The TALE SD works as an independent SD array as well as the hybrid array with TALE FDs. The TALE FDs were commissioned in September 2013. A total of 35 SDs were deployed and are being tested. The TALE and TA together will be measuring cosmic rays in a wide energy range of 1016.5eV–1020.5eV
in a single experiment. The use of Cherenkov analysis in TALE FD may decrease the energy threshold as low as 1015.5eV.
In Fig. 7, the preliminary TALE energy spectrum is plotted together with TA SD, HiRes-1 and HiRes-2 measurements. The spectrum from 1015.9eV to 1017.2eV,
designated as TALE Ckov in Fig.7, is obtained by using the TALE FD as an Imaging Atmospheric Cherenkov Telescope (IACT) [16]. The Cherenkov events seen by TALE FD are with short duration (100–600 ns) and short track often confined in one FD camera. They are distinct from the fluorescence events, and are analyzed as a FD monocular event. Its geometry is reconstructed by the profile constrained geometry fit (PCGF) developed for HiRes-1. The energy is obtained by using the Corsika/IACT simulation [17]. The spectrum from 1016.5eV to 1018eV are obtained by using the TALE FD as an air fluorescence telescope.
The whole spectrum in Fig. 7 can be fitted by the BPL with two additional breaks at 1016.3eV and 1017.2eV.
Figure 7. TA and TALE energy spectrum with the BPL fit.
TALE results in red open squares and in closed red circles are preliminary. HiRes data are from [10].
Number of Events
Events: 119 X
max [gm/cm 2]
5000 600 700 800 900 1000 1100
10 20 30 40
50 Data
Proton MC Iron MC Chi2 per DOF
Proton MC 11.2/19 Iron MC 484/9
Data
<Xmax> 745 <Energy> 18.5
Proton MC
<Xmax> 749 <Energy> 18.5
Iron MC
<Xmax> 672 <Energy> 18.5
Figure 8. XMAX distribution for energies 1018.4eV < E <
1018.6eV. Histograms are the results of MC simulations with
QGSJET-II-03 hadronic interaction model: (Blue) iron and (Red) proton. MCs are normalized to the same total number of events with the data. Events are reconstructed as the hybrid of FD(MD) and SD. The data much more closely resembles proton simulation than iron simulation.
Similar low energy features have been reported recently by KASCADE-Grande, Tibet ASγ, IceTop, Tunka and other experiments [18].
5. Composition
Information on the primary cosmic ray composition is obtained from the measurement of XMAX in the
atmosphere, which is expected to scale with ln A and ln E in average, where A is the mass number of the cosmic ray nuclide:
XMAX =Cα(ln E − ln A) + Cβ.
A most reliable way of measuring XMAX is the imaging
of shower profile by the FD. Results so far obtained on XMAXare by the stereo FD measurement from HiRes [19],
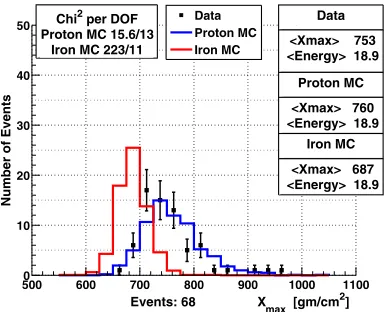
Number of Events
Events: 68 Xmax [gm/cm2]
5000 600 700 800 900 1000 1100
10 20 30 40
50 Data
Proton MC Iron MC Chi2 per DOF
Proton MC 15.6/13 Iron MC 223/11
Data
<Xmax> 753 <Energy> 18.9
Proton MC
<Xmax> 760 <Energy> 18.9
Iron MC
<Xmax> 687 <Energy> 18.9
Figure 9. Same as Fig. 8 but for energies 1018.8eV < E <
1019.0eV. The data looks very protonic as in Fig.8.
requires the SD hits thus preferring more vertical events than the stereo, the stereo analysis requires higher energy threshold than the hybrid and so forth. Our goal is to establish a consistent set of results in the XMAX
measurement among different analysis methods, and to make sure the differences between experiments are not due to the choice of different analysis methods. We report here the results of the hybrid analysis using the FD(MD) [22].
For this analysis, we selected events which were trig-gered and reconstructed independently by the monocular FD(MD) and by the SD. The FD and SD reconstructions are then combined into a hybrid analysis; the core location and impact timing information from the SD is combined with the timing information from the FD, thus improving the geometry reconstruction of the monocular FD. The shower profile was then fitted with the Gaisser-Hillas function obtained from the pre-made CORSIKA shower library to determine the best fit XMAX. Pattern recognition
cuts were developed based on the experience of event eye scanning, and were used to remove events with poor fitting quality.
We started with the good weather cut passed, fully reconstructed 1916 events for 1018.2eV <E collected in 5 years of TA runs between May 2008 and May 2013. After applying the geometrical cuts: bracketed XMAX,
θ <56◦, and the SD core location inside the array, 843
events remained. The final sample passing the pattern recognition cuts was 438 events. The XMAX resolution
with pattern recognition cuts were studied by simulation. At 1018.5eV, the X
MAX resolution was 35 g/cm2 without
pattern recognition cuts, then improved to 23 g/cm2with cuts. At 1019.5eV, the resolution was 15 g/cm2[22].
The distributions of XMAX for two energy regions
E ∼ 1018.5eV and E ∼ 1018.9eV are shown in Fig. 8
and Fig. 9 together with the MC simulation results for protons and irons 2. The MC events went through the
same reconstruction and selection procedures as the data. An elongation of XMAX is shown in Fig. 10 together
with expectations for protons and irons using various hadronic interactions models: II-03, QGSJET-01c and SYBILL 2.1.
2See [22] for other energy regions.
Energy log
10(E/eV)
max
> [gm/cm
2]
Proton
Iron
18.5 19 19.5 20
650 700 750 800 850
Data QGSJETII−03 QGSJET−01c SYBILL 2.1
Figure 10. Elongation of average XMAX. Error bars are statistical
only. MC expectation using several interaction models are shown for protons (blue) and irons (red). Both the data and the simulation include reconstruction and selection biases.
The measured average value of XMAX at 1019eV is
751±16.3(sys) ± 9.4(stat) g/cm2 and the elongation rate is 24.3±3.8(sys) ± 6.5(stat) g/cm2. Assuming a purely protonic composition, taking into account all reconstruction and acceptance biases and using the QGSJET-II-03 model, we would expect the average XMAX
at 1019.0eV to be 763 g/cm2 and the elongation rate to be 29.7 g/cm2 per energy decade. We conclude that the measured composition above 1018.2eV is consistent with
pure proton simulation: the same results as the stereo analysis using FD(BRM) and FD(LR). It is inconsistent with the pure iron simulation up to 1019.2eV, but above this energy the statistics are not enough to separate proton and iron. Considering the uncertainty of the hadronic interaction models, our results may not exclude the composition being light nucleus in this energy range.
6. Anisotropy
The PAO had shown in 2007 that arrival directions of UHECRs are correlated with AGNs in the VCV catalog in the southern hemisphere [23]. The most significant correlation was obtained for events 60 EeV< E, associating within 3.1◦with the AGN less than 75 Mpc away (or z < 0.018). After the best fit condition was determined, an independent sample of events confirmed the chance probability was 1.7×10⁻³. For the combined set of events with updated calibration, the largest correlation was obtained for events with 57 EeV<E.
Figure 11. Red crosses show the time development of AGN
correlation in the TA SD data. The abscissa is a cumulated number of events with energies 57 EeV<E andθ <45.0◦, the ordinate is the number of events correlated with the AGN within 3.1◦. The AGNs with z<0.018 were taken in the VCV catalog as in the AGN correlation search by PAO. The blue line and regions represent the expectation and uncertainty from the PAO measurement [23].
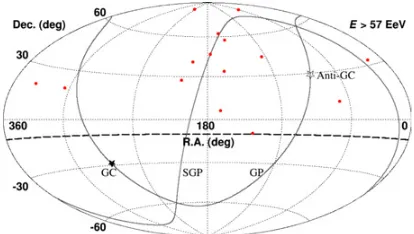
Figure 12. Sky plot of events with energies 57 EeV< E and θ <55◦in equatorial coordinates. The 5-year SD data is plotted. Galactic Plane (GP), Galactic Center (GC) and Super-Galactic Plane (SGP) are indicated. The broken line shows the limit of TA acceptance at decl.=−10◦.
tight cuts:θ <45.0◦ and the shower core to be more than 1200 m inside the array border.
In order to quantify the significance of a possible flux enhancement seen in the highest energy sample of 57 EeV <E off the Super Galactic Plane [25], we loosened the event selection to accept all events withθ <55◦and with the core location inside the array border. It increased the sample size above 57 EeV from 42 events to 72 events in the 5-year sample for the “hotspot” analysis (Fig.12). The looser cuts deteriorated the angular resolution from 1.0◦ to 1.7◦; the energy resolution became from 15% to 20% according to the simulation.
We made an oversampling of the 72 events with a circle of radius 20.0◦ in the sky plot. An average of expected number of events from the isotropic arrival direction was calculated for each point of the sky by producing 100 k sets of 72 MC events uniformly thrown over the sky (exposure∝sin(θ) cos(θ)). The maximum deviation from the isotropic expectation was then searched over the sky with 0.1◦step.
The obtained significance map is shown in Fig.14. The largest deviation of 5.1 σ occurred at R.A.=146.7◦ and decl.=43.2◦, where 19 data events were found within the
Figure 13. Skyplot of events in the 6th year only.
Figure 14. Significance of flux enhancement. Oversampling with
20◦ radius circle is made for events in Fig. 12. The random background was calculated by throwing 100 k sets of 72 isotropic MC events. The maximum significance is reached at R.A.= 146.7◦ and decl.=43.2◦. The Li-Ma significance of this spot is 5.1σ.
circle of r=20◦, and 4.49 events were expected from the isotropic arrival distribution [26].
We estimated a chance probability of this “hotspot” to appear from the isotropic arrival distribution by simulation: 1M sets of 72 events with isotropic distribution were generated and analyzed in the same way as the data by searching for the sky direction to give the maximum deviation. In the search for the maximum deviation, we not only searched with r=20◦ but also included the searches with r=15◦, 25◦, 30◦, 35◦. This is to compensate a potential “eye-ball scan” we might have made unintentionally in selecting the radius of 20◦.
Out of 1M sets simulated, we found 37 sets whose maximum significance exceeded 5.1 σ. The chance probability of the hotspot appearing from the isotropic distribution somewhere in the TA’s acceptance (direction of hotspot) and with the radius of 15◦–35◦(size of hotspot). was determined to be 3.7×10⁻⁴or 3.4σ.
We repeated the same analysis for the data collected in the 6th year, May 2013−May 2014. We obtained 15 additional events above 57 EeV by the same loose cuts (see Fig.13) and 4 events are found in the hot spot determined by the 5-year data sample. For all the data collected in 6 years, the significance of the hotspot increased to 5.55σ and the chance probability for getting more than 5.55σ from the isotropy advanced to 4.0 σ (from the 3.4 σ of the 5-year data).
Figure 15. Planned detector layout of TA×4. Additional SDs and FDs will be installed on the east side of the existing TA. The SD area will be quadrupled for the highest energy events.
layout is shown in Fig.15. The SDs of the same design will be deployed with a larger spacing of 2.1 km extending east of the existing TA SD array. The new array will be 96% efficient at 57 EeV for the trigger and reconstruction, and the SD acceptance will be quadrupled to∼3000 km2 above this energy. The efficiency at 1019eV is expected
to be 26%. The new FD stations will be composed of refurbished HiRes telescopes with FADC readout already used for the TALE FD telescopes.
7. Prospects
The construction of TA×4 will take 2 years, and the corresponding budgets have been applied in Japan, USA, Korea and Russia. After 3 years of operation in 2018– 2020, TA×4 will accumulate 21-year equivalent of TA SD data and 18-year equivalent of TA hybrid data, if the construction is approved in 2015. With ∼250 events collected above 57 EeV by 2020, the hotspot may be established at 7 σ or higher and properties of the hotspot such as the energy spectrum, the composition and finer sub-structure will be studied. There may be other weaker hotspots appearing in the northern sky. The XMAX
information will be available in the cutoff region, and the cutoff shape will be studied in detail with respect to the expectation of the GZK cutoff [27].
8. Summary
In this conference, we presented the energy spectrum and the anisotropy measured by TA using 6 years of SD data. We also presented XMAX results analyzed in the hybrid
mode.
The observed spectrum above 1018.2eV shows a dip at
1018.7eV and a cutoff at 1019.7eV. These features are well reproduced by the model calculation of the GZK process: energy loss of extra-galactic protons by the interaction with the CMB and IR background. The simulation suggested a
source spectrum of E−2.2and source evolution of (1+z)6.4
for z< 0.7.
A comparison of XMAX distribution with model
simulations (QGSJET-II-03), we showed the primary com-position is consistent with 100% proton and inconsistent with 100% iron for energies 1018.2eV<1019.2eV. Due to
the ambiguities arising from hadronic interaction models, we can not refute an inclusion of light nuclei in the same energy range. The energy region above 1019.2 requires
more statistics for a better suggestion of the composition. Above the cutoff energy, 57 EeV <E, we observed a hotspot near the direction of Ursa-Major with a size of r=20◦. The probability of this hotspot being formed by chance from the isotropic distribution is 4σ. The center of the hotspot is 19◦ off from the Super-Galactic Plane, and there is no immediate candidate of the UHECR source nearby.
Further studies of UHECRs at TA will continue with an extension project TA×4, which will quadruple the SD acceptance and double the hybrid acceptance at the highest energy by 2017.
The Telescope Array experiment is supported by the Japan Society for the Promotion of Science through Grants-in-Aid for Scientific Research on Specially Promoted Research (21000002) “Extreme Phenomena in the Universe Explored by Highest Energy Cosmic Rays”, and the Inter-University Research Program of the Institute for Cosmic Ray Research; by the U.S. National Science Foundation awards 0307098, 0601915, 0703893, 0758342, 0848320, PHY-1069280, and PHY-1069286 (Utah) and PHY-0649681 (Rutgers); by the National Research Foundation of Korea (2006-0050031, 2007-0056005, 2007-0093860, 2010-0011378, 2010-0028071, R32-10130); by the Russian Academy of Sciences, RFBR grants 10-02-01406a and 11-02-01528a (INR), IISN project No. 4.4509.10 and Belgian Science Policy under IUAP VI/11 (ULB). The foundations of Dr. Ezekiel R. and Edna Wattis Dumke, Willard L. Eccles and the George S. and Dolores Dore Eccles all helped with generous donations. The State of Utah supported the project through its Economic Development Board, and the University of Utah through the Office of the Vice President for Research. The experimental site became available through the cooperation of the Utah School and Institutional Trust Lands Administration (SITLA), U.S. Bureau of Land Management and the U.S. Air Force. We also wish to thank the people and the officials of Millard County, Utah, for their steadfast and warm support. We gratefully acknowledge the contributions from the technical staffs of our home institutions as well as the University of Utah Center for High Performance Computing (CHPC).
References
[1] K. Greisen, Phys. Rev. Lett. 16, 748-750 (1966); G.T. Zasepin, V.A. Kuz’min, JETP Lett. 4, 78–80 (1966) [2] V. Berezinsky, A. Gazizov, S. Grigorieva, Phys. Rev.
D74, 043005 (2006)
[3] R.M. Baltrusaitis et al., Nucl. Instr. and Meth. A240, 410–428 (1985)
[4] T. Abu-Zayyad et al., Nucl. Instr. and Meth. A450, 253–269 (2000)
[6] H. Tokuno et al. Nucl. Instr. and Meth A676, 54–65 (2012)
[7] J. Abraham et al., Pierre Auger Collaboration, Nucl. Instr. and Meth. A523, 50–95 (2004)
[8] T. Abu-Zayyad et al., Telescope Array Collaboration, Astrophys. J. 768, L1 (2013)
[9] B.T. Stokes, R. Cady, D. Ivanov, J.N. Matthews and G.B. Thomson, Astropart. Phys. 35, 759–766 (2012)
[10] R.U. Abbasi et al., HiRes Collaboration, Phys. Rev. Lett. 100, 101101 (2008)
[11] J. Abraham et al., Pierre Auger Collaboration, Phys. Rev. Lett. 101, 061101 (2008)
[12] For early version of this analysis, see E. Kido, O. E. Kalashev, Proceedings of the 33rd ICRC (2013), Rio de Janeiro
[13] O.E. Kalashev and E. Kido, arXiv.1406.0735v1 (2014)
[14] D. Ivanov, PhD thesis, Rutgers University, 2012 [15] T. Abu-Zayyad et al., TA Collaboration, Astropart.
Phys. 61, 93–101 (2015)
[16] T. Abu-Zayyad, APS April meeting (2014) [17] K. Bernloehr, Astropart. Phys. 30, 149–158 (2008)
[18] See proceedings of this conference (ISVHECRI-2014)
[19] R.U. Abbasi et al., HiRes Collaboration, Astrophys. J. 622, 910–926 (2005); R.U. Abbasi et al., HiRes Collaboration, Phys. Rev. Lett. 104, 161101 (2010) [20] J. Abraham et al., Pierre Auger Collaboration, Phys.
Rev. Lett. 104, 091101 (2010); A. Aab et al., Phys. Rev. Lett., D90, 122005 (2014); A. Aab et al., arXiv.1409.5083v1(2014)
[21] Y. Tameda, Proceedings of the 33rd ICRC (2013), Rio de Janeiro
[22] R.U. Abbasi et al., The TA Collaboration, Astropart. Phys 64, 49–62 (2015)
[23] J. Abraham et al., The Pierre Auger Collaboration, Science 318, 938–943 (2007)
[24] K.-H. Kampert and P. Tinyakov, Comptes Rendus Physique 15, 318–324 (2014)
[25] P. Tinyakov, Proceedings of the 33rd ICRC (2013), Rio de Janeiro
[26] T. Abu-Zayyad et al., The TA Collaboration, Astrophys. J. 790, L21 (2014)