Penny A. (2017) Presence of time-dependent diffusion in
the brachial plexus. Magnetic Resonance in Medicine .
ISSN 1522-2594
Access from the University of Nottingham repository:
http://eprints.nottingham.ac.uk/44119/1/MRM_26733%20%28002%29.pdf
Copyright and reuse:
The Nottingham ePrints service makes this work by researchers of the University of
Nottingham available open access under the following conditions.
This article is made available under the University of Nottingham End User licence and may
be reused according to the conditions of the licence. For more details see:
http://eprints.nottingham.ac.uk/end_user_agreement.pdf
A note on versions:
The version presented here may differ from the published version or from the version of
record. If you wish to cite this item you are advised to consult the publisher’s version. Please
see the repository url above for details on accessing the published version and note that
access may require a subscription.
Zaid B.
AQ2 AQ6
Mahbub
,
1,2Andrew M.
Peters
,
2and
Penny A.
Gowland
2*
Purpose:This work describes the development of a method
to measure the variation of apparent diffusion coefficient (ADC) with diffusion time (D) in the brachial plexus, as a potential method of probing microstructure.
Methods:Diffusion-weighted MRI with body signal
suppres-sion was used to highlight the nerves from surrounding tis-sues, and sequence parameters were optimized for sensitivity to change with diffusion time. A porous media-restricted diffu-sion model based on the Latour-Mitra equation was fitted to the diffusion time-dependent ADC data from the brachial plexus nerves and cord.
Results:The ADC was observed to reduce at long diffusion
times, confirming that diffusion was restricted in the nerves and cord in healthy subjects.T2of the nerves was measured to be 8065 ms, the diffusion coefficient was found to vary from (1.560.1)103mm2/s at a diffusion time of 18.3 ms to (1.060.2)103mm2/s at a diffusion time of 81.3 ms.
Conclusion:A novel method of probing restricted diffusion in
the brachial plexus was developed. Resulting parameters were comparable with values obtained previously on biological sys-tems. Magn Reson Med 000:000–000, 2017.VC2017 Interna-tional Society for Magnetic Resonance in Medicine.
Key words: brachial plexus; ADC; diffusion time; restricted
diffusion
INTRODUCTION
The brachial plexus provides motor and sensory innerva-tion to the upper extremities, and its funcinnerva-tion can be compromised in disorders such as cervical spondylosis, radiculopathy, and/or myelopathy. Quantitative MRI may provide a means of monitoring changes in tissues particularly during response to therapy. In particular, diffusion, and the effects of hindered or restricted diffu-sion, may provide information about changes in tissue microstructure.
MRI can be used to measure both the apparent diffu-sion coefficient (ADC), and the diffudiffu-sion time (D) depen-dence of the ADC, which is an indicator of compartment size. At short diffusion time, most water molecules are unlikely to have diffused far enough to interact with the
boundaries, but at longer diffusion times the measured ADC will be reduced if molecular motion is restricted within, or hindered between, axons. In the brachial plexus, the diameter of the nerve fibers is the range between 5 and 15mm (1,2) with smaller distances between them, so assuming a free water diffusion coeffi-cient of D¼2103 mm2/s at body temperature (3), the molecular displacement would be hindered or restricted at times up to 50 ms, which overlaps the accessible range of diffusion times for a human MR scanner. Thus, it should be possible to use diffusion MRI to probe changes in the size or spacing of axons in the brachial plexus.
In order to allow comparison between subjects, it is useful to be able to parameterize the diffusion time dependence of the ADC. Various models have been used to do this, including the intra-axonal restricted and extra-axonal hindered diffusion (CHARMED) model (4,5), models considering cell membrane hindering (6), and models considering cell membrane permeability and density effects (7). Here, we have used the porous media model (8,9), which provides a simple, physically based method for parameterizing the diffusion time depen-dence of ADC (D(D)), based on the Mitra equations (10–13). This model was initially proposed for use in biological tissues (14) and has been applied to various biological systems in vivo (15) and ex vivo (8,16,17) and to microstructure phantoms (18,19), but, as we are aware, it has never previously been used for in vivo human tis-sues. For restricted diffusion in porous media, Latour et al (14) simplified the model using a Pade approximant to Equation [1]:
DðDÞ ¼Do 1 11 a
cpffiffiffiffiD þð1a1ÞD
u
11
a
þcpffiffiffiffiDþð1a1ÞD u 0 @ 1 A 8 < : 9 = ; [1]
where Do is the unrestricted self-diffusion coefficient, D
is the diffusion time,c¼ 4 9pffiffiffip
S V
ffiffiffiffiffiffi
Do
p
,u is a time scaling factor, which depends on the characteristic size of restricting and hindering microstructure,ais the (dimen-sionless) tortuosity index of the medium, relevant in the long D regime in which spins diffuse greater distances than the characteristic restriction lengths and hence sam-ple the connectivity of spaces within the tissue, andS/V
(mm1) is the surface-to-volume ratio of the medium reflected in the shortDregime where surfaces are probed by a fraction of molecules.
MRI of the brachial plexus is technically challenging because of the size and location of the nerves, which can result in problems in identification, partial volume errors, distortion, and artefacts, but diffusion-weighted imaging (DWI) with background suppression (DWIBS)
1
Department of Arts & Sciences, Ahsanullah University of Science & Tech-nology, Dhaka, Bangladesh
AQ3 .
2
Sir Peter Mansfield Imaging Centre, School of Physics & Astronomy, Uni-versity of Nottingham, United Kingdom.
Grant sponsor: Islamic Development Bank (IDB); Grant sponsor: Medical Research Council (MRC); Grant number: G0901321.
*Correspondence to: Penny Gowland, SPMIC, School of Physics and Astronomy, University of Nottingham, NG7 2RD, United Kingdom. E-mail: [email protected]
AQ5
Received 17 October 2016; revised 18 March 2017; accepted 2 April 2017 DOI 10.1002/mrm.26733
Published online 00 Month 2017 in Wiley Online Library (wileyonlinelibrary. com).
(20,21) provides a method of isolating nerves from the other soft tissues (22). DWIBS uses inversion recovery to null the fat signal independent of frequency offset and
T2 and diffusion weighting to suppress surrounding tis-sues. The resulting images can be reconstructed as maxi-mum intensity projections (MIPs) to illustrate the relative positions of the nerve roots and nerve paths. Several qualitative studies using DWIBS have shown that this technique has potential value in the assessment of pathological changes, including in the brachial plexus (22–26).
The aim of this work was to develop a robust method for measuring the diffusion time dependence of ADC (D(D)) in the brachial plexus nerves and cord, and to parameterize the results using the porous media-restricted diffusion model.
METHODS
A sequence was written to allow the diffusion time (D) to be varied for fixedb values (Fig.
F1 1) and optimized to
measure diffusion time-dependent changes in a diffusion coefficient. Initial experiments were performed to inves-tigate any nondiffusive effects in the DWI signals from the brachial plexus (i.e., intravoxel incoherent motion [IVIM], taken to include any dephasing attributed to non-diffusive motion), and to determine theT2of the nerves (27,28). Finally, the sequence was used to assessD(D) in the brachial plexus.
Development of the Sequence
The sequence shown in Figure 1 (which defines timing parameters) was coded on a 3 T Philips Achieva scanner (Philips Medical Systems, Best, The Netherlands). The three gradient coils were driven simultaneously to pro-duce the maximum achievable diffusion gradient, which was necessary to be able to vary diffusion time within a reasonable echo time (TE), particularly given that it would not be possible to vary both diffusion time and diffusion direction in a feasible scanning time. This pro-vided diffusion encoding at 45 to the x-axis and 700to
the z-axis of the scanner, which is approximately per-pendicular to the fibers of the brachial plexus as they curve around the neck.
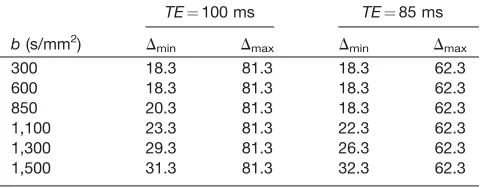
The maximum achievable value of diffusion timeDmax is limited by echo time (TE¼Dþtd1þtd2þdþj), and for a given value ofb the minimum diffusion time Dmin is determined by the maximum achievable gradient amplitude. Table1 shows the range of accessible values T1 ofD, determined by considering achievable values of gra-dient lobe length (d), delay times (td1and td2), and gradi-ent amplitudes (G) for required values of b and TE, assuming the time between the end of the second gradi-ent lobe and the cgradi-enter of k-space wasj¼19.7 ms for the Philips Achieva 3T scanner used (Philips Medical Systems).
Optimization of Sequence Parameters
[image:3.612.101.500.62.245.2]Within the constraints of the limited information avail-able about the geometry and permeability of the nerve fibers, we attempted to maximize sensitivity to changes in ADC across the range of accessible diffusion times ðDðDÞÞ. For clinical imaging systems, long echo times are required to assess restricted or hindered diffusion, which reduces the signal-to-noise ratio (SNR) of the data and leads to a trade-off between contrast and sensitivity. Ide-ally, one would want to probe the variation in ADC across a wide range of diffusion times, but that is not FIG. 1. DWIBS sequence with timing parameters.TE¼Dþtd1þtd2þdþjand it can be seen that variations in the delay times td1, td2, and gradient amplitudes G result in the required diffusion timesDminandDmaxat fixed b-values. (Left to Right 1st part) G(Dmax) G(Dmin)Dmax
d j, (Left to Right 2nd part) td1(Dmax)Dmintd2(Dmax) EPI readout, (Left to Right 3rd part) 90td1(Dmin) 180td2(Dmin), (Bottom) TE.
COLOR
IN
ONLINE
AND
Table 1
Range of Achievable Diffusion TimeDat Different b-values, for
d¼10 ms andTE¼100 or 85 ms, on the 3T Philips Achieva Scanner.
b(s/mm2)
TE¼100 ms TE¼85 ms
Dmin Dmax Dmin Dmax
300 18.3 81.3 18.3 62.3
600 18.3 81.3 18.3 62.3
850 20.3 81.3 18.3 62.3
1,100 23.3 81.3 22.3 62.3
1,300 29.3 81.3 26.3 62.3
1,500 31.3 81.3 32.3 62.3
[image:3.612.313.554.659.753.2](Eq. [2]):
KðDmin;DmaxÞ ¼D1ðDminÞ D2ðDmaxÞ [2]
where D1 is the ADC measured at short diffusion time (Dmin) and D2 is the ADC measured at long diffusion time (Dmax). We then defined the contrast to noise in dif-fusivity difference as shown by Equation [3]:
GKðDmin;DmaxÞ ¼
KðDmin;DmaxÞ
sK
[3]
Ideally, we would sample diffusion at a range of b values and a range of diffusion times, but this is not feasible in vivo. It has previously been shown that for pure Brow-nian motion, the diffusion coefficient (D) is optimally measured at two b values (29–31) and we used these val-ues as the best estimate for this initial work (Eq. [4]):
D¼lnS1lnS2
b2b1
[4]
whereS1andS2are the signals atb1andb2, respectively (Eq. [5]):
Si¼S0eðbiDÞeðTE=T2Þ; i ¼ 1;2 [5]
By propagation of errors, the variance in the calculated value ofDis given by Equation [6]:
s2D¼ s
2
S
ðb2b1Þ2
1
S0e
TE T2 2ðe
2b1Dþe2b2DÞ [6]
(whererSis the variance of the noise in the raw images),
which has a minimumsDforb2D¼1.1 (29,31).
The variance inKis given by Equation [7]:
sK ¼ ðs2D1þs 2
D2Þ 1=2
[7]
and substituting from Equation [6], this gives Equation [8]:
sK¼
s2S
ðb2b1Þ2
S0ðb1Þ 2
e2TE T2
2þe2ðb2b1ÞD1þe2ðb2b1ÞD2
2 6 4 3 7 5
1=2
[8]
This analysis neglects the effect of the Rician noise dis-tribution, and, experimentally, data points below the noise floor were removed (see Methods). To estimateGK,
an estimate of the change in ADC with diffusion time is required. Therefore, a Monte Carlo simulation of diffu-sion restricted by impermeable boundaries with different restriction sizes (R) was used to estimate the change in ADC with D for different values of TE. It was assumed thatb1¼0 andb2¼50, 100, 150, 200, 250, 300, 400, and 500 s/mm2, although ifb
1had to be greater than zero for
T2¼100 ms.
In Vivo Measurements
Eight healthy volunteers (4 male) aged 25 to 55 years were recruited with approval from the ethics committee of University of Nottingham Medical School (Notting-ham, UK) and participated in an experiment to 1) assess IVIM effects (a subgroup of 5 subjects participated; 3 male, aged 22–55 years), 2) measure T2, and 3) assess the diffusion time-dependent ADC in the brachial plexus. We repeated both experiments twice (three times for 1 volunteer) with a gap of at least 2 months to allow a qualitative assessment of reproducibility. MR Images of the brachial plexus were acquired using the cranial ele-ments of the Torso XL 16 channel array coil, which was centered over the subject’s thorax with padding used to prevent it touching the face.
The DWIBS scan consisted of a short tau inversion recovery images, fat-suppressed, multislice, single-shot echo planar imaging (EPI) readout with pulse gradient spin echo preparation. Axial/oblique scans were cen-tered on the C5/C6 disc so that the imaged volume encompassed the C5 to T1 nerves in the cervical spine. The imaging parameters were field of view 19254300 mm, 3-mm isotropic voxels, 18 slices with no gap, water/fat shift of 4.64 pixels, sense encoding (SENSE) factor¼2, EPI factor of 35, anterior-posterior fold-over direction, volume shimming with repetition time (TR)¼8,813 ms, and inversion time¼220 ms. The data acquisition was repeated to give two samples within each scanning session.
Initially to assess IVIM effects, subjects were scanned at b¼0, 25, 50, 75, 100, 300, 500, 700, and 900 s/mm2 withTE¼60 ms,D¼28.3 ms, andd¼10 ms and a refer-ence agar phantom placed above the subject’s shoulder. A log-linear plot was used to identify the b value corre-sponding to reasonable separation between large-scale motion and diffusion. To measure T2, data were acquired for TE¼55, 60, 65, 70, 75, and 80 ms with
b¼600 s/mm2, D¼28.3 ms, d¼10 ms, and TR¼6,000 ms.T2 was calculated by weighted linear square fit to a monoexponential decay. Finally, to study the diffusion time dependence of ADC, data were acquired atb¼300 and 600 s/mm2, D¼18.3, 25.3, 33.3, 41.3, 49.3, 57.3, 65.3, 73.3, and 81.3 ms, d¼10 ms, and TE¼100 ms. Data were also acquired from a phantom containing agar gel (4% [wt/wt] agar).
of a voxel causing much of the signal to be partial vol-umed between voxels. This approach allowed us to quantify the signal taking account of signals distributed across a number of voxels, and empirically this function fitted the nerve signal profile well. Any peak less than twice the standard deviation of the locally assessed noise was neglected to avoid errors from Riccian noise, partic-ularly in the IVIM analysis where low-signal data were acquired (32–34). The cord region of interest was selected on the raw transverse images, and a similar pro-cess was applied. This analysis was repeated for each acquisition separately and the results were averaged across the two samples and both sides of the neck. ADC values of nerves and cord were then calculated (Eq. [2]).
The variation of ADC with diffusion time was plotted and averaged over all visits for nerves and cord sepa-rately. The resulting data were fitted to Equation [1] for tortuosity (a) and surface-to-volume ratio (S/V) using the nonlinear least square fitting function in Matlab (The MathWorks, Inc., Natick, MA, USA). For this fit, the self-diffusion coefficientD0was derived by linear extrapola-tion of a plot of D(D) versus pffiffiffiffiffiffiD to D¼0 and the time scaling factor u estimated from the relation ffiffiffiffiffiffiffiffiD0u
p
neu-ron size as previously proposed (14,15).
RESULTS
Figure
F3 3 shows the simulated variations in the contrast to noise in diffusivity difference (GK) with b value, for
different ranges of D achievable at different echo times. Similar results were obtained by varyingT2or restriction
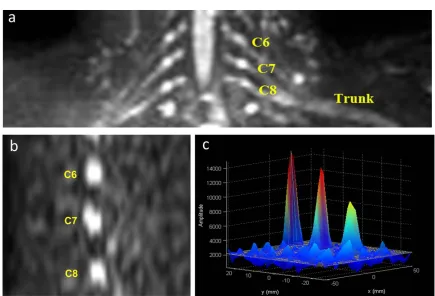
size. The simulation also confirmed that short gradient lobes (small d) and high b values maximized sensitivity to diffusion time. From these results, the difference FIG. 2. (a) Coronal view MIP of brachial plexus, obtained using DWIBS with b¼300 s/mm2. C6, C7, and C8 nerves are identified and used for positioning of sagittal view slices. (b) Sagittal view of brachial plexus showing locations of C6, C7, and C8 nerve roots at b¼300 s/mm2. (c) Corresponding 2D Gaussian fitting showing peak for each nerve.
COLOR
IN
ONLINE
AND
FIG. 3. Variation of contrast-to-noise ratio in the diffusion time dependence of the measured diffusion coefficient (GK) with b-value at a range of D for different TE andd¼10 ms. *TE¼110 ms; 䉫TE¼100 ms; TE¼85 ms; blue for R¼20mm, black for R¼5mm.
COLOR
IN
ONLINE
AND
between the high and low b value used experimentally was selected to be 300 s/mm2.
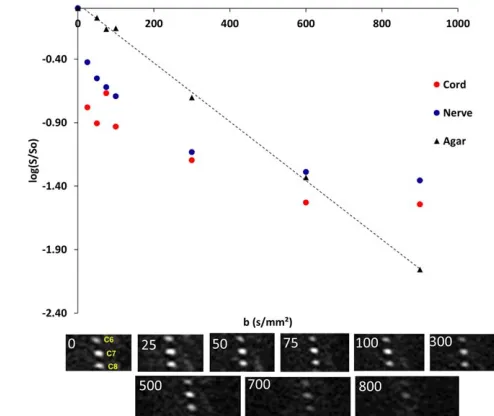
Figure
F4 4 shows that the diffusion curve was approxi-mately biexponential, withb¼300 s/mm2providing rea-sonable separation between IVIM and diffusion effects, and thus this value was selected as the low b value for subsequent measurements. The measured IVIM and T2 parameters are shown in Table
T2 2.
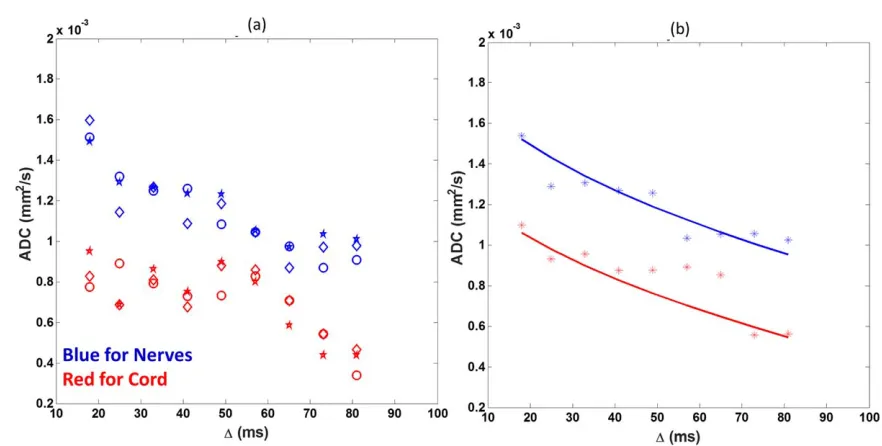
Figures
F5 5a shows the variation in ADC with D for 1 representative subject (the subject that was scanned three times), and Figure 5b shows the fit to the Latour-Mitra equation superimposed on the subject-averaged data. The average ADC was higher in the nerve than the cord at all values of diffusion time. Table 2 summarizes the results of fitting the data to the Latour-Mitra equation. No variation with diffusion time was observed for agar phantoms [ADC¼(1.560.008)103 mm2/s at room temperature].
DISCUSSION
This study detected restricted diffusion in the human brachial plexus in vivo using the DWIBS sequence on a clinical MRI scanner. Measured ADC values were in the
sion was restricted or hindered in these tissues. The lon-gest accessible diffusion time, Dmax¼81.3 ms, corresponded to a mean diffusion length of 13mm, which is similar to the diameter of the largest fibers in the brachial plexus nerves and cord, and the lack of an asymptote at high D indicates that diffusion was not fully restricted at the longest diffusion time, consistent with extra-axonal contributions. The short diffusion time,Dmin¼18.3 ms, probed a mean molecular displace-ment of around 8mm, which corresponds to the diame-ters of the middle-range fibers, suggesting that sensitivity to observing smaller fibers could be achieved by using shorter diffusion times if larger gradients were available. The definition of diffusion time used here (Fig. 1) does not fully consider the effects of movement during the gradient pulses.
The measured T2 values were comparable with previ-ous results (36). The longer values recorded in the cord and the greater intra-subject variation may indicate cere-brospinal fluid contributions or motion artefacts. It was also found that IVIM-type effects contributed to signals from the nerves and cord collected at b<300 s/mm2. This was assessed forD¼28.3 ms and it would be inter-esting to investigate how these effects vary with diffu-sion time. Thebvalue used for diffusion time-dependent measurements was optimized to maximize the sensitivity to a change in measured diffusion coefficient with diffu-sion time (GK), for accessible scanner timing parameters,
based on a simple Monte Carlo simulation of restricted diffusion within a simplified model. GK decreased at short TE over the range considered because the accessi-ble range of D was small. GK decreased at high b value because the SNR in the measured value of D fell, and decreased at low b value because the absolute variation in D with D was small, giving a maximum in GK at b 300 s/mm2. In practice, the low b value used in vivo (b1) needed to be 300 s/mm2 to eliminate IVIM-type effects; therefore, given that the accessible range of diffu-sion time was similar across a wide range of b values (Table 1), the highb value used in vivo (b2) was 600 s/ mm2.
[image:6.612.50.297.73.281.2]The diffusion time dependency of the ADC data was fitted to the Latour-Mitra porous media model. The mea-sured values ofa and S/V were in the range previously obtained for other biological samples such as red blood FIG. 4. Example IVIM plots for brachial plexus nerves, cord, and
agar phantom. Agar phantom (black) shows a linear change with b-values because there is no IVIM effect. However, nerve (blue) and cord (red) signals show nonlinear behavior. Below the graph is shown a set of images from the IVIM data set showing the C6, C7, and C8 nerves for the range of b-values indicated on the fig-ures (s/mm2). Cord, Nerve, Agar.
COLOR
IN
ONLINE
AND
[image:6.612.62.556.688.753.2]Table 2
Measured Values ofT2, IVIM Parameters, and the Latour-Mitra Equation Fitting Parameters andaandS/V(Intersubject Mean and Standard Deviation).
Region T2(ms)
IVIM Results Measured forD¼28.3 ms Latour-Mitra Equation Fit
f
D* (103mm2/s)
D (103mm2/s)
D0 (103mm2/s)
u
(102s) a
cells and cerebral tumors (8,15).S/V and a relate to the characteristic sizes of the structures restricting or hinder-ing the diffusion, so the smaller values of S/V in the nerve would be expected given that the fibers are larger with consequently larger interfiber spaces than in the cord, and the larger values ofafound in the nerves indi-cate greater hindrance to movement of water molecules than in the cord. However, the tortuosity a cannot be estimated reliably unless a high-diffusion time asymptote is reached, which was not detected in the cord and was not clearly detected in the nerve in this work. The Latour model is inherently a 3D model, but, in this case, we were applying it to a system that is restricted in only two dimensions and were only encoding diffusion in one direction, which was not exactly perpendicular to the nerve fibers. This will alter the physical interpreta-tion of the fitted parameters and also make them depen-dent on the exact orientation of the diffusion gradients relative to the nerve fibers. This could be overcome in the future by ensuring that diffusion is measured in an anatomically consistent direction.
Future work should focus on measuring this parameter in a range of nervous tissue and should consider other restricted diffusion models. Assessment of microstruc-ture in the peripheral nerves has potential in monitoring inflammatory neuropathies, and so future work should also investigate whether diffusion time-dependent ADC provides additional clinical information, and, if so, the optimum diffusion time would provide sensitivity to changes in disease.
CONCLUSION
We have developed a novel method of probing restricted and hindered diffusion in the brachial plexus nerves and cord. The porous media, time-dependent diffusion model was used to characterize restricted diffusion in these tis-sues. Resulting estimates of the surface to volume ratio
and tortuosity were comparable with values obtained previously on biological systems and can give informa-tion about the intra-axonal and extra-axonal spaces.
REFERENCES
1. Bonnel F. Microscopic anatomy of the adult human brachial plexus: an anatomical and histological basis for microsurgery. Microsurgery 1984;5:107–117.
2. Sunderland S, Bradley K. The cross-sectional area of peripheral nerve trunks devoted to nerve fibres. Brain 1949;72:428–449.
3. Le Bihan D, Delannoy J, Levin RL. Temperature mapping with MR imaging of molecular diffusion: application to hyperthermia. Radiol-ogy 1989;171:853–857.
4. Assaf Y, Basser PJ. Composite hindered and restricted model of diffu-sion (CHARMED) MR imaging of the human brain. NeuroImage 2005; 27:48–58.
5. Assaf Y, Blumenfeld-Katzir T, Yovel Y, Basser PJ. AxCaliber: a method for measuring axon diameter distribution from diffusion MRI. Magn Reson Med 2008;59:1347–1354.
6. Le Bihan D. Molecular diffusion, tissue microdynamics and micro-structure. NMR Biomed 1995;8:375–386.
7. Novikov DS, Fieremans E, Jensen JH, Helpern JA. Random walks with barriers. Nat Phys 2011;7:508–514.
8. Latour LL, Svoboda K, Mitra PP, Sotak CH. Time-dependent diffusion of water in a biological model system. Proc Natl Acad Sci U S A 1994;91:1229–1233.
9. Sigmund EE. Perspectives on porous media MR in clinical MRI. AIP Conf Proc 2011;1330:13–16.
10. Mitra PP. Diffusion in porous materials as probed by pulsed gradient NMR measurements. Physica A 1997;241:122–127.
11. Mitra PP, Sen PN, Schwartz LM. Short-time behavior of the diffusion coefficient as a geometrical probe of porous media. Phys Rev B Con-dens Matter 1993;47:8565–8574.
12. Mitra PP, Sen PN, Schwartz LM, Le Doussal P. Diffusion propagator as a probe of the structure of porous media. Phys Rev Lett 1992;68: 3555–3558.
13. Sen PN. Time-dependent diffusion coefficient as a probe of geometry. Concepts Magn Reson Part A 2004;23A:1–21.
14. Latour LL, Mitra PP, Kleinberg RL, Sotak CH. Time-dependent diffu-sion coefficient of fluids in porous media as a probe of surface-to-volume ratio. J Magn Reson 1993;101:342–346.
[image:7.612.83.524.67.290.2]15. Helmer KG, Dardzinski BJ, Sotak CH. The application of porous-media theory to the investigation of time-dependent diffusion in in vivo systems. NMR Biomed 1995;8:297–306.
FIG. 5. Measured variation in ADC withDfor nerves and cord of the brachial plexus for (a) subject 1 with each repeat of the measure-ment being indicated by a different marker. (b) Data averaged over repeated measurements for 8 subjects, with fit to the Latour equa-tion superimposed. Cord Data, Nerve Data, Cord Data fit Nerve Data fit.
COLOR
IN
ONLINE
AND
18. Fieremans E, De Deene Y, Delputte S, Ozdemir MS, D’Asseler Y, Vlassenbroeck J, Deblaere K, Achten E, Lemahieu I. Simulation and experimental verification of the diffusion in an anisotropic fiber phantom. J Magn Reson 2008;190:189–199.
19. Parsons EC, Does MD, Gore JC. Temporal diffusion spectroscopy: the-ory and implementation in restricted systems using oscillating gra-dients. Magn Reson Med 2006;55:75–84.
20. Takahara T, Imai Y, Yamashita T, Yasuda S, Nasu S, Van Cauteren M. Diffusion weighted whole body imaging with background body signal suppression (DWIBS): technical improvement using free breathing, STIR and high resolution 3D display. Radiat Med 2004;22: 275–282.
21. M€urtz P, Krautmacher C, Tr€aber F, Gieseke J, Schild H, Willinek W. Diffusion-weighted whole-body MR imaging with background body signal suppression: a feasibility study at 3.0 Tesla. Eur Radiol 2007; 17:3031–3037.
22. Takahara T, Hendrikse J, Yamashita T, Mali WP, Kwee TC, Imai Y, Luijten PR. Diffusion-weighted MR Neurography of the brachial plexus: feasibility study. Radiology 2008;249:653–660.
23. Vargas MI, Viallon M, Nguyen D, Beaulieu JY, Delavelle J, Becker M. New approaches in imaging of the brachial plexus. Eur J Radiol 2010; 74:403–410.
24. Yamashita T, Kwee TC, Takahara T. Whole-body magnetic resonance neurography. N Engl J Med 2009;361:538–539.
25. M€urtz P, Kaschner M, Lakghomi A, Gieseke J, Willinek WA, Schild HH, Thomas D. Diffusion-weighted MR neurography of the brachial
Meeting of ESMRMB, Lisbon, Portugal, 2012. p. ePoster-56.
28. Z B Mahbub PG. Measurement of magnetization transfer effects in the brachial plexus: comparison with T2 and Diffusion effects. In Proceedings of the 21st Annual Meeting & Exhibition of ISMRM, Salt
Lake City, UT, USA 2013. p. 1219. AQ4
29. Conturo TE, McKinstry RC, Aronovitz JA, Neil JJ. Diffusion MRI: preci-sion, accuracy and flow effects. NMR in Biomedicine 2005;8(7):307–332. 30. Jones DK. Optimal approaches to diffusion MRI acquisition. In Jones
DK, ed. Diffusion MRI: Theory, Methods, and Applications. Oxford, UK; New York: Oxford University Press; 2010:250–271.
31. Bito Y, Hirata S, Yamamoto E. Optimum gradient factors for apparent diffusion coefficient measurements. In Proceedings of the Annual Joint Meeting of SMR/ESMRMB, Nice, France, 1995. p. 913. 32. Henkelman RM. Measurement of signal intensities in the presence of
noise in MR images. Med Phys 1985;12:232–233.
33. Macovski A. Noise in MRI. Magn Reson Med 1996;36:494–497. 34. Aja-Fernandez S, Vegas-Sanchez-Ferrero G, Tristan-Vega A. Noise
estimation in parallel MRI: GRAPPA and SENSE. Magn Reson Imag-ing 2014;32:281–290.
35. Rangwala NA, Hackney DB, Dai WY, Alsop DC. Diffusion restriction in the human spinal cord characterized in vivo with high b-value STEAM diffusion imaging. Neuroimage 2013;82:416–425.