University of Warwick institutional repository: http://go.warwick.ac.uk/wrap
A Thesis Submitted for the Degree of PhD at the University of Warwick
http://go.warwick.ac.uk/wrap/4480
This thesis is made available online and is protected by original copyright. Please scroll down to view the document itself.
Forces in a biological context
Jonathan William Armond
Thesis
Submitted to the University of Warwick for the degree of
Doctor of Philosophy
Supervisors: Dr Matthew Turner and Prof Julie Macpherson
Abstract
Theoretical modelling of the microtubule-Dam1-ring force generation mechanism and the pulling of tubes from surface-supported lipid bilayers are presented and discussed. Atomic force microscopy (AFM) force data of tube pulling experiments is analysed and compared with theoretical predictions.
Features common to recent computational models are simplified and examined independently where possible. In particular, the steric confinement of the Dam1 ring on a microtubule (MT) by protofilaments (PFs), the powerstroke produced by curling PFs, the depolymerisation of the MT, and the binding attraction between Dam1 and the MT are modelled. Model parameters are fitted to data. Functional force generation is equally demonstrated when attachment is maintained by steric confinement alone (protofilament model) or by a binding attraction alone (binding model). Moreover, parameters amenable to experimental modification are shown to induce differences between the protofilament model and the binding model. Changing the depolymerisation rate of MTs, the diffusion coefficient of the Dam1 ring, or applying an oscillating load force will allow discrimination of these two different mechanisms of force generation and kinetochore attachment.
Contents
1 Introduction 1
1.1 Interface of physics and biology: biological physics . . . 1
1.2 Chromosome segregation . . . 2
1.2.1 Mitosis . . . 2
1.2.2 Microtubules . . . 3
1.2.3 Forces in anaphase . . . 5
1.3 Lipid bilayer tubes . . . 5
1.3.1 Lipids . . . 6
1.3.2 Membranes . . . 6
1.3.3 Tubes . . . 7
1.4 Aims of this thesis . . . 7
2 Literature review 8 2.1 Mitotic force generation . . . 9
2.1.1 Directional instability . . . 9
2.1.2 Kinetochore attachment and force coupling . . . 10
2.1.3 Models of the force transduction mechanism . . . 13
2.1.4 Differences between species . . . 17
2.2 Lipid tube mechanics . . . 18
2.2.1 Theoretical modelling of vesicle-based tubes . . . 18
2.2.2 Mechanical experiment producing tubes . . . 20
3 Materials and methods 24 3.1 Atomic force microscope . . . 24
3.2 Force measurements . . . 26
3.2.1 Hooke’s law for cantilevers . . . 27
3.3 Atomic force microscopy of surface-supported lipid bilayers . . . . 29
3.3.1 Modification of AFM probe geometry . . . 29
3.4 Solid-supported lipid bilayer preparation . . . 30
3.4.1 Preparation of unilamellar vesicles . . . 30
3.4.2 Deposition of vesicles on surface . . . 31
4 Force transduction by the Dam1 ring 33
4.1 Generalised depolymerisation model . . . 34
4.1.1 Motion of Dam1 ring . . . 36
4.1.2 Force dependent depolymerisation velocity . . . 38
4.1.3 Drag . . . 40
4.2 Two models for Dam1 ring retention . . . 41
4.2.1 Binding model runtime . . . 43
4.2.2 Protofilament model runtime . . . 50
4.2.3 Hybrid models . . . 56
4.2.4 Time varying applied forces . . . 58
4.3 Results . . . 60
4.3.1 Direct comparison by variation of force . . . 63
4.3.2 Variation of intrinsic depolymerisation velocity . . . 63
4.3.3 Changing of diffusion coefficient . . . 64
4.3.4 Effect of time-varying loading force . . . 66
4.4 Summary . . . 67
5 Theoretical analysis of tube-pulling from solid-supported lipid bilayers 68 5.1 Equilibrium shape equation . . . 68
5.1.1 Equilibrium tube . . . 69
5.1.2 Derivation of shape equation . . . 70
5.2 Imposing the surface constraint . . . 76
5.3 Numerical solution of the shape equation . . . 77
5.4 Calculation of free energy . . . 78
5.5 Calculation of force-distance curve . . . 80
5.6 Zero pressure solutions . . . 81
5.7 Finite pressure solutions . . . 83
5.7.1 Plane Poiseuille flow . . . 84
5.7.2 Fluid flow . . . 85
5.8 Dissipation . . . 86
6 Analysing atomic force microscopy force curve data 91 6.1 Preprocessing . . . 91
6.2 Force curve taxonomy . . . 94
6.3 Viewer software . . . 94
6.4 Automatic analysis . . . 97
6.4.1 Peak-finding . . . 97
7 Tube-pulling from solid-supported lipid bilayers with an atomic force
microscope 102
7.1 Characterisation of solid-supported lipid bilayer . . . 102
7.2 Preparation of AFM probe . . . 104
7.3 Results . . . 104
7.3.1 Adhesion . . . 106
7.3.2 Tube formation . . . 109
7.3.3 Tube rupture . . . 111
7.4 Comparison with theoretical predictions . . . 113
8 Discussion 114 8.1 Microtubule-Dam1 force generation . . . 114
8.2 Pulling lipid tubes . . . 116
A Useful mathematical results 137 A.1 Lambert-Wfunction . . . 137
A.2 Binomial coefficients . . . 138
A.3 Order statistics . . . 139
B Theoretical background 141 B.1 Brownian motion . . . 141
B.2 Brownian ratchets . . . 142
B.3 Fokker-Planck equation . . . 143
B.4 Kramers’ escape problem . . . 143
B.5 Stokes’ law . . . 144
C Numerical solution of boundary value problems 145 C.1 Shooting methods . . . 146
C.2 Finite difference methods . . . 146
C.3 Continuation . . . 147
C.3.1 Pseudo-arclength continuation . . . 147
C.4 Boundary conditions at unknown points . . . 148
C.5 Integral constraints . . . 148
List of Figures
1.1 Transition between metaphase and late anaphase . . . 2
1.2 Structure of the tublin dimer . . . 3
1.3 Diagram of microtubule dynamic instability . . . 4
1.4 Common lipid structures . . . 6
2.1 Time-lapsed images of aDropsophilaS2 cell undergoing anaphase . 8 2.2 Dam1 rings bound to a microtubule . . . 11
2.3 Lipid tubes connecting cells . . . 18
2.4 AFM force curves potentially showing pulled lipid bilayer tubes, produced by Maeda et al. . . 22
2.5 AFM force curves showing the short-range interaction with unilamel-lar vesicle deposited bilayers obtained by Pera et al. . . 23
3.1 Diagram of atomic force microscope . . . 25
4.1 Two-rate depolymerisation process . . . 35
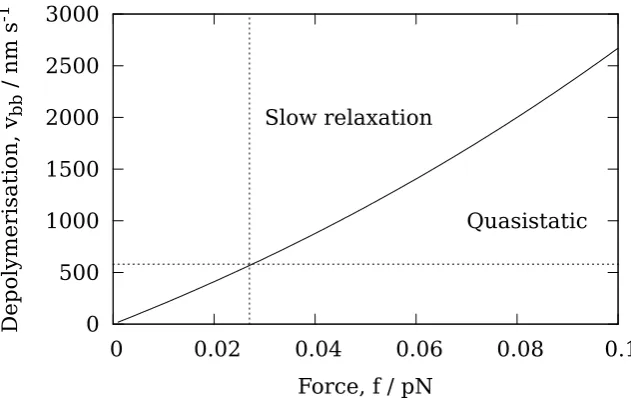
4.2 Quasistatic model validity range . . . 37
4.3 Schematic energy landscape underlying protofilament unzipping . 38 4.4 Ring velocity dependence on bare depolymerisation velocity . . . . 41
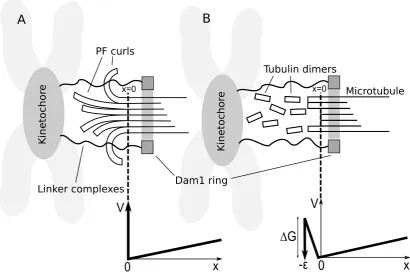
4.5 Two models for Dam1 ring-microtubule coupling . . . 42
4.6 Timeline of Dam1 detachment . . . 43
4.7 Sawtooth piecewise linear potential . . . 46
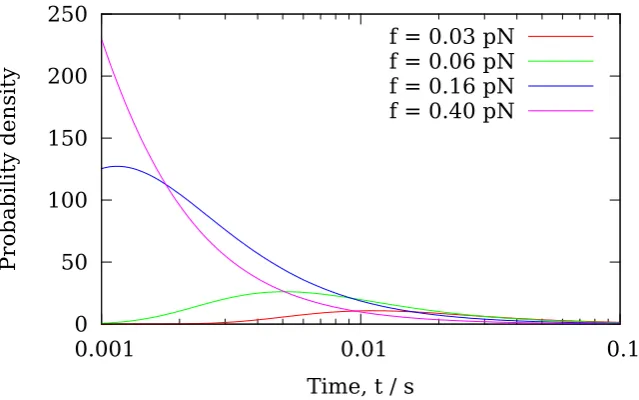
4.8 First passage time distribution for ring escape . . . 55
4.9 Variation of Dam1 velocity with load . . . 61
4.10 Runtime of binding and protofilament models . . . 62
4.11 Dam1 ring-microtubule binding strength . . . 63
4.12 Runtime as a function of bare depolymerisation velocity . . . 64
4.13 Runtime as a function of diffusion coefficient of Dam1 ring . . . 65
4.14 Runtime as a function of oscillating load force frequency . . . 66
5.1 Coordinate system of membrane segment . . . 69
5.2 Minimum of free energy during probe retraction . . . 79
5.3 Surface radius of membrane detachment of minimum free energy . 79 5.4 Maximum surface radius of membrane detachment during probe retraction . . . 80
5.6 Membrane shape solutions during pulling experiment withP=0 . 82
5.7 Membrane shape solution reflected aboutr=0 . . . 83
5.8 Caption on next page. . . 87
5.9 Membrane shape solutions during pulling experiment withP,0 . 88 5.10 Volume of membrane segment during probe retraction withP,0 . 89 5.11 Pressure in membrane segment during probe retraction . . . 89
6.1 Estimation of surface contact point from force curve . . . 93
6.2 Approach forces curves in various circumstances . . . 95
6.2 Figure continued from previous page. . . 96
6.3 Screenshot showing the interface ofCurvesView . . . 96
6.4 Extension of a polymer, or unfolding of a protein, bound to surface 97 6.5 Peak finding using the continuous wavelet transform (CWT) method 98 6.6 Derivative of Gaussian (DOG) wavelet . . . 99
6.7 Step-finding by continuous wavelet transform (CWT) method . . . 100
7.1 AFM image of DOPC bilayer . . . 103
7.2 AFM image of a mixed DPPC-POPC bilayer . . . 103
7.3 Line profile of mixed DPPC-POPC bilayer . . . 104
7.4 Result of grinding the probe tip against a rough diamond surface . 105 7.5 Typical retract force curves . . . 106
7.6 Typical retract force curves zoomed . . . 107
7.7 Retract force curves showing a attractive force peak . . . 107
7.8 Peak adhesion force histograms . . . 108
7.9 Force curves showing lipid tube formation . . . 109
7.10 Tube formation peak histograms . . . 110
7.11 Force curves displaying a step in force . . . 111
7.12 Tube rupture force step histograms . . . 112
7.13 Overlay of theoretical prediction of force during retraction on data 113 A.1 The principal branch of the Lambert-Wfunction for realx. . . 138
B.1 The Kramers escape problem . . . 144
List of Tables
Acknowledgements
First of all I would like to thanks my supervisors, Dr. Matthew Turner and Prof. Julie Macpherson, for giving me the opportunity to work with them and for providing guidance throughout the project. I would also like to thank Dr. Neil Wilson for his training on the AFM in the early days.
I would like to thank Alison Rodger, Dorothea Mangels, and M ´onica de Lucena from MOAC, for their help throughout these past years.
My family has always supported my choice to avoid a ‘real’ job and pursue my love of science, and for this I am most thankful.
Finally, to my fianc´e Elina, for always supporting, loving and encouraging me, I am deeply grateful -σ’αγαπώ πολύ.
Declaration
The work contained herein is entirely original and my own work, except where acknowledged in the text. I confirm that this thesis has not been submitted for a degree at another university.
Part of this work has been published in the following journal article:
J. W. Armond and M. S. Turner. Force transduction by the microtubule-bound Dam1 ring. Biophysical Journal, 98:1598-1607, 2010.
1
Introduction
1.1
Interface of physics and biology: biological
phys-ics
Biological physics as a field can perhaps be said to have begun with E. Schr ¨odinger’s classic book“What is life?” [4]. Since then science at the interface of physics and biology has had a fruitful development, perhaps most notably in biomolecular structure determination using physical techniques, e.g., X-ray crystallography, nuclear magnetic resonance (NMR), electron microscopy (EM). Optical traps and atomic force microscopes (AFMs) allow forces at the single molecule level to be measured. Statistical mechanics, both equilibrium and nonequilibrium, proves extremely valuable in understanding microscopic biological processes. Many of the pioneers of molecular genetics have been physicists, e.g., Francis Crick and Max Delbr ¨uck. Biological physics may be described as the sub-discipline of phys-ics concerned with applying physical principles to understand biological systems, and furthermore, using biological systems (which are often complex, disordered and far-from-equilibrium) to infer new physics.
This thesis is an attempt to form an understanding of two simplified biolo-gical systems from a biolobiolo-gical physics perspective. The following topics will be discussed:
• a mathematical model of the Dam1 ring-based microtubule (MT) force
trans-duction system that operates during mitosis (Chapter 4).
• theoretical and experimental investigations into the formation of lipid
Chromosome
Metaphase plate
Kinetochore
Centrosomes
Microtubules
(a) At metaphase chromosomes are con-densed and visible, and line up in an ima-ginary plane called the metaphase plate.
Kinesin-family motors Centrosomes
Microtubules
(b)After anaphase has completed the chro-mosomes are segregated to opposite poles of the cell.
Figure 1.1: Diagram of the transition between metaphase and late anaphase.
1.2
Chromosome segregation
Essential to the continuation of life is the ability of cells to replicate. The stage during the lifetime of a cell when replication visibly takes place is called mitosis during which a cell divides into two. Deoxyribonucleic acid (DNA) forms the cell’s genome which provides an encoded description of the proteins required by the cell and performs regulatory functions. It is organised into dense structures called chromosomes which condense and become visible during mitosis. A critical feature of mitosis is ensuring that the correct number of copies of the cells DNA is transported to each daughter cell before division.
1.2.1
Mitosis
Figure 1.2: Structure of the tubulin dimer. The αβ-tubulin dimer is shown with guanosine 5’-triphosphate (GTP) (green) bound to the α-tubulin (red), and guanosine 5’-diphosphate (GDP) (yellow) bound to theβ-tubulin (blue).
ring of myosin and actin filaments and two diploid daughter cells are produced1.
1.2.2
Microtubules
Microtubules (MTs) are 25 nm diameter fibres, composed of n(typically n = 13) parallel protofilaments (PFs) forming a hollow cylinder. Each PF is built from stacked 8 nm long tubulin protein dimers. Tubulin exists primarily as a dimer (shown in Figure 1.2) composed of α-tubulin and β-tubulin, each of which is present in all eukaryotes and is approximately 55 kDa in mass. Each monomer binds one guanosine 5’-triphosphate (GTP) molecule, but only the GTP bound to β-tubulin is hydrolysable to guanosine 5’-diphosphate (GDP). In the MT lattice adjacent protofilaments are staggered; the monomers are arranged as a 3-start helix2. As a consequence, after a complete turn the last α-tubulin is adjacent to the firstβ-tubulin of the next turn, creating a seam in the MT lattice [6].
MTs are rigid structures with a flexural rigidity of 7.9±0.7×10⁻²⁴
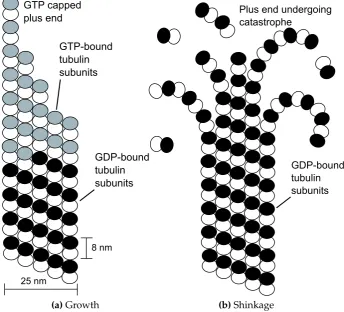
N m2 [7]. Their length is highly variable and is subject to a phenomenon known asdynamic instability[8]. Within a population of MTs with steady average length, individual MTs will undergo periods of growth, followed by rapid shrinking, orcatastrophes, as shown in Figure 1.3. During a catastrophe, the MT may berescuedand polymer-isation restarted. This dynamic instability is caused by the difference in structure between tubulin dimers containing GTP-β-tubulin and those containing GDP-β
-1During the similar process of meiosis, only one set of chromosomes is passed to daughter
cells, resulting in haploid cells.
GTP capped plus end
GTP-bound tubulin subunits
8 nm
25 nm
GDP-bound tubulin subunits
(a)Growth
Plus end undergoing catastrophe
GDP-bound tubulin subunits
[image:17.595.96.441.235.547.2](b)Shinkage
tubulin; the former is straight and the latter bent. MTs grow by addition of dimers containing only GTP. The GTPase activity of tubulin stochastically hydrolyses the GTP bound to β-tubulin to GDP. However, as long as a cap of GTP-β-tubulin remains at the growing end, the MT lattice constrains the GDP-bound tubulin in a straight configuration, storing elastic energy. Randomly, the cap may be-come hydrolysed, unleashing the stored energy and causing the MT to undergo catastrophe.
With a sufficiently high concentration of tubulin MTs may be grown in vitro. MTs extend by tubulin polymerisation onto PFs, forming long sheet-like exten-sions from the MT end, which close up to form the lattice. Depolymerisation occurs by a different process in which PFs laterally separate, adopting a curved ‘ram’s horn’ configuration, before individually depolymerising.
MTs emanate from centrosomes, a type of MTOC, where they are nucleated by theγ-tubulin ring complex [9, 10]. During mitosis, MTs form the mitotic spindle by attaching to the kinetochores located at centromeric-regions of chromosomes and bridging with MTs originating from the opposite centrosome.
1.2.3
Forces in anaphase
To achieve segregation and complete anaphase, a force must be applied to the chromosomes to overcome drag in the cytosol and move polewards [11]. This force could conceivably be produced by non-kinetochore MTs forming the spindle bracing against each other and extending. Alternatively, the force could be gen-erated by motor proteins at the kinetochore, using kMTs as tracks. Yet another possibility is the depolymerisation of kMTs pulls the kinetochores towards the poles. In particular, it has been suggested that a protein ring complex called Dam1 is directly involved in force generation. Much effort has been applied to the solution of this problem; major results are discussed in detail in§2.1.
1.3
Lipid bilayer tubes
(a)
(b)
(c)
(d)
Figure 1.4: Micelles, vesicles and membranes - three common lipid structures in aqueous environments. The schematic representation here shows a cross-section; each of these structures is three-dimensional. (a) A single lipid molecule; (b) lipids aggregate to contain their hydrophobic tails away from water, forming a micelle; (c) two layers of lipids, or leaflets, come together forming an extended bilayer membrane; (d) a vesicle is essentially a closed bilayer membrane.
1.3.1
Lipids
A wide group of molecules are known as lipids including fatty acids, glycerides and sterols. The major class of lipids that form biological membranes are phos-pholipids, which are roughly cylindrical and composed of three parts: a hydro-phobic tail and a hydrophilic head, connected by a glycerol with a phosphate group. Containing both hydrophobic and hydrophilic parts means phosphol-ipids are amphipathic. The hydrophobic tail is a pair of hydrocarbon chains, saturated or unsaturated, with a carboxyl group joining them to the glycerol. The length and type of tail affects the melting temperature of the lipid. Com-mon hydrophilic heads include phosphatidylcholine, phosphatidylethanolamine, phosphatidylserine and phosphatidylinositol. The different head types can have different sizes and different charges.
1.3.2
Membranes
In an aqueous environment, the amphipathic nature of phospholipids causes them to form structures that expose the hydrophilic heads to the water and contain the hydrophobic tails. Three common structures, shown in Figure 1.4, are micelles, vesicles and membranes; both vesicles and membranes are bilayers.
as the nucleus and endoplasmic reticulum. Furthermore, the natural environment of many proteins is within the membrane bilayer itself. Many of these proteins perform signal transduction across the membrane or form pores to allow the transmission of small molecules and other proteins.
1.3.3
Tubes
Membranes are flexible and, at biological temperatures, usually fluid, i.e. the constituent lipid molecules are free to move within the membrane. This important difference with other elastic materials results in an absence of shear stress, as lipids can move in response to a force. This allows large elastic deformations such as the formation of long, thin tubes. The formation of tubes will be discussed in detail in§2.2 and Chapter 5.
1.4
Aims of this thesis
2
Literature review
The mitotic spindle and the process of chromosome segregation have been the subject of extensive study in the last half-century. The literature most relevant to the question of force production during segregation is summarised in the first section of this chapter1. Recent advances in the sensitivity of force measurements, enabled by technologies such as optical trapping and atomic force microscopy, has led to direct measurements of the forces involved in membrane fusion, fission and tube formation. Previous lipid membrane modelling efforts and some recent experiments involving the formation of lipid membrane tubes are described in the second section of this chapter.
2.1
Mitotic force generation
In §1.2.3 it was noted that the movement of chromosomes during segregation in
anaphase A (see Figure 2.1) requires an applied force to overcome viscous drag, at observed velocities in the range 0.2 to 0.5 µm/min [1]. This force has been estimated to be between 0.1 and 10 pN per chromosome [12–15]. Measurements made by observing, using phase-contrast microscopy, the deflection of a thin glass needle snagged by a chromosome, have shown the stalling force, that is, the force required to halt chromosome motion, is on the order of 700 pN for the whole spindle (forMelanoplus sanguinipes, or grasshopper, spermatocytes) [13].
In the 1960’s, electron microscopy made it possible to visualise MTs within the mitotic spindle region [16]; previously unidentified fibres had been observed using polarised light microscopes [17]. Around 20–25 microtubules attach to each kinetochore in mammalian cells [18]. It was first proposed that the depolymer-isation of MTs during anaphase could be performing the mechanical work, thus generating a force, by Inou´e and Sato in 1967 [19]. The mechanisms for the con-tinued attachment and force generation of a kinetochore to a depolymerising MT are still not fully understood. Furthermore, it is not known whether two distinct mechanisms are independently responsible for attachment and for force genera-tion, or if a single mechanism or several coupled mechanisms cooperate to ensure segregation. A number of mechanisms have been proposed over several decades and will be explored later in this section.
2.1.1
Directional instability
It is observed that during anaphase A (see Figure 2.1) chromosomes do not fol-low a direct route toward the poles. Instead, chromosome movement, in several different cell types, abruptly switches between poleward and anti-poleward dir-ections. Each phase lasts around 1.5 min on average. This property is termed directional instability [20], and also occurs in late prometaphase and metaphase, although may have a different cause in these phases. Poleward motion is driven by a force generating mechanism at the kinetochore; the motion is opposed by polar ejection forces which push chromosome arms away from the pole, although laser microdissection experiments show this is not necessary for instability [21]. The polar ejection force is thought to arise from the action of non-kinetochore-MT-based kinesins on chromosome arms, known as chromokinesins [22], or from
1The microtubule (MT)-Dam1 force generation model in Chapter 4 is based on the assumption
the polymerisation of MTs against chromosome arms [23].
2.1.2
Kinetochore attachment and force coupling
The discoveries of several protein complexes involved in initiating and maintain-ing kinetochore attachment are beginnmaintain-ing to shed light on the anaphase chro-mosome segregation mechanism. Together with new in vitro data, and electron microscopy observations, these results are providing a rich source of speculation on the force coupling and transduction mechanism.
2.1.2.1 Protofilament curl
Cryo-electron microscopy and video-enhanced differential-interference contrast (DIC) microscopy has revealed depolymerising MTs to have frayed plus ends, where individual protofilaments (PFs) separate laterally and adopt a highly curved conformation prior to dissociation of individual tubulins or short oli-gomers [24–26]. These structures have been referred to as ‘nano-hooks’ and ‘rams-horns’. The transformation from straight ends to curled ends is thought to be the mechanism behind the rapid catastrophes that are part of the dynamic instability of MTs. The tubulin dimer bound to guanosine 5’-triphosphate (GTP), or tubulin-GTP, has a straight conformation across the dimer bond [27], while tubulin bound to guanosine 5’-diphosphate (GDP) or tubulin-GDP has a 11◦
bent conformation [28]. During MT growth, tubulin-GTP is added to the plus-end of the MT lattice. A growing MT maintains a monolayer cap of tubulin-GTP near the growing tip [29]. The GTPase action of tubulin beneath the cap hydrolyses GTP so the majority of the lattice is constructed from tubulin-GDP. Due to the curved conformation of tubulin-GDP, the PFs in the MT are under strain, hence store elastic energy. This energy is thought to drive the ‘catastrophic’ depolymerisation of MTs [30, 31].
By fixing a silica bead to the side of a MT and then inducing depolymerisation, Grishchuk et al. were able to measure the force exerted on the bead by the conformational change of PFs using an optical trap system [32]. Assuming, due to curvature considerations, the bead is attached to only 1–2 PFs, and compensating for a ten-fold lever arm effect, they estimate a maximum force production of 5 pN for 1–2 PFs. Extrapolating to the full MT cylinder yields a force in the range 30–65 pN.
re-Figure 2.2: Electron micrograph of Dam1 rings bound to a microtubule. Figure taken from [36].
leased by the curling process is directly involved in driving chromosome transport [35].
2.1.2.2 Dam1 complex
The discovery that the yeast Dam1 complex could form a ring around MTs in vitro [36, 37] caused considerable speculation that the mechanism of coupling between depolymerising MTs and the kinetochore had been found. Figure 2.2 shows Dam1 rings populating an MT. Dam1, also known as DASH, is a 210 kDa complex of 10 proteins: Dam1, Duo1, Dad1, Dad2, Spc19, Spc34, Ask1, Dad3, Dad4 and Hsk3 [37]. Dam1 rings have an outer diameter of about 54 nm and an inner diameter of about 32 nm [36]; the diameter of a microtubule is 25 nm meaning the Dam1 ring is apparently not a tight fit. Three-dimensional reconstruction by electron microscopy single-particle analysis indicates the complex has a C-terminal domain that protrudes toward the MT [38]. End-on electron microscopy images show the ring having a 16-fold symmetry [39].
Dam1 complex is essential for the proper segregation of chromosomes in bud-ding yeast (Saccharomyces cerevisiae) [40, 41]. Furthermore, the artificial recruit-ment of Dam1 complex to deoxyribonucleic acid (DNA) lacking a centromere produces a vastly simplified artificial kinetochore that is capable of bi-orientation and segregation [42]. In fission yeast (Schizosaccharomyces pombe) Dam1 is non-essential, but important for avoiding mis-segregation problems [43]. No analog-ous protein complex has yet been found in higher eukaryotes [44], although the Ska complex may prove to perform a similar function in human cells [45].
Fluorescence microscopy of Dam1 rings on taxol-stabilised MTs in vitro reveals that Dam1 rings can diffuse freely along the MT. Moreover, the Dam1 ring remains attached during depolymerisation of the MT to which it is bound [39], but reduces the depolymerisation rate around four-fold. Rings with the C-terminal protrusion truncated only slow depolymerisation marginally [46], indicating specific binding between the protuberance and specific sites on the MT lattice.
applying such a load force the Dam1 ring can remain attached as the MT elong-ates, tracking the MT tip. The MT depolymerisation rate is reduced at higher load forces. Furthermore, the frequency of ring detachment events is also increased [49].
2.1.2.3 KNM network and Ndc80
The highly-conserved KNM network – comprising KNL-1, Mis12 complex and Ndc80 complex – has emerged as essential for kinetochore interactions with MTs in vivo. Depletion of KNL prevents kinetochore-attached microtubule (kMT) associations. Depletion of Mis12-like complexes inhibits kinetochore assembly, and depletion of Ndc80 hinders the ability of the kinetochore-MT system to hold tension [50].
The Ndc80 complex is of particular interest to chromosome segregation. It is a complex of four proteins: Ndc80 (known as Hec1 in human cells), Nuf2, Spc25 and Spc24, in equal stoichiometric ratios [51], with a total weight of∼170–190 kDa
[52]. The complex has been shown to be essential for chromosome segregation [53–55]. Structurally, the complex is a 57 nm rod with globular domains at each end [56]. Electron microscopy of MTs and Ndc80 at saturating concentration revealed that Ndc80 binds, and coats, the MT at an approximately constant angle with respect to the MT polarisation creating a barbed MT [50].
By the same procedure used for Dam1 force measurements, purified Ndc80, bound onto a bead held in an optical trap, has been shown to remain attached to depolymerising microtubules (dMTs) under tensions in the range 0.5–2.0 pN. However, arrays of Ndc80 are required to maintain attachment; single complexes cannot sustain force. Individual Ndc80 complexes are also able to diffuse along the MT [57]. Despite this ability to transduce force, Ndc80 and Dam1 are not redund-ant in yeast; both are required for MT attachment [58]. In fact, Dam1 enhances the ability of Ndc80 to remain attached to dMTs as a cooperative processivity factor, increasing the distance travelled three-fold and decreasing detachment five-fold. Furthermore, the mean force sustainable increased about two-fold to 4.4±0.2 pN
[59]. The interaction of the Ndc80 complex with the kinetochore, the MT and the Dam1 complex [44] suggests it could function as a linking complex between the Dam1 complex and the kinetochore.
2.1.2.4 Fibrils
in-dicates that depolymerising kMTs associated with fibrils have reduced curvature near where they join the MT, but increased curvature close to their fibril attach-ment. It is argued that this is due to the fibril opposing the force generated by PF strain release. The identity of the fibrils remains unknown; candidates include CENP-E and Ndc80 [60]. It should be stressed that the fibrils in the electron mi-croscopy (EM) images are somewhat faint and it is not clear whether the fibrils bind directly to the MT or to another MT-bound structure.
2.1.2.5 Molecular motors
In addition to MT depolymerisation-based chromosome segregation theories, a significant body of evidence has been accumulated toward the involvement of mo-lecular motor proteins in the segregation process [61]. It has been suggested that, due to the necessity of highly accurate chromosome segregation, multiple force production mechanisms may have co-evolved; moreover, different mechanisms may exist or dominate in different species [11].
2.1.3
Models of the force transduction mechanism
Many models have been proposed to describe the mechanism of force transduc-tion due to kinetochore-MT coupling, with increasing incorporatransduc-tion of molecular biology information in more recent studies. The models are described here, cat-egorised by the key mechanism they propose.
2.1.3.1 Force-balance models
Joglekar and Hunt describe a force-balance model that reproduces chromosome directional instability [62]. They assume MTs are attached to chromosomes by a Hill sleeve (see§2.1.3.3) and pull chromosomes toward the poles, while
uniden-tified ‘polar ejection forces’ oppose this. Added to this force balance is a centre spring connecting sister chromatids and a spring connecting each Hill sleeve to the chromosome. With appropriate parameters, their model effectively reproduces the oscillations in chromosome position observed in vivo for newt lung cells.
The model is able to reproduce both metaphase chromosome oscillations and anaphase chromosome motility.
However, both of these force-balance models fail to provide mechanistic ex-planations for how the included forces are generated, and furthermore contain many parameters, several of which are not constrained by experiment.
2.1.3.2 Treadmilling
Significant support for the idea that a dMT could generate force was provided by the discovery that MTs stochastically switch from growth to rapid shrinking (also known as acatastrophe), by a process calleddynamic instability[8]. In steady state conditions in vitro, net tubulin addition occurs at one end of a MT (plus-end) and net loss occurs at the other (minus-end), as observed by electron microscopy [63]. The resulting unidirectional flux of tubulin subunits from the plus-end to the minus-end is called treadmilling and has been suggested as a mechanism for the translocation of chromosomes [64]. Kinetic modelling of the treadmilling process shows that an energy source, provided by GTP hydrolysis, is necessary to maintain the flux of tubulin [65]. Extending the kinetic model to explicitly include the energetics of GTP hydrolysis showed that the free energy released during hydrolysis did not contribute to producing mechanical work [66]. Shortly after, it was realised that, if the MT was constrained between two barriers, as would be the case for a kMT in the spindle, but still able to exchange subunits at the ends, the treadmilling could convert chemical free energy due to GTP hydrolysis into mechanical work [67, 68] (see also [69]). For an unobstructed MT, the change in length is given by
dl
dt =ckon−koff, (2.1)
wherecis the concentration of tubulin subunits and the rateskonandkoffsubsume the individual polymerisation and depolymerisation rates at each end.
In the steady state, i.e. with constant length (dl/dt=0),
koff/kon =cc (2.2)
whereccis the critical concentration of free subunits for steady state. If the MT is
obstructed by a force f, the polymerisation rate is reduced so that (2.1) becomes
dl
dt =ckone
−f d/kBT−
koff, (2.3)
concentra-tion increases to
co(f)=ccef d/kBT (2.4)
whereco(f) is the steady-state concentration for a force f opposing MT elongation,
due to the obstruction, anddis subunit length. Rearranging,
f = kBT d ln
c
o
cc
= kBT
d ln co kon koff !
. (2.5)
During MT shortening in anaphase, the ratio kon/koff ≈ 0.001µM−1, yielding a maximum pulling force of 32 pN [11].
On purely thermodynamic grounds, the free energy of GTP hydrolysis∆GGTP constrains the maximum pulling force. The difference in ∆GGTP for GTP in free solution and bound in the MT lattice is 4 kcal/mol, or 26 pN nm/subunit, corres-ponding to a maximal force of around 43 pN (using 8/13 nm as the step distance, see§1.2.2) [70, 71].
During mitosis, the treadmilling of tubulin subunits is often called thepoleward fluxof tubulin. The rate of poleward flux and the degree to which it has an impact on segregation is subject to considerable variation among species. InXenopusegg extracts poleward flux and chromosome motility have been observed to occur at the same rate (∼2µm/min) [72], although these are meiotic cells. In mitotic
newt lung cells, by inhibiting disassembly at the kinetochore ends using taxol, the unaffected poleward flux due to depolymerisation at the centrosome ends was able to segregate chromosomes at a similar rate to control cells [73]. Mitosis also still proceeds efficiently in human cells when poleward flux is inhibited, although chromosome velocity is reduced 20% [74].
2.1.3.3 Hill sleeve
In 1985, Hill proposed the first quantitative model for maintaining the attachment of a MT to a kinetochore during MT depolymerisation, including the effect of the viscous drag of the chromosome [75]. The Hill model envisions a close-fitting sleeve, around 40 nm long, wrapped around the end of a MT. A sleeve of this length could accommodate up to M = 65 tubulin subunits, and at some point in time 1 ≤ n ≤ M spaces are free. The MT end can be considered to be
following a random walk in n. Calling the free energy of interaction with the sleeve per subunit w, the probability of taking steps increasing n (withdrawing the MT) is modified by the Boltzmann factor e−w/kBT
2.1.3.4 Pac-man model
Liu and Onuchic postulated a model where an electrostatic attraction exists between the ring and the MT [76]. The attraction is strongest at the point where PFs curl due to the widened diameter. This served to maintain the rings position at the tip of the MT. They combined this with MT depolymerisation and found the ring could remain attached and support forces of up to 1.5 pN before stalling. At the time of publication, no direct experimental data was available for comparison with this model. Furthermore, the electrostatic interaction between tubulin and Dam1 remains unquantified, and in vivo a Debye screening length of around 1nm would exist, meaning only a very closely fitting interaction would effectively bind the Dam1 and tubulin together.
2.1.3.5 Molecular-mechanical model
A coarse-grained molecular-mechanical model, representing tubulin monomers as spheres, based on an axial interaction that acts to curl PFs and a lateral in-teraction between PFs opposing curling, demonstrated that the energy released as lateral bonds broke and PFs curled was sufficient to drive the catastrophic depolymerisation of dynamic MTs. The model did not consider the possibility of driving cargo by harnessing this energy [77]. Following the measurement of the PF pushing force (see§2.1.2.1), the authors modified the model to investigate
force production by MT depolymerisation and found that a powerstroke due to the conformational change of tubulin would be highly effective, resulting in a force of∼75 pN per tubulin subunit layer [78].
2.1.3.6 Molecular motors
Many MT-related motor proteins are involved in chromosome segregation [61, 80], with functional redundancy between different motors [81], although adenosine 5’-triphosphate (ATP)-depletion experiments have shown that they are not essential for isolated chromosome motility in vitro [14, 33].
Models of the overall chromosome segregation system usually include contri-butions from forces that are posited to be due to the action of molecular motors (see §2.1.3.1). In particular, Civelekoglu-Scholey et al. incorporate coupling
between the kinetochore and MTs [15]. However, no model has focused solely on generation of forces at the kinetochore by molecular motors.
2.1.4
Di
ff
erences between species
It is a remarkable fact that all life is built out of cells (as observed by R. Hooke in 1665 [82]). Consequently, cell division is an essential process for the continued existence of all species, and a critical part of that process is segregation of replicated chromosomes. However, striking mechanistic differences exist between various species, some of which will be briefly highlighted here.
In plant and lower invertebrate cells, poleward flux and minus end disas-sembly apparently plays a more significant role than in higher vertebrates [11]. In Drosophila the minus-end directed motor dynein is required for chromosome motility. However, dynein requires ATP hydrolysis to provide power and chro-mosome motion occurs in the protozoan Tetrahymena even without ATP [14]. Isolated chromosomes in vitro also do not require ATP or GTP for minus-end directed motion [33].
The Dam1 complex, implicated in kinetochore coupling to dMTs (see 2.1.2.2), has only been found in fungi [44], although some evidence suggests the Ska complex may play a similar role in humans [45]. However, the KMN network of protein complexes, which also plays a critical role in kinetochore-MT coupling, is highly conserved across eukaryotic species (from fungi to humans) [52].
Figure 2.3: Three-dimensional fluorescence and scanning electron microscopy images of lipid tubes connecting cells in vivo. Figure taken from Rustom et al. [88].
2.2
Lipid tube mechanics
Observation of kidney cells using three-dimensional (3D) fluorescence microscopy reveals the presence of tubes, with diameter 50–200 nm and lengths up to several micrometres, connecting nearby cells. Over a 4 min period a tube was observed to grow to cover the 15µm distance separating two cells, shown in Figure 2.3A-D. This observation puts the rate of extension of a tube to the order of 60 nm/s, with the caveat that this is based on one measurement and may be particular to this cell type. Strikingly, Rustom et al. also observed, by video microscopy, tubular or vesicular objects moving unidirectionally through the tubes at a mean speed of 25.9±7.9 nm/s. Based on their fluorescent-labelling experiments, they
propose that the tubes are formed by actin polymerisation, and material transport is mediated by an actin-based mechanism [88]. The tubes are known to be capable of transferring cargo including organelles, plasma membrane components and small cytoplasmic molecules, although it is possible that other cargo may also be transported by lipid tubes [89].
Lipid tubes have also been observed to connect, and facilitate communication, between immune cells [90, 91]. In particular, the HIV-1 virus can spread through tube interconnections between T-cells [92]. Prions can also travel between infected and non-infected cells through lipid tubes [93].
2.2.1
Theoretical modelling of vesicle-based tubes
surface tension, pressure and curvature. The curvature energy term is based on the idea that the lipid bilayer has an intrinsic, spontaneous curvature C0, where deviations of the mean curvature fromC0 increase the free energy quadratically. Minimisation of this free energy determines the shape of a membrane structure, such as a vesicle. This is accomplished variationally because F is a functional, resulting in a shape equation which is the equilibrium condition. However, an extremum ofFdoes not necessarily imply a stable shape, and only stable shapes will manifest in experiment. Zhong-can and Helfrich derived a general shape equation and used it to calculate the second variation ofFto analyse the stability of extremal energy shapes [96]. If the second variation is positive definite then the shape is stable.
A simpler method for deriving a shape equation is to assume axisymmetry for the vesicles and writeFas an integral of a Lagrangian in terms of the arclengths of the contour. A differential shape equation is then derived variationally through the Euler-Lagrange equations [97, 98]. This results in an identical shape equation for axisymmetric vesicles as the method of Zhong-can and Helfrich [99–101].
Several theoretical efforts have examined the shape and stability of tubes formed from vesicles, based on the Canham-Helfrich energy functional. Bukman et al. derived stability conditions for cylindrical vesicles as a model of a tube. They concluded that parameters obtained by experiment fall ‘comfortably’ within the range predicting stable cylindrical vesicles [102]. Boˇziˇc et al. variationally minimised a Canham-Helfrich energy functional with an additional term for relative expansion of the membrane area, and obtained shapes of constant volume vesicles been strained axially at both ends. For a bending modulus ofκ≈10−19
2.2.2
Mechanical experiment producing tubes
Membrane tubes have been formed from giant vesicles using optical tweezers [109, 110], by the action of isolated kinesin motors [111, 112]. Tubes may also have been formed from surface-supported lipid bilayers [3] or surface-supported lipid bilayer stacks [2].
2.2.2.1 Pulled from vesicles by external force
Pulling lipid tubes presents a novel experimental technique for investigating membrane properties. The force f applied to a tube is inversely proportional to the radius of the tube r0 [113], with the membrane rigidity κ as the constant of proportionality (see also§5.1.1). Observingr0 as a function of f therefore allows
the measurement ofκ[114].
Perhaps the first experimental production of lipid tubes was by the action of fluid shear stress [115, 116]. More recently, the force response of the tube has been measured over the course of pulling a tube. Raucher and Sheetz attached IgG-coated polystyrene beads to cell membranes, before pulling the bead away from the cell at constant velocity with optical tweezers. Initially the force was low but then rose to a constant value. The tube elongated at this constant force for several micrometres before exponentially increasing. At this point the bead escaped the trap [117]. The constant force elongation was attributed to the depletion of the a membrane reservoir, which serves to buffer the cell membrane surface tension. After the reservoir is depleted the force rises rapidly.
Koster et al. [109] pulled membrane tubes from giant vesicles by attaching a strepavidin-coated polystyrene bead to an immobilised biotinylated giant vesicle and moving the bead away from the vesicle, using optical tweezers, at 500 nm/s. They observed a sharp increase in force, up to a value fover, associated with forming a tube, before a sudden drop back to a much smaller nonzero force f0. Continuing to pull, this force remained constant until dropping back to zero as the tube ruptured. Monte Carlo simulations of the tube-pulling experiment were roughly consistent with the experimental data, although a detailed description of the simulation was not given. Using fluorescence microscopy, they also observed that the tube attached to the bead with a finite radius patch, ranging in size from near zero to 1500nm. In contrast with previous theoretical studies, which assumed a point-force, they found that the formation force foverwas linearly dependent on patch radius.
adhered to a surface, and found that the force of tube extension continues to increase over many tens of micrometres, in stark contrast to the constant force observed with micropipette aspirated vesicles. They suggested the increase in force during elongation of the adhered vesicle tube could be explained by either by the free area consumption by the elongating tube causing a membrane tension increase, or by the induction of vesicle unbinding from the surface, as considered theoretically by Smith et al. [107].
A phenomenological theoretical approach was taken by Nowak and Chou to investigate the probability of tube extrusion for various parameter regimes. Their model incorporates the possibility that the bond between membrane and pulling device can break. According to their model tube formation is probable for a wide range of rates in both linear force ramp and constant pulling speed experiments [118].
2.2.2.2 Formed by action of molecular motors
In addition to externally applied force, lipid tubes may also be pushed out from vesicles by molecular motors, perhaps also providing an insight into in vivo formation. Fygenson et al. encapsulated purified tubulin protein within vesicles. Although not strictly a motor, tubulin generates a pushing force during polymer-isation [119]. Upon polymerpolymer-isation of the encapsulated tubulin into microtubules, the vesicle become prolate and eventually produced tubular protrusions from each pole. The force sustained at the microtubule growing ends was calculated to increase to around 3 pN [120].
Figure 2.4: AFM force curves potentially showing pulled lipid bilayer tubes, produced by Maeda et al. with a bare silicon nitride probe. Figure taken from [2]. The surface was coated with multiple layers of lipid bilayers formed by solvent evaporation. This may explain why short-range forces are not resolved.
2.2.2.3 Pulled from surface-supported lipid bilayers
Lipid tubes can also be pulled from lipid membranes formed on a solid surface. Maeda et al. formed multilamellar stacks of pure 1,2-dipalmitoyl-sn -glycero-3-phosphocholine (DPPC), pure 1,2-dimyristoyl-sn-glycero-3-phosphocholine (DMPC) and a mixture and used atomic force microscope (AFM) to pull tubes from the stack. During retraction, they observed several consecutive constant force regimes with approximately integral multiples of the final regime, shown in Figure 2.4. For DPPC layers, a single event had a force of 45.4±3.5 pN, while for double and
triple events the force was 81.6±3.5 pN and 113±35 pN. This was attributed
to concentric tubes being formed [2]. A set of concentric tubes is effectively a multilamellar tube which may be forming due to the surface membrane being multilamellar.
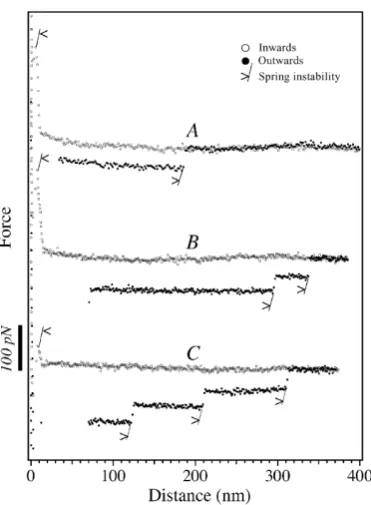
Figure 2.5: AFM force curves showing the short-range interaction with unilamel-lar vesicle deposited bilayers obtained by Pera et al. with a bare silicon nitride probe. The radius of curvature of the probe in the DOPC case was 45–50 nm. Fig-ure taken from [3]. Pera et al. report that they occasionally observed a long-range interaction indicated by a step down in force, but did not show this data.
or, alternatively, the two bilayers fuse and then is penetrated, although this is certainly not clear. Bilayers are known to form on silicon nitride [123] and the lack of bilayer formation on the silicon nitride probe was attributed to the high curvature. With mercapto undecanol-gold coated probes two jumps occurred during approach, indicating that bilayers were formed on both the surface and the probe [3]. The retraction in these experiments were not reproducible and showed features including an adhesion force holding the probe to the surface, and a “weak long-range attraction” of less than 1 nN, which may indicate tube formation.
Membranes tubes have also been formed by using AFM probes on individual Chinese hamster ovary cells, malignant human brain tumour cells and human endothelial cells, and the elongation forces were found to be 28±10 pN, 29±9 pN
3
Materials and methods
In this chapter the experimental procedures used to obtain the results of Chapter 7 are detailed. A brief introduction to the operating principles of atomic force microscope (AFM) is also included.
3.1
Atomic force microscope
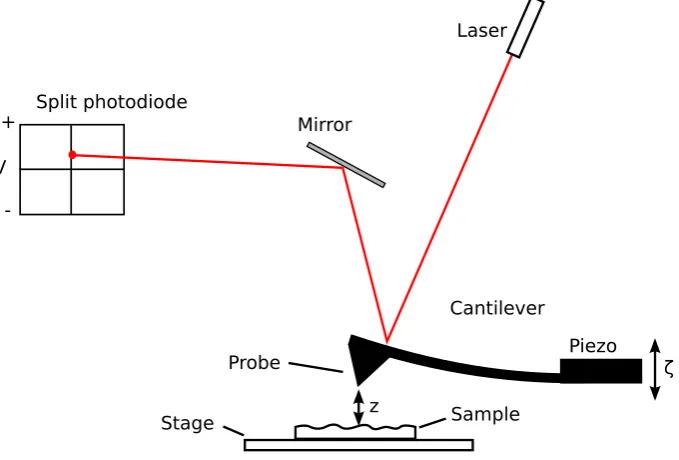
An AFM is a sensitive instrument for measuring the deflections of a flexible cantilever responding to interactions with a sample [125]. The most common use for an AFM is for imaging the three-dimensional (3D) surface of a sample on a nanometre scale. In such a topography measurement, an Si (silicon) or SiN3 (silicon nitride) cantilever with a sharp probe (radius of curvature ∼ 5–40 nm),
Laser
Mirror
Cantilever
Probe
Sample Stage
Split photodiode
ζ
z +
-V
[image:38.595.159.499.232.462.2]Piezo
A popular alternative feedback mode is known astapping mode. In this mode, the cantilever is oscillated at its resonance frequency, usually by a piezoelectric crystal mounted on the holder near the cantilever chip. As the probe is raster scanned over the surface, the feedback loop is used to maintain a constant oscilla-tion amplitude. Whenever the probe to surface distance is reduced the oscillaoscilla-tions are damped, again allowing the topography of the surface to be mapped. The key advantage of tapping mode over contact mode is that lateral forces are vastly re-duced which allows imaging of soft samples, such as biological samples, without excessive damage.
Using very sharp probes can allow atomic resolution images to be captured [126]. However, the real advantage of the AFM comes from the flexibility allowed in environmental conditions, as it can operate in solutions [127], in vacuum [128], or at raised or cooled temperatures. Moreover, specialised cantilevers and probes allow the use of a wide range of properties as the feedback parameter including, but not limited to, magnetic force [129], electric force [130], electrochemical current [131], conductivity [132, 133] and temperature [134], enabling high spatial resol-ution images of these properties. Furthermore, the probe can be functionalised with ligands to ‘image’ the distribution of receptors on the sample [135].
3.2
Force measurements
In addition to raster scanning for imaging, the motion of the cantilever can be restricted to the z-axis, and the probe repeatedly brought into contact with the surface and then retracted again. The deflection, which is proportional to the force exerted by the cantilever by Hooke’s law (see §3.2.1), is monitored throughout
the cycle tracing out aforce curve. Using a sample fixed to a surface it is possible to measure the z-axis component of a sample’s elastic modulus from the force curves.
To measure forces in biological systems using an AFM it is necessary to estab-lish the sample as the weakest link between the cantilever and a surface. A hard flat surface (e.g, mica or glass) is chosen as the support for the system to avoid coupling the stiffnesses of the surface and the system of interest. Furthermore, the stiffness of the cantilever must be chosen to be comparable to that of the system of interest, in order that useful measurements can be made.
bond. Molecules may be fixed simply by van der Waals or electrostatic forces, or by, e.g., gold-thiol chemistry, streptavidin-biotin linking or PEG (polyethylene glycol) spacers. Analysis is complicated because the bond breaking ‘reaction’ is a non-equilibrium process due to the finite velocity of the probe. To fully probe the response of a bond to force in a single-molecule system it is necessary to vary the force loading rate, in a procedure calleddynamic force spectroscopy[136]. This data can reveal the energy landscapes involved in dissociation and association [137, 138].
A similar experimental setup has been used to measure the energy landscapes of protein unfolding. Either by simple adsorption1, or using flexible linking molecules, the protein is anchored between the surface and the probe. Retraction force curves generally show an elastic response, followed by a rapid drop in force as a domain of the protein loses integrity. From this point, the force-extension relationship is similar to that observed for polymeric molecules. Large multi-domain proteins, such as titin, display repeated occurrences of this pattern at surface-probe separations precise enough to identify the number of amino acids per domain [140]. Using the Jarzynski non-equilibrium fluctuation-dissipation relation [141], it is possible to relate the irreversible work done during the protein-unfolding pull to the equilibrium thermodynamic free-energy of protein-unfolding [142, 143].
3.2.1
Hooke’s law for cantilevers
The deflection y of the end of a cantilever is proportional to the force f applied at the same end, for small deflections. This can be shown by considering the equation of equilibrium for a beam for small deflections [144]
EId 4y
dx4 =0, (3.1)
whereEis the Young’s modulus of the beam material andIis the area moment of inertia (the productEIis called the flexural rigidity). The coordinatexgoes along the length of the beam betweenx= 0 andx =L. A cantilever is a beam held fast at one end (x = 0) and free at the other (x = L). Clearly at x = 0, the deflection yis fixed at zero and the slopedy/dxmust also be zero. The bending moment is given by [144]
M=−EId
2y
dx2, (3.2)
1Due to the very small contact area of the AFM probe, the pressure exerted by probe during
and because the free end is not clamped the bending moment at x = L must be zero. The shear force (the force applied to the beam in the y-direction) is [144]
f(x)=−EId
3y
dx3. (3.3)
We are interested in the case where a shear force+f (that is, directed upwards) is applied at the free end of the cantileverx=L. Therefore, the following boundary conditions apply y x=0 =
0 (3.4a) dy dx
x=0 =0 (3.4b)
d2y dx2 x=L =
0 (3.4c)
d3y dx3 x=L =
− f
EI. (3.4d)
After, integrating (3.1) four times we have
y(x)=c1x3+c2x2+c3x+c4, (3.5)
where the ci are constants of integration. The boundary conditions (3.4) imply
c3 = c4 = 0, c1 = −f/6EI and c2 = f L/2EI. Putting these into (3.5) gives the equation of the deflection of the cantilever
y(x)= f 6EI(3Lx
2−x3). (3.6)
In a typical AFM, the deflection is detected by a laser focused at the free end of the cantilever and we are interested in measuring the force f, hence the following equation is more useful
f = 3EI
L3 z=kz, (3.7)
wherekis thespring constant.
For a cantilever with rectangular cross-section of widthwand thicknesst, the area momentIis
I=2w Z t/2
0
t02dt0 = wt 3
12 , (3.8)
so the spring constant can be inferred from the cantilever geometry
k= Ewt 3
In practise, however it difficult to accurately measure the dimensions of AFM cantilevers and this derivation only applies to rectangular cantilevers, while soft, biologically-suitable cantilevers are often triangular, so spring constants are de-termined by other methods. The method used in this thesis, the thermal noise method, is described in§6.1.
3.3
Atomic force microscopy of surface-supported lipid
bilayers
The experimental results reported in Chapter 7 were obtained on one of the following AFMs: Veeco Enviroscope with Nanoscope IV, Veeco Multimode V with Nanoscope V, or Veeco Catalyst with Nanoscope V (Veeco, Santa Barbara, CA, USA). Cantilever spring constantskwere measured using the thermal noise method [145] and the deflection sensitivity δ determined against a clean mica surface. The use of these parameters is discussed in§6.1.
3.3.1
Modification of AFM probe geometry
Standard AFM probes are generally designed to be as sharp as possible, i.e. having the smallest radius of curvature of the probe as possible. This allows high-resolution imaging where resolution is limited by the size of the probe. In force measurements a sharp probe is not always useful or desirable. In the case of pulling lipid tubes larger radii of probe curvature results in emphasised jumps in force magnitudes during tube formation (see Chapter 5). Therefore, a simple procedure was used (based on the procedure described in [146]) to fabricate blunt probes from standard sharp probes so that changes in the pulling force during the tube formation would be more measurable.
Standard V-shaped-cantilever silicon nitride probes (model NP, Veeco Probes, Santa Barbara, CA, USA), with nominal radius of curvature 20 nm, were ground down to fabricate blunt probes by the following procedure. A clean, unpolished diamond surface was used as a substrate. The probe was brought into contact with the diamond, and then the pushed into the surface a further 10µm, which corresponds to a force of over 1µN. The surface was scanned in contact mode over an area 40µm by 40µm at a line scan rate of 60 Hz for 15 min.
the image shows the 3D shape of the probe. These images are shown in Figure 7.4, and clearly demonstrate the efficacy of the procedure in generating blunt probes from standard sharp probes.
3.4
Solid-supported lipid bilayer preparation
All lipids used in this work were supplied by Avanti Polar Lipids Inc., Alabaster AL, USA. Lipids were supplied in powder form or dissolved in chloroform. If in powder, lipid was dissolved to 10 mg/ml in chloroform, aliquoted and stored at
−20◦ C.
A solid-supported lipid bilayer is a two-dimensional sheet of membrane that is formed, and supported by, a planar solid surface, and have numerous prac-tical applications including immobilisation of proteins, acting as phantom cells, electrooptical biosensors [147]. Three methods are generally used to prepare a smooth bilayer on a surface. The Langmuir-Blodgett technique involves the use of a trough with a movable barrier to compress a dispersion of lipid molecules on the surface of a liquid. The surface requiring coating is then dipped in and out of the liquid, acquiring a bilayer in the process. The casting method simply requires the evaporation of a lipid-isopropanol solution directly on the surface, followed by hydration [148]. Finally, the lipid vesicles – closed, hollow spheres of bilayer, see Figure 1.4 – deposition method involves depositing a solution of vesicles onto the surface. Under favourable conditions, a fusion and rupture process causes the vesicles to spread across the surface forming a smooth bilayer [149]. The following results use vesicle deposition exclusively because the method is straightforward and reliable. The vesicle deposition protocol is followed from [150].
3.4.1
Preparation of unilamellar vesicles
The suspension was forced through 11 times resulting in a distribution of vesicle sizes close to the membrane pore size.
The buffer used for resuspension of lipids, referred to hereafter as HEPES buffer, was 150 mM NaCl, 3 mM NaN3, 10 mM HEPES, 2 mM CaCl2, and adjusted to pH 7.4. The CaCl2catalyses the rupture and fusion process [151].
3.4.2
Deposition of vesicles on surface
Immediately after preparation, approximately 30 µl of the unilamellar vesicle solution was deposited onto a freshly cleaved, clean mica surface. The sample is covered to ensure the droplet does not evaporate for 30 min; after this time a bilayer covering large areas of the surface has formed. Any excess vesicles were washed away by cycles of exchanging HEPES buffer solution. The sample is then ready for imaging and force measurements.
3.4.3
Force curve protocol
Prior to force measurements, the proper formation of the bilayer was checked by contact mode imaging. Only if a uniform and smooth bilayer of at least 3µm by 3µm was found, were force measurements taken. Poor formation of bilayer could be attributed to an unclean surface, solvents on the surface prior to deposition or old vesicle preparations.
The parameters defining the force curve cycles were as follows: the z-axis ramping velocity was set to 250 nm/s or 500 nm/s; the ramp size (the distance between fully retracted and fully extended) was typically 500 nm, or 1–2µm when checking for very long tubes; the force trigger (during the extension phase, the ramp is halted when the force exceeds this threshold) was set to 20 nN – when using sharp probes, forces between 6–7 nN tended to penetrate the bilayer and contact the mica underneath; this was not observed at all up to 20 nN with blunt probes; once the force threshold was reached, the probe was held in contact with the surface for one second – this delay tended to increase the repeatability of the features observed in the force curve. During each cycle, at least 16384 data points were recorded, with 16-bit voltage resolution. For each given experiment and set of parameters, the cycle was repeated on the order of about 400 times.
Data was also obtained at ramp velocities of 5–100 nm/s and≥1µm/s.
How-ever, thermal drift2 at the slow velocities made it difficult to discern genuine features, while at the higher velocities hydrodynamic drag on the cantilever was present, as well as exacerbated dissipation effects in the tube formation.
2Each component of the AFM, e.g., the laser, the mirrors, and the sample, tends to move slowly
4
Force transduction by the Dam1
ring
In §2.1 the models for mitotic microtubule (MT) force generation, in the context
of anaphase, currently described in the literature were discussed. Most recent models include a combination of the following physical features:
1. the intrinsic diffusion of the Dam1 ring,
2. an effective powerstroke due to curling protofilaments (PFs),
3. steric confinement of the Dam1 ring by splayed out PFs at the MT tip,
4. an attractive potential between the Dam1 complex and the MT.
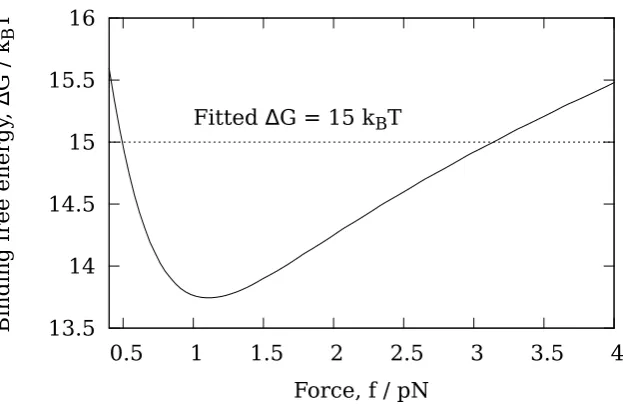
While experimental evidence for the diffusivity of a Dam1 ring on a MT is clear [39], it is difficult, based on current models, to discriminate the effects of a powerstroke or a potential. Dam1 rings have been shown to sustain tension on depolymerising MTs; velocity and runtime statistics are available [48, 49]. However, quantitative comparison of model predictions with this data is lacking for previous models. In this chapter two models are presented, both containing the common features #1 and #2, but each only incorporating either #3 or #4. The model provides predictions, using parameters obtained from experimental data, to determine which of #3 and #4, if any, is the dominant effect in vivo.
broken by the by unidirectional obstacles. The resultant rectified Brownian mo-tion gives rise to a force in the thermodynamic sense. These models are often known as ‘burnt bridge’ models [152, 153], where the burning of a bridge activ-ates an obstacle (included in the wider class of Brownian motors, see§B.2). For
comparison with these models, ‘bridge’ units may be associated with MT sub-units; they are ‘burnt’ by depolymerisation. It is therefore not necessarily true that #1 and #2 both must be present in a model of Dam1 force transduction, and the relative contribution of #2 is determined by fit to data.
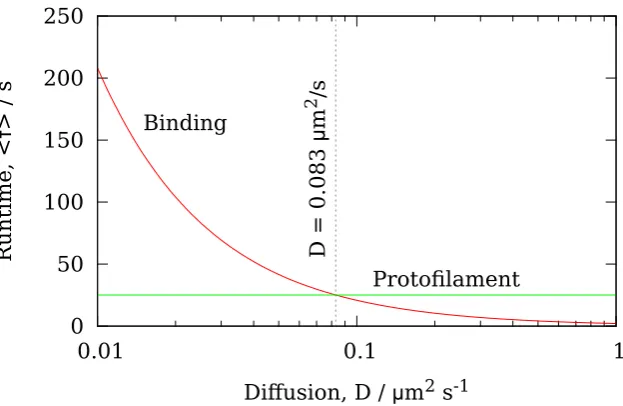
In the following two distinct minimal models shall be described, both of which describe a functional Dam1-mediated force transduction system. Starting with a generalised model of how the Dam1 ring, moving diffusively, interacts with the MT depolymerisation process, different mechanisms determining the release of the ring are incorporated. In theprotofilamentmodel the splaying PFs at the de-polymerising end physically prevent the ring from sliding off(Figure 4.5). In the bindingmodel an attraction between the ring and MT provides an energy barrier preventing detachment (Figure 4.5). The two models are not necessarily mutually exclusive – a hybrid model, incorporating both contributions, may also apply although one of the constituent mechanisms will typically dominate. While it is straightforward to modify the analysis to include such hybrid models, their dis-cussion has been postponed until§4.2.3 for clarity, since the goal is to differentiate
the contributions of these two features. In common with previous models, other molecular components, e.g., microtubule-associated proteins (MAPs) and kinases [154, 155], that certainly play important additional rolesin vivo, are also neglected. Nevertheless, some effects due to MAPs, e.g. increased depolymerisation rate, are automatically modelled by a parameter change.
4.1
Generalised depolymerisation model
k
breakk
unzipFigure 4.1: Two-rate microtubule (MT) depolymerisation process. Tubulin dimers depolymerise with ratekbreak, while simultaneously the microtubule unzips with ratekunzip.
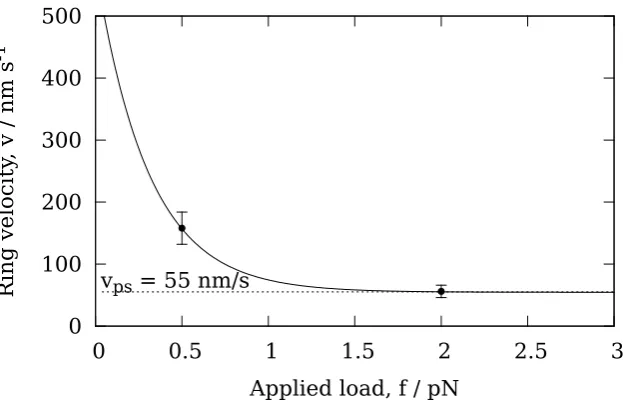
adjacent PFs causes the MT to unzip by one full turn per unzipping event. The sequence of microscopic PF unzipping events (either by powerstroke or other-wise) gives rise to a well defined average velocity v for the last fully intact MT section, irrespective of the sequence in which the neighboring PFs unzip, and the precise MT helicity. The powerstroke is assumed to occur even when the ring is very close to the MT end, and moves the ring the distance corresponding to one unzipping event. In this case, due to necessity of overcoming the opposing force due to the ring, the energy barrier present in the unzipping process is enlarged (see§4.1.2). Correspondingly, the powerstroke gives rise to a reduced
depolymer-isation velocity vps, whenever the ring has diffused to within a distance δ from the end. When the ring is further thanδfrom the end, it is assumed that there is no interaction between the ring and the tip PFs. In this case the depolymerisation velocity is denoted vbb, and corresponds to the depolymerisation velocity of a bare MT where there is no Dam1 ring anywhere on the MT. No prior assumptions are made as to which contribution dominates, rather this is determined by fitting the parameters vbb,vps andδto data for the variation of the Dam1 velocity with load [49].
on this energy landscape beyond the minimum required to explain the data. This amounts to a model involving two (distinct) depolymerisation mechanisms.
4.1.1
Motion of Dam1 ring
The Dam1 ring complex is reported to be capable of axial movement with respect to the MT [39]. Therefore, the Dam1 ring is treated as a particle undergoing one-dimensional Brownian motion in a potentialV(x) (shown for two different models in Figure 4.5). The fully intact MT extends away from the depolymerising end for x>0 and the point at which the MT lattice unravels isx=0 (see Figure 4.5A). The following Fokker-Plank equation determines evolution of the probability density φ(x,t) for the ring’s position relative to the (moving) end, as described in§B.3,
∂φ(x,t) ∂t =D
∂ ∂x
∂φ(x,t) ∂x +
1 kBT
∂V ∂xφ(x,t)
!
, (4.1)
whereDis the diffusion constant of the ring. This approach is appropriate provid-ing the depolymerisation velocityvof the MT is not too fast, otherwise we must instead treat this as a full moving boundary problem. Since the MT depolymer-isation is here quasistatically slow with respect to the diffusive relaxation of the ring, we can neglect viscous drag force on the ring, except as discussed in§4.1.3.
In the following we assume the Dam1 ring is sufficiently stable that it can only dissociate by slipping offthe tip, not by dismantling. For simplicity the analysis is restricted to continuous depolymerisation processes only and discounts the possibility of rescue and polymerization, although these may be important for the in vivo mechanism. Although it would be straightforward to include such processes by accounting for an extended runtime due to a stochastically-timed growth of the MT, they would distract from the central results of this chapter.
A force−∂V/∂xappears in (4.1). This is the applied force−f on the Dam1 ring
on the MT (x >0) since the ring must do work to move against this force. If f is constant, or slowly varying, a steady state solution to (4.1) is established. Setting for the steady state
∂φ(x,t)
∂t =0 (4.2)
we have from (4.1)
dφ(x) dx +
f kBT
φ(x)=constant. (4.3)
It is clear that asx→ ∞we must haveφ(x)→0, therefore the constant is zero.
![Figure 4.10: Runtime of the protofilament and binding models. The runtimeksimilar functional form.available to perform this fitting [49] making it difrom this approach](https://thumb-us.123doks.com/thumbv2/123dok_us/9706170.471780/75.595.99.429.241.446/figure-runtime-protolament-runtimeksimilar-functional-available-tting-approach.webp)