ISSN Print: 2151-481X
DOI: 10.4236/sgre.2019.101001 Jan. 15, 2019 1 Smart Grid and Renewable Energy
A Method for the Detection of Decrease in
Power in PV Systems Using Satellite Data
Kota Kawasaki, Keiichi Okajima
*Department of Risk Engineering, System and Information Engineering, University of Tsukuba, Ibaraki, Japan
Abstract
In this paper, a method to detect a decrease in the output power of photovol-taic systems is proposed. This method is based on using satellite irradiance data. In addition, fault detection is carried out with only one day’s data in this method. Thus, the time elapses since the decrease in output is shorter than with the other methods. In order to mitigate the error in satellite data and improve the accuracy of fault detection, data extraction is carried out, which consists of two steps. In the first step, effective data are extracted by setting a lower irradiance limit. In the second step, “Calculation day” is determined depending on the number of effective data in one day. Fault detection, which is only conducted on the Calculation day, is conducted by comparing the ex-pected power and the measured power. The parameters used in this study were optimized by testing 45 systems that appear normal. Subsequently, 340 systems were analyzed with the proposed method, using optimized parame-ters. The results showed the effectiveness of our method from the viewpoints of both accuracy and time required. In addition, three data extraction me-thods were considered to distinguish between the permanent decrease caused by failure, and the temporary decrease caused by partial shade. Fuzzy cluster analysis showed the best result among the three methods used.
Keywords
PV System, Fault Detection, Fault Classification, Satellite Data
1. Introduction
In recent years, several photovoltaic (PV) systems have been installed all over the world. It is believed that the PV system is safe. However, several faults have been reported [1]. So far, various monitoring techniques for PV system have been developed. They are generally classified into onsite monitoring and remote How to cite this paper: Kawasaki, K. and
Okajima, K. (2019) A Method for the De-tection of Decrease in Power in PV Systems Using Satellite Data. Smart Grid and Re-newable Energy, 10, 1-15.
https://doi.org/10.4236/sgre.2019.101001
Received: December 21, 2018 Accepted: January 12, 2019 Published: January 15, 2019
Copyright © 2019 by author(s) and Scientific Research Publishing Inc. This work is licensed under the Creative Commons Attribution International License (CC BY 4.0).
DOI: 10.4236/sgre.2019.101001 2 Smart Grid and Renewable Energy monitoring. In the case of a small grid-connected PV (GCPV) system such as the rooftop PV system, it is not efficient to carry out onsite monitoring of the sys-tems one by one. Therefore, remote monitoring is more suitable than onsite monitoring for the initial diagnosis of small GCPV systems.
Remote monitoring methods for small GCPV systems have been developed [2]. A friendly tool to detect and locate various types of faults correctly has been developed [2] and the use of OPC technology has been proposed [3]. In addi-tion, a method using distributed MPPT, which allows monitoring at the module level, has been developed [4]. Recently, methods using machine learning have also been developed [5]. For example, artificial neural network (ANN) is used for both fault classification [6] and modeling by regression [7]. ANN and fuzzy logic are compared in several cases [6], and the two parameters are modelled in order to identify the number of partially shaded cells [7]. Wireless sensor net-work has also been proposed based on support vector machine classifier from historical irradiance [8]. In this method, both outlier detection and solar power prediction are possible. Before detailed analyses such as the classification of faults, the use of a kind of data mining method, the principal component analy-sis (PCA), has been proposed [9]. This work can contribute to efficient data analysis and visualization.
Most of these techniques need the irradiance data measured by a pyranometer or a reference module. However, a rooftop PV system rarely has a pyranometer, and it is not realistic to install new ones in many situations. Therefore, the use of satellite-based irradiance is considered in this study. Although using satel-lite-based data allows the acquisition of solar irradiance over large areas, these data have uncertainty due to the limitation of time resolution and space resolu-tion. Therefore, it is necessary to verify the uncertainty of the satellite data and conduct appropriate preprocessing before using them. This study proposes a method to detect a decrease in the output power of PV systems, taking into con-sideration the satellite data error. High accuracy rate and early detection have not been achieved simultaneously in previous methods using satellite data to detect power decrease in PV systems (see 2.2). Therefore, we have focused on an accuracy method to detect a power decrease with shorter elapsed time. In addi-tion, a data extraction method such as cluster analysis is considered in order to classify the decrease as temporary or permanent.
This paper is organized as follows: Section 2 presents the uncertainty of satel-lite data, some previous methods to detect faults using satelsatel-lite-based data, and the results of analyzing the trend of satellite data used in this study. Section 3 describes our proposed method to detect faults. Section 4 describes the results. Finally, Section 5 provides the conclusion.
2. Satellite Data
2.1. Error in Satellite Data
DOI: 10.4236/sgre.2019.101001 3 Smart Grid and Renewable Energy [11] [12]. The difference between measured irradiance and that derived from Himawari-8, a Japanese stationary weather satellite, has been evaluated [10]. Al-though the accuracy of estimation based on Himawari-8 observation has im-proved compared to the estimation based on Himawari-7, problems such as the influence of albedo and radiation enhancement have remained. In addition, the results based on hourly and daily averages show a better correlation than the re-sults based on instantaneous data. Other studies [11] have found a general cor-relation between the overestimation of satellite-based correlates and the mean number of cloudy days. The uncertainty and bias of models that estimate PV performance without onsite measured irradiance of plane of array have also been investigated [12]. This study has shown that uncertainty and bias tend to in-crease by using alternative data instead of measured ones. Using satellite data has particularly contributed to significant uncertainty and bias. These studies have shown that satellite data have errors in measured irradiance, and it is ne-cessary to consider them in our method.
2.2. Previous Study Using Satellite Data
Some studies have developed methods to consider the error of satellite-based es-timation [13]. In order to detect failures in GCPV, the expected energy yield calculated based on the hourly satellite-derived irradiance and the actual one has been compared [13]. To conduct a more precise diagnosis, the GISTEL model and fuzzy logic approach have been combined [14]. In addition, a technique to set an accumulation period and to extract the maximum point of output power and satellite-derived irradiance, respectively, has been reported [15]. This me-thod shows a high accuracy rate because the satellite data error was mitigated by using accumulated data. However, it was difficult to detect faults early because of an accumulation period of 30 days or so. Therefore, a method to detect a de-crease in power with only one day’s data is proposed in our paper (see Section 3).
2.3. Trend of Satellite Data Used in This Study
Satellite data from Himawari-8 for every 5 min was used in this research. To consider the fault detecting method, errors in the satellite-based data were ana-lyzed initially. The analysis was conducted by comparing satellite-based and measured irradiance. Figure 1 shows the distribution of the percentage error, which is calculated by Equation (1), against the value of the measured irradiance.
(
)
Error= IS−IM IM . (1)
DOI: 10.4236/sgre.2019.101001 4 Smart Grid and Renewable Energy Figure 1. Comparison between measured irradiance percentage error of satel-lite-based irradiance.
is inappropriate to use satellite-based irradiance without data processing because using all data, including those with significant errors, can lead to false positive or false negative.
3. Methodology
3.1. Categorization of the Day
The previous method to set an accumulation period has not been able to detect a decrease in power early [15]. To achieve both high accuracy rate and early detec-tion, a method to determine the day for which acceptable data is available to detect a decrease in output power is proposed in this paper. This method was developed considering the following features of satellite-based data. These fea-tures were described by Alessandro [10], and determined by the simple analysis conducted in Section 2.
• The error of satellite-based irradiance depends on climatic conditions. Better
accuracy is obtained on sunny days.
• Although individual instantaneous data contain overestimation and
underes-timation, the error reduces by using long-period data.
Therefore, it is necessary to determine whether the data for a given day should be adopted or rejected. This involves two steps. First, a lower irradiance thre-shold ITHRis set in order to determine whether the data should be regarded as effective. For example, a threshold of 200 W/m2 indicates that data over 200 W/m2 is effective, while other data are excluded. This step is carried out every 5
-100 -80 -60 -40 -20 0 20 40 60 80 100
0 200 400 600 800 1000 1200
Er
ro
r [
%
]
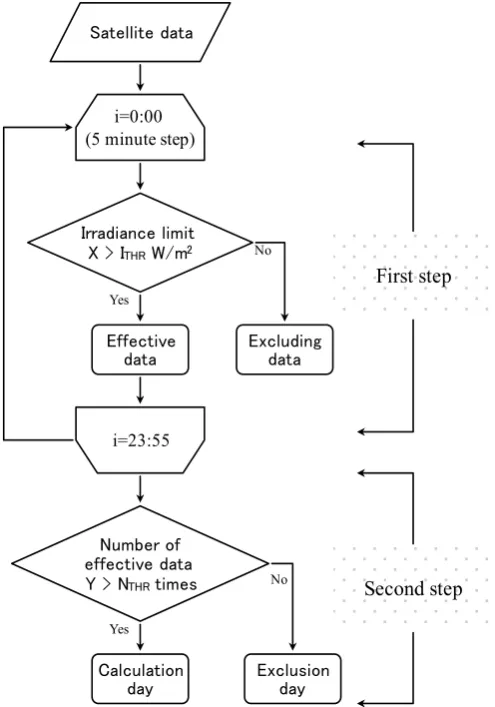
DOI: 10.4236/sgre.2019.101001 5 Smart Grid and Renewable Energy min. Second, a lower threshold of NTHRfor the number of data is set in order to determine whether the day should be regarded as a “Calculation day”. For ex-ample, a threshold of 30 times indicates that the day containing over 30 effective data is regarded as a Calculation day, while other days are excluded. This step is carried out every day after the first step is conducted for an entire day. Even-tually, the days are categorized into Calculation day and exclusion days. These steps are shown in Figure 2.
[image:5.595.249.497.340.694.2]In Figure 2, X is the irradiance value from the satellite, Y is the number of ef-fective data, ITHR and NTHR are the thresholds of irradiance value and the number of effective data, respectively. These values will be optimized in 5.1.
Figure 2 shows that the days are categorized as Calculation day and exclusion days depending on the weather condition, and only one day’s data is used to detect the power decrease if the day is categorized as a Calculation day.
3.2. Power Decrease Detection
The evaluation index for fault detection is defined by the ratio of measured power to expected power, as shown in Equation (2). The expected power is
Figure 2. Data flow to determine “Calculation day” and “Exclusion day”.
Satellite data
Irradiance limit
X > ITHR W/m2
Effective data
Exclusion day Calculation
day i=0:00 (5 minute step)
i=23:55
Number of effective data
Y > NTHR times
Excluding data
First step
Second step Yes
No
Yes
DOI: 10.4236/sgre.2019.101001 6 Smart Grid and Renewable Energy calculated by using satellite data and system configuration, including the rated power and the measured power obtained from each home.
Evaluation Index=P PM E. (2) where PMis the measured power, and PE is the expected power. PEis calculated using satellite data and system configuration, based on the Japanese Standards Association (JIS) as shown in Equation (3).
tilt s
E R
P = ×K P ×G G . (3) where K is the correction factor including temperature factor and system power conditioner factor, PR is the rated power, and GS is the standard irradiance. Gtilt is the tilted irradiance, and it is calculated through the Perez transposition model [16]. The evaluation index shown in Equation (2) is calculated based on the least squares method, i.e., the gradient with respect to the expected power and the measured power is calculated from the dataset of the Calculation day. Equation (2) indicates that if a system has no fault, the evaluation index is 1.0. If there is a 20% decrease in the system, the evaluation index is 0.8. Fault detection is carried out by comparing the evaluation index and the threshold. Although the thre-shold can be set arbitrarily, 0.9 is used to detect a 10% decrease in this study.
3.3. Classification of the Fault
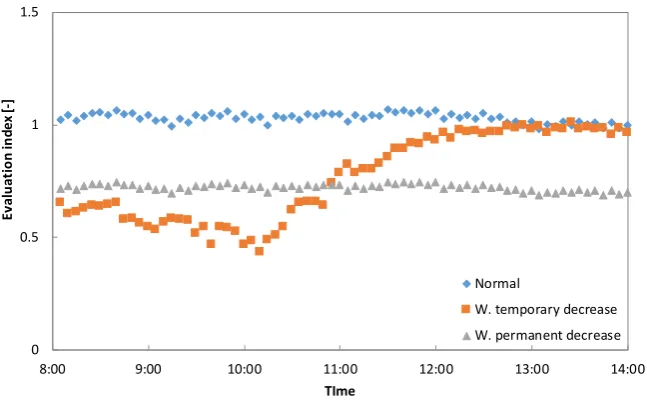
Power decrease is broadly classified into permanent decrease caused by failure and temporary decrease caused by partial shade. The three cases of the evalua-tion index every 5 min, i.e. normal, temporary decrease, and permanent de-crease, are shown in Figure 3.
[image:6.595.211.535.506.707.2]In order to distinguish these decreases automatically, extracting the upper da-ta of the evaluation index and recalculating the evaluation index were consi-dered. This process was conducted after detecting a decrease in power. Three methods of extracting the upper data were compared in this study. The simplest
Figure 3. Evaluation index in the three cases.
0 0.5 1 1.5
8:00 9:00 10:00 11:00 12:00 13:00 14:00
Ev
alu
at
io
n in
de
x [
-]
TIme
Normal
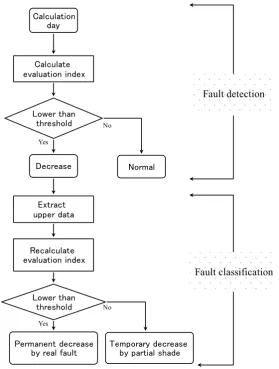
DOI: 10.4236/sgre.2019.101001 7 Smart Grid and Renewable Energy method was to use the maximum point as the upper data. Extraction of the data group, instead of the data point, was possible with cluster analysis. Two types of cluster analysis methods were considered. The first method is K-means algo-rithm, which is one of the most widely used clustering methods. The second method is the fuzzy c-means (FCM) algorithm [17]. FCM differs from K-means in that FCM uses the membership degree. These methods, i.e., maximum point extraction, data group extraction by K-means, and extraction by FCM, are com-pared in 4.3. The flow chart of power decrease detection and classification of faults is shown in Figure 4.
If the day is categorized as a Calculation day (see Figure 2), fault detection is conducted. If the system appears to decrease in power due to the comparison between evaluation index and threshold, fault classification is conducted by ex-tracting the upper data and recalculating the evaluation index.
3.4. Target System and Data
[image:7.595.234.514.338.708.2]Two types of data, i.e. satellite data and output power data, were used in this study. The data period is one year, from 2016 to 2017. Satellite data, including
Figure 4. Data flow of fault detection and classification.
Fault detection
Fault classification Decrease Normal
Calculate evaluation index
Lower than threshold
Yes Calculation
day
No
Lower than threshold
Permanent decrease
by real fault Temporary decrease by partial shade
Extract upper data
Recalculate evaluation index
Yes
DOI: 10.4236/sgre.2019.101001 8 Smart Grid and Renewable Energy irradiance and temperature, were provided by Himawari-8. The spatial resolu-tion was 1 km. The data were obtained every 5 Output power data was obtained from each household. They were obtained for every minute, and the mean value was used in order to ensure uniformity with the time resolution of satellite data. Overall, approximately 340 systems data were available. However, some of them included power decrease. Therefore, 45 systems that appeared normal were used for parameter optimization. One of 45 systems was used as a representative to evaluate the effectiveness of the proposed method and the parameters. One sys-tem, which has no fault, but is affected by the partial shade, was used to consider the three methods to extract the upper data, stated in 3.3.
4. Results and Discussion
4.1. Parameter Consideration
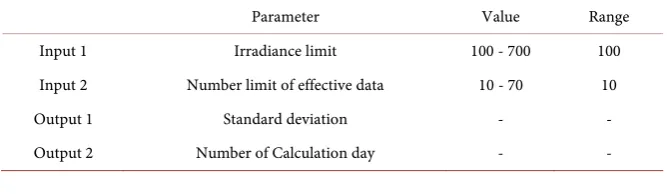
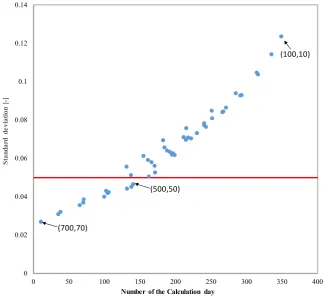
As described in 3.1, two parameters, irradiance value and number of effective data, were set in order to categorize the day as Calculation day or exclusive day. These parameters were optimized by testing various values. The output parame-ters used for evaluation were “standard deviation (SD) of evaluation index in one year” and “number of Calculation day in one year”. The input and output parameters are shown in Table 1. Overall, 49 patterns were tested, and the eval-uation index is calculated for one year in each pattern.
A smaller SD results in a more stable evaluation index, thus contributing to higher accuracy. On the contrary, more Calculation day result in an earlier de-tection. As stated in 3.3, 45 normal systems were used to consider the optimum parameters. Therefore, the evaluation index for one year in 49 patterns, multip-lied by 45 systems, was calculated.
Figure 5 shows the average results of 45 systems in 49 patterns. Thus, one plot shows the average of 45 systems, and the number of plots is 49.
This shows that as the input parameters are set strictly, the standard deviation and number of Calculation day decrease. For example, both SD and the number of Calculation day are the lowest when the input parameters are set to 700 W/m2 and 70 times. In order to simultaneously achieve stable results and early detec-tion, the optimum input parameters were determined. In this study, a standard deviation of 0.05 was inserted statistically to guarantee the correct answer rate while detecting a 10% decrease (red line).
[image:8.595.206.540.639.736.2]Accordingly, the input parameters were set as 500 W/m2 and 50 times.
Table 1. Input and output parameters for optimization.
Parameter Value Range
Input 1 Irradiance limit 100 - 700 100
Input 2 Number limit of effective data 10 - 70 10
Output 1 Standard deviation - -
DOI: 10.4236/sgre.2019.101001 9 Smart Grid and Renewable Energy Figure 5. Average output in each input parameter and line to guarantee the correct an-swer rate.
4.2. Effectiveness of the Proposed Method
Effectiveness of proposed method was evaluated for the following cases.
Case (a): No categorization, i.e. the days were not categorized as Calculation day and exclusion day.
Case (b): Existing method, i.e. the maximum values at each time were ex-tracted from the 30-day period [15].
Case (c): The proposed method, i.e. the daily output power and satel-lite-derived irradiance were used if the day was determined to be a Calculation day.
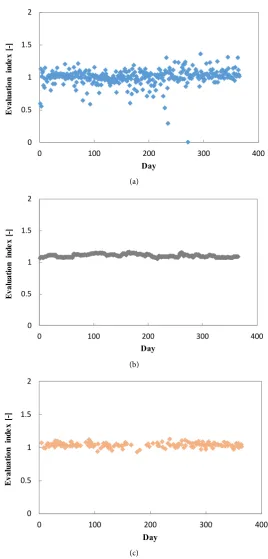
One example of the results among the 45 systems in each case is shown in Figure 6. The mean value and standard deviation of each method are also shown in Table 2.
Compared with Case (a), the method proposed in this paper, Case (c), shows better results from the viewpoint of stability, and consequently, in terms of ac-curacy. Compared with Case (b), the proposed method, Case (c), shows better results from the viewpoint of early detection. This is because Case (c) has 156 plots, i.e., fault detection can be conducted once in 2 or 3 days on an average, while Case (b) requires 30 days to calculate one point. Particularly in Case (b), the mean value exceeded 1, which might have been caused by the overestimation of satellite-based irradiance. This overestimation may be related to extracting the
0 0.02 0.04 0.06 0.08 0.1 0.12 0.14
0 50 100 150 200 250 300 350 400
St
anda
rd
de
vi
at
io
n [
-]
Number of the Calculation day
(100,10)
(500,50)
DOI: 10.4236/sgre.2019.101001 10 Smart Grid and Renewable Energy (a)
(b)
[image:10.595.238.507.65.626.2](c)
Figure 6. Annual result of evaluation index in the three cases.
Table 2. Mean value and standard deviation of the annual evaluation index.
Case (a) Case (b) Case (c)
Mean 1.00 1.10 1.04
SD 0.125 0.024 0.034
0 0.5 1 1.5 2
0 100 200 300 400
Eval
uat
ion
i
nd
ex
[-]
Day
0 0.5 1 1.5 2
0 100 200 300 400
Eval
uat
ion
i
nd
ex
[-]
Day
0 0.5 1 1.5 2
0 100 200 300 400
Eval
uat
ion
i
nd
ex
[-]
[image:10.595.204.538.677.725.2]DOI: 10.4236/sgre.2019.101001 11 Smart Grid and Renewable Energy maximum point each time. With regard to SD, it was high in Case (a), and suffi-ciently low to detect a decrease accurately in Case (b) and Case (c).
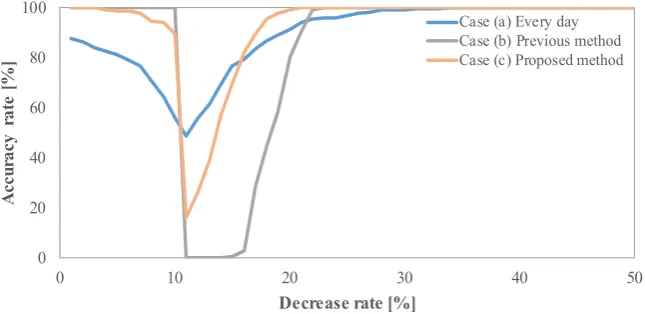
Accuracy rate for the decrease in simulation was calculated depending on the decrease rate in each method. Decreased power was calculated by multiplying the measured power by the simulated decrease rate. The accuracy rate was cal-culated by dividing the number of correct days by the total number of days. These are given by Equations (4) and (5).
D M
P =P ×DR. (4)
CD TD
AR N= N . (5) where PD is the power decrease by simulation, PM is the power measured from the households, and DR is the simulated decrease rate, such as 20%. AR is the accuracy rate, NCD is the number of days the diagnosis was conducted correctly, and NTD is the total number of days the diagnosis was conducted. Both false pos-itive and false negative are included while calculating the AR. As shown in Fig-ure 7, the AR is calculated by setting the DR as 0% to 50% for every 1%, and the threshold as 0.9 in each method.
A difference of 100% in the accuracy rate to the left side of the 10% decrease rate indicates a false positive, while this difference to the right side of the 10% decrease rate indicates a false negative in Figure 7. There is a high probability of false positive and negative in Case (a) because the variance in the evaluation in-dex was high, as shown in Figure 5. Moreover, there is a high probability of false negative in Case (b), because the mean value of the evaluation index was slightly over 1.0. All the three cases share a low point near the 10% decrease rate due to the threshold is set to 0.9. However, this problem can be improved by consider-ing the variance of evaluation index to determine whether the system shows a decrease in output power in the confidence interval.
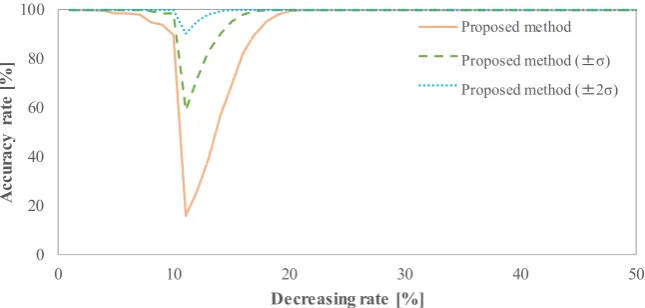
Figure 8 shows the result of the proposed method considering the confidence intervals, such as ±σ and ±2σ.
[image:11.595.211.534.549.706.2]Considering the confidence interval, the accuracy rate was improved in the vi-cinity of 10%. The confidence interval should be determined depending on
Figure 7. Accuracy rate in each method.
0 20 40 60 80 100
0 10 20 30 40 50
A
cc
ur
ac
y
rat
e [
%]
Decrease rate [%]
DOI: 10.4236/sgre.2019.101001 12 Smart Grid and Renewable Energy Figure 8. Accuracy rate in considering the variance of evaluation index.
whether to avoid the false positive or the false negative.
4.3. Effectiveness of Fault Classification
In order to classify the cause of decrease in power into failure and partial shade, data extraction was considered. It is likely that data group extraction using clus-ter analysis shows a more stable result than data point extraction because the calculation of evaluation index includes multiple points. On the contrary, calcu-lation using a single datum is likely to provide unstable results because individu-al instantaneous data include overestimation and underestimation as stated in Section 2. In the data group extraction, it is likely that the fuzzy c-means (FCM) method provides a more stable result than K-means because it is more adjustable to the membership function. For example, Figure 9 shows a comparison of the result of FCM and the result without extraction.
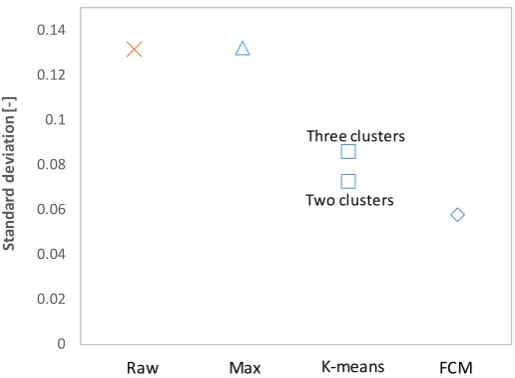
Although the system did not include faults, the evaluation index decreased during a certain period in the raw case. This was caused by partial shade. On the contrary, a stable result was obtained by using the FCM method even when the system was affected by partial shade. This suggests that fault classification can be carried out with data group extraction by FCM. Three methods, i.e. maximum point extraction, data group extraction by K-means, and group extraction by FCM, were compared with respect to standard deviation, as shown in Figure 10. As a setting of the number of clusters, two and three clusters were examined in K-means. Various settings were examined in FCM because the two parameters of fuzzifier and condition of the membership degree were changed. In FCM, ap-proximately 100 cases were calculated in total.
This result shows that SD did not improve by maximum point extraction. Da-ta group extraction by cluster analysis shows significantly better results than those of data maximum point extraction. FCM shows better results than K-means if the two parameters of fuzzifier and condition of the membership de-gree are set appropriately. However, these results are limited to the SD in only one system, and it is necessary to calculate classification accuracy and to consid-er application to othconsid-er systems.
0 20 40 60 80 100
0 10 20 30 40 50
A
cc
ur
ac
y
rat
e [
%]
Decreasing rate [%]
DOI: 10.4236/sgre.2019.101001 13 Smart Grid and Renewable Energy Figure 9. Comparison of evaluation index obtained without extracting upper data and extracting by FCM.
Figure 10. Standard deviation of each method.
5. Conclusion
This paper presents a method of detecting a decrease in the output of PV sys-tems with satellite-derived irradiance. Depending on the climatic conditions, the day was categorized as a Calculation day or an exclusion day. Parameters to ca-tegorize the day were optimized by testing various values. By determining the appropriate day to calculate using the optimized parameters, a stable result was obtained compared with calculating every day. While SD was 0.125 for evaluat-ing every day, it was 0.034 in the proposed method. Compared to the method in the previous study, our method requires a shorter time to detect a decrease in the output power of the PV system because only one day’s data are required. In the proposed method, the accuracy rate is nearly 100%, even when detecting sig-nificant decrease rates, such as 20% and 30%. In addition, the probability of false positive and false negative is reduced by considering the confidence intervals, such as ±2σ. In addition, three extraction methods to classify the faults were
0 0.5 1 1.5 2
0 50 100 150 200 250 300 350 400
Ev
al
ua
tio
n in
de
x [
-]
Day
Raw case (without extraction) FCM
0 0.02 0.04 0.06 0.08 0.1 0.12 0.14
St
an
da
rd
d
ev
ia
tio
n [
-]
K-means
Raw FCM
Two clusters Three clusters
[image:13.595.245.503.289.478.2]DOI: 10.4236/sgre.2019.101001 14 Smart Grid and Renewable Energy compared. Among these, the FCM method with adequate parameters showed the best results.
Acknowledgements
This paper is based on the results obtained from a project commissioned by the New Energy and Industrial Technology Development Organization (NEDO). We also wish to thank Dr. Takashi Oozeki of the National Institute of Advanced Industrial Science and Technology (AIST) for technical support.
Conflicts of Interest
The authors declare no conflicts of interest regarding the publication of this pa-per.
References
[1] Nordmann, T., et al. (2014) Analysis of Long-Term Performance of PV System. Report IEA-PVPS T13-05.
[2] Chine, W., Mellit, A., Massi Pavan, A. and Kalogirou, S.A. (2014) Fault Detection Method for Grid-Connected Photovoltaic Plants. Renewable Energy, 66, 99-110.
https://doi.org/10.1016/j.renene.2013.11.073
[3] Silvestre, S., Mora-López, L., Kichou, S., Sánchez-Pacheco F. and Dominguez-Pumar, M. (2016) Remote Supervision and Fault Detection on OPC Monitored PV Systems.
Solar Energy, 137, 424-433. https://doi.org/10.1016/j.solener.2016.08.030
[4] Solórzano, J. and Egido, M.A. (2013) Automatic Fault Diagnosis in PV Systems with Distributed MPPT. Energy Conversion and Management, 76, 925-934.
https://doi.org/10.1016/j.enconman.2013.08.055
[5] Green, M., Brill, E., Jones, B. and Dore, J. (2017) Improving Efficiency of PV Sys-tems Using Statistical Performance Monitoring. Report IEA-PVPS T13-07.
[6] Dhimish, M., Holmes, V., Mehrdadi, B. and Dales, M. (2018) Comparing Mamdani Sugeno Fuzzy Logic and RBF ANN Network for PV Fault Detection. Renewable Energy, 117, 257-274. https://doi.org/10.1016/j.renene.2017.10.066
[7] Mekki, H., Mellit, A. and Salhi, H. (2016) Artificial Neural Network-Based Model-ling and Fault Detection of Partial Shaded Photovoltaic Modules. Simulation Mod-elling Practice and Theory, 67, 1-13. https://doi.org/10.1016/j.simpat.2016.05.005
[8] Hu, T., Zheng, M.H., Tan, J.J., Zhu, L. and Miao, W. (2015) Intelligent Photovoltaic Monitoring Based on Solar Irradiance Big Data and Wireless Sensor Networks. Ad Hoc Networks, 35,127-135. https://doi.org/10.1016/j.adhoc.2015.07.004
[9] Yang, D.Z., Dong, Z.B., Lim, L.H.I. and Liu, L.C. (2017) Analyzing Big Time Series Data in Solar Engineering Using Features and PCA. Solar Energy, 153, 317-328.
https://doi.org/10.1016/j.solener.2017.05.072
[10] Damiani, A., et al. (2018) Evaluation of Himawari-8 Surface Downwelling Solar Radiation by Ground-Based Measurements. Atmospheric Measurement Tech-niques, 11, 2501-2521. https://doi.org/10.5194/amt-11-2501-2018
[11] Ernst, M., Thomson, A., Haedrich, I. and Blakers, A. (2016) Comparison of Ground-Based and Satellite-Based Irradiance Data for Photovoltaic Yield Estima-tion. Energy Procedia, 92, 546-553. https://doi.org/10.1016/j.egypro.2016.07.139
DOI: 10.4236/sgre.2019.101001 15 Smart Grid and Renewable Energy
modelling in the Absence of Onsite Measured Plane of Array Irradiance (POA) and Module Temperature. Renew Energy, 86, 760-769.
https://doi.org/10.1016/j.renene.2015.09.005
[13] Drews, A., et al. (2007) Monitoring and Remote Failure Detection of Grid-Connected PV Systems Based on Satellite Observations. Solar Energy, 81, 548–564.
https://doi.org/10.1016/j.solener.2006.06.019
[14] Tadj, M., Benmouiza, K., Cheknane, A. and Silvestre, S. (2014) Improving the Per-formance of PV Systems by Faults Detection Using GISTEL Approach. Energy Conversion and Management, 80, 298-304.
https://doi.org/10.1016/j.enconman.2014.01.030
[15] Liu, X., Okajima, K. and Takashi, O. (2014) Output Power Decrease Detection for Residential Photovoltaic System with Using Satellite Data. Proceedings of Grand Renewable Energy, P-Pv-2-1, 1-4.
[16] Perez, R., Seals, R., Ineichen, P., Stewart, R. and Menicucci, D. (1987) A New Sim-plified Version of the Perez Diffuse Irradiance Model for Tilted Surfaces. Solar Energy, 39, 221-231. https://doi.org/10.1016/S0038-092X(87)80031-2
[17] Bezdek, J.C., Ehrlich, R. and Full, W. (1984) FCM: The Fuzzy c-Means Clustering Algorithm. Computers and Geosciences, 10, 191-203.