Scripted collaborative
drawing in elementary
education
The role of working preference
Master’s thesis Alieke van Dijk
First supervisor: Dr. A.H. Gijlers
Second supervisor: Prof. Dr. A. Weinberger
2
Index
Abstract ... 3
Theoretical framework ... 4
Method ... 11
Results ... 22
Conclusion and Discussion ... 38
Acknowledgements ... 43
References ... 44
Appendix I – Informative text Photosynthesis (in Dutch) ... 47
Appendix II – Script ... 48
Appendix III – Coding scheme Discourse analysis ... 70
Appendix IV – Coding scheme Drawing analysis (in Dutch) ... 78
Appendix V – Coding scheme Drawing comparison ... 82
3
Abstract
This study investigated the effects of scripting and working preference on collaborative drawing in elementary education. It was hypothesized that the use of a script and grouping by working preference enhances discourse quality, equal distribution of discourse, drawing quality and knowledge acquisition. This quasi-experimental field study included 88 students in four different classes who worked collaboratively on a drawing assignment. The instructional goal was to develop a joint drawing, that completely explained the process of photosynthesis. This collaborative drawing assignment was expected to go together with a high-quality discourse and should eventually lead to knowledge acquisition. According to data of a working preferences-questionnaire, the students were grouped into dyads by either positive working preference or negative working preference. Each class was subscribed to one of the two conditions: the scripted or the non-scripted condition. The findings indicate that students in the scripted condition show a more equal distribution of their discourse and higher levels of knowledge acquisition. In addition, students and dyads in the non-scripted condition show a higher discourse quality and drawing quality. The results indicate a relation between discourse and drawing quality. The findings concerning working preference differences indicate a higher drawing quality for the students grouped by positive working preference.
4
1.
Theoretical framework
In the current curriculum of elementary education, the use of graphical representations is prevalent. Illustrations, tables and graphs are frequently used to elucidate the presented information. Thus, it seems safe to say that most elementary school students have experience with exploring graphical representations in the context of informative texts. Creating representations seems to have benefits exceeding simply examining them (Chi, Slotta, & de Leeuw, 1994). Consequently, it would be interesting to examine the added value of the creation of representations.
1.1 Drawing
Graphical representations play a major role in knowledge acquisition (Zhang, 1997). They help students transform abstract information into a more concrete and understandable subject (Rennie & Jarvis, 1995). Research also shows that graphical representations influence the deeper understanding of scientific topics, like photosynthesis, whereas just examining the representations could lead to difficulties with processing the material (Chi, et al., 1994). Enabling students to create a representation themselves might lead to better acquisition of the material (Savinainen, Scott, & Viiri, 2004). The easiest way for elementary students to create a representation could be by drawing the process, an activity most elementary students are familiar with (Rennie & Jarvis, 1995). Drawing a scientific topic like photosynthesis or the water cycle could be motivating and might arouse prior knowledge on the subject (Rennie & Jarvis, 1995). The drawing process provides students with the opportunity to evaluate the accuracy of their prior knowledge (Moore & Caldwell, 1993). This way, the students could activate their own knowledge base, and might even be able to revise and integrate new ideas during the drawing process.
Self-created external representations have to potential to serve collaborative learning (Suthers & Hundhausen, 2003). It is possible for a representation to initiate elaboration on the subject. While creating a joint drawing, students might engage in elaborative discussion and build on their partner’s contributions. The representations students jointly create could evoke critical reflection of the students’ own ideas and their prior knowledge on the subject. This might lead to the opportunity for students to extend their knowledge (Joshi & Rosé, 2007).
1.2 Collaborative interaction
5
environment. Because this knowledge is not sufficiently present, there is a growing interest insuccessful implementing and shaping of collaborative learning into elementary education.
The general advantages of collaborative learning are demonstrated by different studies. According to King (1999), interaction and activity with others encourages students to share their ideas, information, and perspectives. As a result of this sharing, they mediate each other’s learning process in constructing new knowledge and significance together. This positive result of collaborative learning is most likely caused by the fact that, to collaborate successfully, students must externalize their own knowledge and engage in processes like questioning, clarifying and elaborating.
Thus, the major advantage of collaborative learning seems to be that the partners could expand their one knowledge base with complementary knowledge of the others. To completely understand and process this ‘new’ knowledge, it is imperative the students operate on the reasoning of their partner (Berkowitz & Gibbs, 1983), as is reflected in the concept of ‘transactivity’. Transactive discourse is defined as a cognitive act upon the way of thinking of the collaboration partner (Berkowitz, 1980-I, 1980-II; Teasley, 1997). Berkowitz (1980-II) hereby states that transactivity will occur in the context of resolving efforts, and explaining or understanding possible existing differences in reasoning. For an utterance to be transactive, and to be called a transact, it always has to include the way of thinking of the other. To specify this, it is said that collaborative learning groups use a transactive dialogue when they think through, build upon, doubt, or argue about the opinion and thoughts of the other with regard to the understanding of the task or the possible solutions (Joshi & Rosé, 2007; Teasley, 1997). The degree in which learners refer to input from their collaboration partner is an important aspect in argumentative knowledge construction in dyadic discourse (Weinberger & Fischer, 2006).
To describe to what extent students engage in transactive talk, Weinberger and Fischer (2006) distinguished five social modes of co-construction: (1) externalization, which means that students make a contribution to the collaboration without referring to the other’s input, (2)
conflict-6
oriented consensus building as the most transactive form (Teasley, 1997). These social modes canbest be determined by observing how students work on the task and formulate arguments together (Weinberger & Fischer, 2006).
To value the potential of collaborative learning, and with this the quality of the discourse, it is important to look at the social modes of co-construction in the discourse as well as the mere content of the discourse (Berkowitz & Gibbs, 1983).To define the degree in which the students refer to the content of the task, the collaboration process could be analyzed by means of the epistemic dimension of argumentative knowledge construction (Weinberger & Fischer, 2006). The category focussing on the explicit mentioning of the subject-related concepts is called: construction of conceptual space (Weinberger & Fischer, 2006). The construction of conceptual space depends of the degree of summarizing, rephrasing, and discussing the subject. This category indicates whether learners are able to construct relations between concepts and define those relations and concepts. An important requirement for argumentative knowledge construction to happen is that learners need to construct and balance arguments and counterarguments, in order to completely understand the material (Weinberger & Fischer, 2006).
For the content-related and transactive discourse to be effective for all collaborative partners, every student should participate equally in the discourse (Teasley, et al., 2008; Weinberger & Fischer, 2006). Only this way can discourse be effective for the individual knowledge acquisition. Therefore, it is important to also examine the participation of the students in the transactive and content-related discourse. With this, one should examine the participation dimension (Weinberger & Fischer, 2006), that distinguishes between the actual participation (quantity of participation), and the participation being on an equal basis (equality of participation). A study by Cohen and Lotan (1995) shows that collaborative learning in small groups enhances equality of participation, because all students have the chance to contribute to the discussion. So, it might be that collaboration in dyads enhances the participation distribution even more.
To conclude, collaborative learning is more than just sitting next to each other. For collaborative learning to be effective, it is important that the discourse is sufficient in terms of its transactive and epistemic quality, and that the participation of the collaborative partners comes near equality. To create an advantageous collaboration, scripting might be necessary. This way, possible advantages of collaborative learning in elementary education could be best supported.
1.3 Script
7
and not in others, is not clear. Collaborative discourse rarely results in equal participation of thepartners (Weinberger, Fischer, & Mandl, 2001). Various studies suggest that scripting can raise the quality of the discourse and facilitate equal distribution in a collaborative setting (Dillenbourg & Jermann, 2007; Dillenbourg & Tchounikine, 2007). Scripts structure the interaction to make sure that the students will participate in high-quality discourse (Dillenbourg & Jermann, 2007; King, 1999), and that they will participate equally in the discourse (Weinberger, et al., 2001). Furthermore, a script also might stimulate learners to carry out activities beneficial to collaborative learning, that they might otherwise not do (O'Donnell, 1999). Hereby, the script will state a set of rules that spell out the way partners should collaborate with each other. Therefore, scripted collaboration might increase students’ knowledge construction.
Just making students work in dyads will not guarantee discourse quality and equal distribution of participation to occur, or drawing quality and knowledge acquisition for that matter. Scripting could address this problem. A combination of a macro and micro script might be the best way to ensure that discourse quality, discourse participation, drawing quality and knowledge acquisition are supported. Macro scripts aim at the creation of learning situations in which the students are supported in their collaborative knowledge acquisition-enhancing activities (Dillenbourg & Tchounikine, 2007). One way to influence collaborative knowledge acquisition activities the script could be to include an individual preparation phase in the script. An individual preparation phase would provide students with the opportunity to activate their prior knowledge and improve understanding of the subject (van Boxtel, van der Linden, & Kanselaar, 2000). Van Boxtel, van der Linden and Kanselaar (2000) report that individual preparation resulted in better knowledge acquisition and higher discourse quality. Their findings suggest that individual preparation enhanced the degree in which the students operated on each other’s reasoning, which might have positively affected the knowledge acquisition.
8
However, scripting could also have a limiting effect on the students. It is important to makesure that a script leaves room for creativity and innovation of the students (O'Donnell, 1999), and that the script does not interrupt with natural collaborative mechanisms (Dillenbourg, 2002). A collaborative script spells out for the students how to behave and what to elaborate about, and therefore might hinder students to think for themselves (Weinberger, Ertl, Fischer, & Mandl, 2005). Students tend to follow the instructions of the script, without fully understanding their functions (Dillenbourg, 2002; Gijlers & de Jong, 2009). When the script does cross this line, it could impede the learning process of the students. To make sure this does not happen, it is important to create a working environment in which the students can behave freely, even though they are instructed in what to do.
1.4 Working preference
Students themselves indicate that collaboration functions as a foundation for making and, especially, keeping friends (Bigelow, 1977). When asking elementary students to group themselves, they will probably form friendship-based groups. Children generally seem to be more motivated to work with friends (Zajac & Hartup, 1997). To fully employ the advantages of collaborative learning, it seems important to group the students in a most beneficial way. Nevertheless, research shows that students indicate a difference between a ‘good friend’ and a ‘good worker’ (Mitchell, Reilly, Bramwell, Solnosky, & Lilly, 2004). This might lead to ambiguous and unexpected choices in selecting a collaboration partner. Hence, it seems useful to examine how working preference will affect students’ collaborative drawing process and learning outcomes.
Positive social contact with the other might enhance the effectiveness of collaboration (Kagan & Kagan, 1994). Students who like each other learn the most in collaborative learning situations. Zajac and Hartup (1997) reviewed 13 studies on the relation between friendship and collaboration. Their review reveals that friends tend to support each others’ cognitive performance. Students who cooperated with friends differed in behavior during collaboration from those who cooperated with non-friends (Azmitia & Montgomery, 1993; Zajac & Hartup, 1997). Friends demonstrated higher levels of transactive discourse, visible in elaborative discussions and conflicts. A study on boys by Newcomb and Brady (1982) demonstrated that friends were more task oriented, engaged in more mutually oriented discourse, and showed more positive affect than non-friends did. These findings could be generalized to the female gender and mixed collaborative groups, whereas it is stated that gender differences do not influence the degree in which friendship facilitates communicative and reciprocal aspects of social interaction (Newcomb, Brady, & Hartup, 1979).
9
social mode dimension of Weinberger and Fischer (2006), conflict-oriented consensus building isseen as the most transactive form of communication (Teasley, 1997). This benefit is visible in the assertion of Zajac and Hartup (1997), who conclude that “friends are, in comparison to non-friends, more concerned with resolving their conflicts through negotiation and disengagement than through power assertion”(pp. 9). It shows that working preference may ease performance not only through a higher degree of discourse, but also by using disagreements to their advantage.
1.5 Summary
Elementary school students are acquainted with the use of graphical representations to elucidate scientific learning material. Making elementary students create a drawing on a scientific topic by themselves might enhance their knowledge acquisition (Savinainen, et al., 2004). Drawing collaboratively might improve the students’ knowledge acquisition even more, while students are able to share and expand their knowledge. Discourse quality – visible in epistemic and transactive discourse, and in the equality of the participation – might positively affect knowledge acquisition of the students (Berkowitz & Gibbs, 1983; Weinberger & Fischer, 2006). Just letting the students work in groups does not guarantee this to occur. The above cited literature suggests that scripting might enhance high-quality drawing, discourse quality and equal distribution of participation (Dillenbourg & Jermann, 2007; Dillenbourg & Tchounikine, 2007). By combining a micro and a macro script, the entire collaborative phase should be covered. Elementary school students prefer collaboration with a friend. Research indicates that a positive working preference toward the partner has a positive effect on students’ cognitive performance as well as their collaboration process.
1.6 Present study and Research Questions
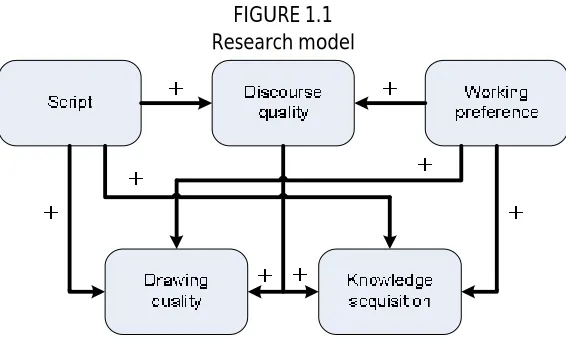
The aim of this study is to investigate the effects of scripting and grouping by working preference on discourse quality, drawing quality, and individual knowledge acquisition. Elementary school students were invited to create drawings on the process of photosynthesis. The learning task required students to relate theoretical concepts with each other, and to explain relevant theoretical principles. The findings from the studies discussed in the previous sections, suggest that scripting might support the students in the collaborative drawing process, and might lead to higher discourse quality and a higher knowledge acquisition. In the present study we evaluate scripting in a collaborative drawing context, comparing a group of students who are supported by a script with a control group that did not receive additional support in the form of a script.
10
which might stimulate students to engage in task-oriented behavior and influence knowledgeacquisition. Besides this, the individual drawing phase provides the students with an additional preparation possibility before starting the collaborative phase. Therefore it is expected that the scripted condition will fare better on the drawing quality than the non-scripted condition.
From literature on group composition it became clear that working preference could influence the course of the collaboration process, and consequently the knowledge acquisition of the students. To examine this possible influence, the students were grouped in dyads with a positive or a negative working preference. It is expected that a positive working preference contributes to the discourse quality of the students, while working preference seems to enhance elaborative discussion. Grouping by positive working preference is also expected to enhance drawing quality and knowledge acquisition. The latter expectations derive from the hypothesis that discourse quality enhances both drawing quality and knowledge acquisition. Since the positive working preference group is expected to show higher discourse quality, it is therefore anticipated that this group will also show higher drawing quality and knowledge acquisition.
[image:10.595.156.439.453.623.2]Since research indicates that students in positive working preference groups show a higher level of discourse quality, it seems interesting to examine what the additional effect of the script might be. Would the script further enhance the discourse quality, or would it hinder the students in their natural way of communication with each other?
FIGURE 1.1 Research model
11
1. To what extent can a script facilitate knowledge acquisition concerning the photosynthesisprocess?
2. To what extent can a script facilitate discourse quality and discourse distribution during collaboration?
3. To what extent can a script facilitate drawing quality?
4. To what extent can grouping by positive working preference facilitate knowledge acquisition concerning the photosynthesis process?
5. To what extent can grouping by positive working preference facilitate discourse quality and discourse distribution during collaboration?
6. To what extent can grouping by positive working preference facilitate drawing quality during collaboration?
7. To what extent are interaction effects of scripting and working preference on the discourse quality, discourse distribution, drawing quality and knowledge acquisition to be expected? 8. To what extent is discourse quality related to knowledge acquisition?
9. To what extent is discourse quality and distribution related to drawing quality? 10. To what extent is drawing quality related to knowledge acquisition?
2.
Method
2.1 Participants
Eighty-eight, fifth and sixth grade elementary school students (aged 10-12) from three different schools and four different classes participated in this study. Each class was assigned to a condition, resulting in two experimental classes and two control classes. The control group consisted of 50 students (25 male, 25 female) and the experimental group included 38 students (23 male, 15 female). All students completed an identical first session of the study (see also section 2.3.1), in which they all received the same preparation in the second session (see also section 2.3.2) by the same experimenter (the researcher), who was video controlled to identify and control for differences in her behavior.
12
asked to check the dyads for possible problematic pairs among the paired students. The condition [image:12.595.59.527.234.284.2]the dyads were assigned to was defined by the assigned condition to their class. The division of the working preference dyads over the two conditions was approximately equivalent (see Table 2.1). Six students were not to be grouped according to the working preference information. Due to absence of some students on the second school visit, last-minute changes in grouping led to the creation of three dyads with unknown preference. These dyads were excluded from the analyses.
TABLE 2.1
Division conditions and preferences for the students
Scripted condition Non-scripted condition
Negative working preference 20 20
Positive working preference 18 24
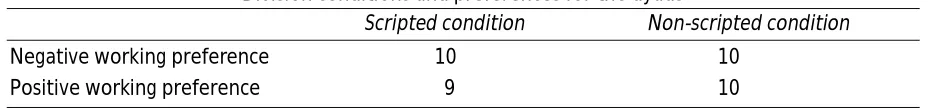
[image:12.595.66.530.405.460.2]During the collaborative phase, two of the recording devices did not record the discourse of the dyads. This means that two of the dyads were not included in the discourse analyses. Therefore, the division of conditions and preferences for the dyads differed to some extent from abovementioned (see Table 2.2).
TABLE 2.2
Division conditions and preferences for the dyads
Scripted condition Non-scripted condition
Negative working preference 10 10
Positive working preference 9 10
2.2 Learning domain
Groups in both conditions worked collaboratively on a drawing task concerning the photosynthesis process. Photosynthesis contains the process in which vegetation fabricates organic ingredients, like sugar (nutrient) and oxygen, by means of carbon oxide, sunlight and water. The curriculum rules for elementary education in the Netherlands by the SLO (Stichting Leerplanontwikkeling Nederland), expressed in Tule (2009), state that elementary school students should be taught the different aspects of the photosynthesis process, but the process as a whole is not a part of the Dutch elementary school curriculum. Therefore the process of photosynthesis is relatively new for the students but ought to be comprehensible.
13
Learning materials. To get acquainted with the ‘new’ subject, the students in both thescripted and the unscripted condition were introduced to photosynthesis by a video clip and text (see also Appendix VI). Both the video clip and the text were adjusted to the students’ level of understanding. The text was based on materials developed by two acknowledged educative organizations in the Netherlands: Klokhuis (Klokhuis, 2010) and SchoolTV (SchoolTV, 2010). By means of this text , the students should be able to behold the important concepts and processes of photosynthesis, and to process these by creating a drawing.
Before starting with the official sessions of the study, a pilot was completed to test the important elements of the study. It seemed that the students did not experience trouble with understanding the instructions and completing the tests.
2.3 Procedure/Script
The study was conducted in two separate sessions with a couple of weeks in between. Both sessions took place in the classroom of the selected class under the guidance of an experimenter (the researcher), and were performed on regular school days, after consultation with the teachers. Time between the first and the second session was two to three weeks, depending on the schedule of the school.
2.3.1 First session
The first session was primarily meant to be a preparation session for the second session, and lasted 50 minutes. The session took place in the classroom of the selected class, in which each student sat on his/her own desk.
Introduction and first cued recall test (5 minutes) The first session started with a brief introduction on the experiment in which the experimenter explained the reason of the school visit. Subsequently, the students completed their first cued recall list.
Training in the drawing assignment (15 minutes) Students received a training in how to make a graphical representation of an informative text, to make sure that they will be able to do this themselves in the next sessions (see Appendix II for the training).
Questionnaire on working preference and collaboration skills (15 minutes) The students were asked to answer four questions, presented in the working preferences questionnaire (see also section 2.4.1). Together with this questionnaire, the students addressed the statements of the collaboration skills questionnaire (see also section 2.4.2).
14
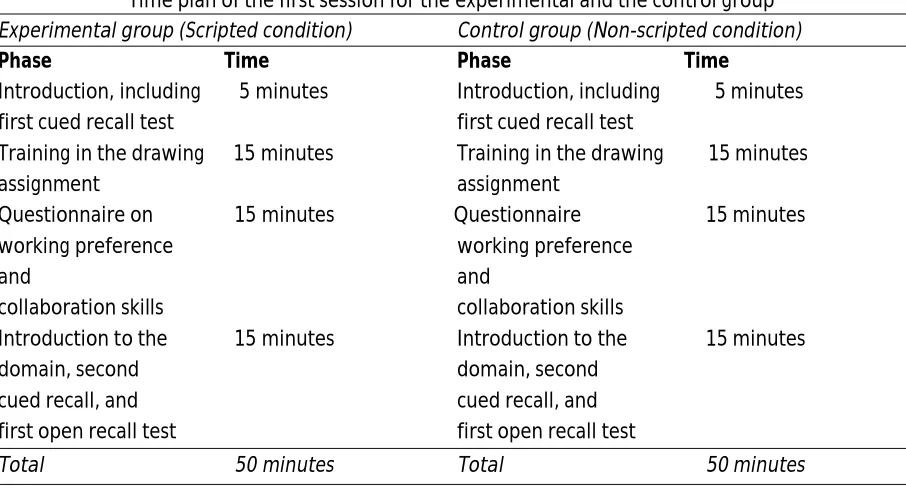
TABLE 2.3Time plan of the first session for the experimental and the control group
Experimental group (Scripted condition) Control group (Non-scripted condition)
Phase Time Phase Time
Introduction, including 5 minutes Introduction, including 5 minutes first cued recall test first cued recall test
Training in the drawing 15 minutes Training in the drawing 15 minutes
assignment assignment
Questionnaire on 15 minutes Questionnaire 15 minutes
working preference working preference
and and
collaboration skills collaboration skills
Introduction to the 15 minutes Introduction to the 15 minutes
domain, second domain, second
cued recall, and cued recall, and
first open recall test first open recall test
Total 50 minutes Total 50 minutes
2.3.2 Second session
The second session differed primarily for the experimental and the control group, as was visible in some differences in the script. The control group received no additional support on the collaborative drawing process. The script for the experimental condition foresaw step-by-step instructions guiding the entire collaborative drawing process. The differences between the control group and the experimental group are reflected in the script (Appendix II).
Grouping procedure and explanation (5 minutes) The second session for both groups started with the announcement of the dyads. With entering the classroom, the students were immediately be seated next to their collaborative partner. To avoid questions, the session started with an elaborate explanation about the schedule for this morning/afternoon.
Third cued recall test and training refresher (5 minutes) The second session continued with the same cued recall test on photosynthesis, after which the students were provided with a short refresher of the training.
Questionnaire on collaboration expectations and a pre-test on satisfaction (10 minutes) The students were asked to answer another questionnaire. This questionnaire consisted of the collaboration expectations questionnaire (see also section 2.4.3) and the pre-questionnaire on satisfaction with their assigned partner (see also section 2.4.5).
15
Collaborative phase (35 minutes) This phase included the major differences between the scriptedand the non-scripted conditions. The start of the collaborative phase for the experimental group started with the individual phase, in which the students created an individual drawing on the photosynthesis process by means of the text on this topic. Subsequently, the students swapped their drawing with their collaborative partner, and searched the other’s drawing for differences and commonalities. This comparison got them started with the next phase: creating their joint drawing. In this phase the students were told to elaborate on the differences and commonalities found in their drawings to come to an agreement: a joint drawing. To guide them through the elaborative processes, prompt cards were generated. These cards contained discussion starters and different responses (see also Table 2.4). The students each received a desk of three cards. They were told that they should use these cards during the discussion of the identified differences and to make the necessary concessions on the final elements in their joint drawing. This way the students might spend more time on task-related talk (and especially content related talk) than without the guidance of the prompt cards. The control group did not get such instructions, and were simply told to work together on a joint drawing which includes the elementary components of the photosynthesis as clear and elaborate as possible.
TABLE 2.4
Prompt cards, translated into English
Number Text
1 Would you please explain to me why you drew or did not drew ... ?
2 I drew ... differently, because ...
3 We should draw ... differently, that is ...
Questionnaire on collaboration experiences and the post-test on satisfaction (10 minutes) The second session ended with another round of testing. The students were asked to complete a last questionnaire, concerning their experiences with the collaboration phase (see also section 2.4.4) and on their satisfaction with their assigned collaboration partner (see also section 2.4.5).
Fourth cued recall and second open recall (5 minutes) The last phase of the second session ended with a final cued and open recall test.
2.4 Tests and Self-Reports
16
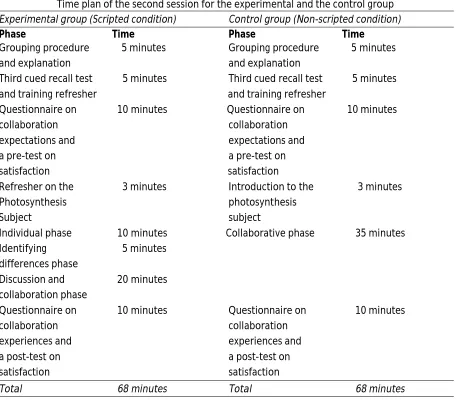
TABLE 2.5Time plan of the second session for the experimental and the control group
Experimental group (Scripted condition) Control group (Non-scripted condition)
Phase Time Phase Time
Grouping procedure 5 minutes Grouping procedure 5 minutes
and explanation and explanation
Third cued recall test 5 minutes Third cued recall test 5 minutes and training refresher and training refresher
Questionnaire on 10 minutes Questionnaire on 10 minutes
collaboration collaboration
expectations and expectations and
a pre-test on a pre-test on
satisfaction satisfaction
Refresher on the 3 minutes Introduction to the 3 minutes
Photosynthesis photosynthesis
Subject subject
Individual phase 10 minutes Collaborative phase 35 minutes Identifying 5 minutes
differences phase
Discussion and 20 minutes collaboration phase
Questionnaire on 10 minutes Questionnaire on 10 minutes
collaboration collaboration
experiences and experiences and
a post-test on a post-test on
satisfaction satisfaction
Total 68 minutes Total 68 minutes
2.4.1 The working preference questionnaire
17
2.4.2 The collaboration skills-questionnaireTo assess the students’ perceived collaboration skills, the students were confronted with 14 statements that addressed different collaboration skills. The statements were based on work of McLoughlin and Luca (2004), and included skills like the ability to listen to your collaboration partner, explaining the material to your collaboration partner, and being able to cooperate in general. The students were asked to rate the statements according the five answering categories of the Likert scale: strongly disagree – disagree – neither agree nor disagree – agree – strongly agree. The reliability analysis of the items resulted in a Cronbach’s alpha coefficient of .65
2.4.3 The collaboration expectations-questionnaire
To assess the students’ expectations of the collaboration, a questionnaire consisting of 12 statements was created. The statements referred to the expectations the students had about the upcoming collaborative phase with their assigned collaboration partner. The formulated statements are interconnected to the issues cited in the collaboration skills-questionnaire, now focusing on the application of these skills. The students could rate these statements using the Likert scale. The reliability analysis of the items resulted in a Cronbach’s alpha of .91.
2.4.4 The satisfaction with the collaboration partner-questionnaire
To assess the satisfaction with the collaboration partner, another questionnaire was developed. The questionnaire was administered prior to the collaborative phase, and consisted of eight statements, focusing on the degree in which the students liked to work with their assigned partner. The issues addressed here are connected to the collaboration skills, collaboration expectations, and collaboration experiences tests, and are based on work by McLoughlin and Luca (2004). The students could rate these statements by means of the Likert scale. The reliability analysis of the items of the satisfaction questionnaire resulted in a Cronbach’s alpha coefficient of .89.
2.4.5 The cued recall test on photosynthesis
18
2.4.6 The open recall test on photosynthesisAn additional way to measure the student’s knowledge acquisition is an open recall test. This test consisted of one assignment, in which the students were asked to answer the question “What is photosynthesis?”. Answering had to occur in full sentences; citing single words did not suffice. The test was administered at the end of both sessions, and was completed twice during this study.
2.5 Data analysis
In order to investigate the influence of scripting and working preference on the discourse quality, knowledge acquisition and drawing quality of the students, the gathered data were coded and further analyzed. To evaluate the collaboration process, the discourse of the dyads had to be analyzed, and to assess the knowledge acquisition of both the individual students and the dyads, the drawings and the open recall tests had to be coded.
2.5.1 Discourse analysis
To assess the degree of transactivity in the collaboration discourse, a coding scheme was developed (see Appendix III) based on a classification made by Weinberger and Fischer (2006). It focuses on the epistemic and social mode segments in the discourse of the dyads. First, the audio file was segmented into utterances. This occurred by means of speaking turns, in which the social mode segments were taken into account as well. An utterance now covered a speaking turn of one of the speakers in the dyad. Second, the segments were coded according to the epistemic and social mode dimensions (see Table 2.6 and 2.7).
TABLE 2.6
Overview and examples of the collaborative process codes on the epistemic dimension
Categories Examples from Students’ Interaction -Content talk
Concept Naming “We should draw a plant.”
Concept Definition “Carbon oxide is what we breathe out.”
Process Definition “It will travel from the stalk to the leaves.”
Concept-process connection “The roots extract water from the ground.”
-Coordinative talk
Coordination “Let’s draw carbon oxide in orange.”
-Off-task talk
Off-task talk “I have to go to the gym this evening.”
Unspecified references “Why did you draw this?”
-Other
Paraverbal utterances “Pfffft.”
19
TABLE 2.7Overview and examples of the collaborative process codes on the social mode dimension
Categories Examples from Students’ Interaction -Informative talk
Externalization “We should draw a plant.”
Elicitation “Is it okay for me to draw the roots?”
-Quick consensus building
Agreeing “Okay.”
Disagreeing “No.”
-Transactive talk
Integrating “I see what you mean.”
Elaborate critiques and modification “Okay, but isn’t it like that?”
-Off-task talk
Conflict off-task talk “Stop being so mean and annoying!”
Non-conflict off-task talk “I have to go to the gym this evening.”
-Other
Paraverbal utterance “Pfffft.
Uncodable “…..”
To measure the inter-rater reliability of the coding process, a second coder was included. The second coder completed two 35-minute audio files, consisting of 1158 spoken segments. To assess the reliability coefficient, the coded segments of both coders were analyzed and compared. Subsequently, inclusion of this second coder resulted in the inter-rater reliability coefficient for coding utterances on the epistemic dimension of .82 (Krippendorff’s alpha). The inter-rater reliability coefficient for coding utterances on the social mode dimension reached .83 (Krippendorff’s alpha) as well. The results presented in this study are based on coding from both coders.
For each sub-category on the epistemic dimension and the social mode dimension percentagewise scores were calculated, showing the proportional amount of talk spent and showing the distribution of participation on these categories. In addition, the percentagewise scores were calculated for the combined categories on both dimensions (see Table 2.6 and 2.7 for an overview of the categories).
2.5.2 Drawing analysis
20
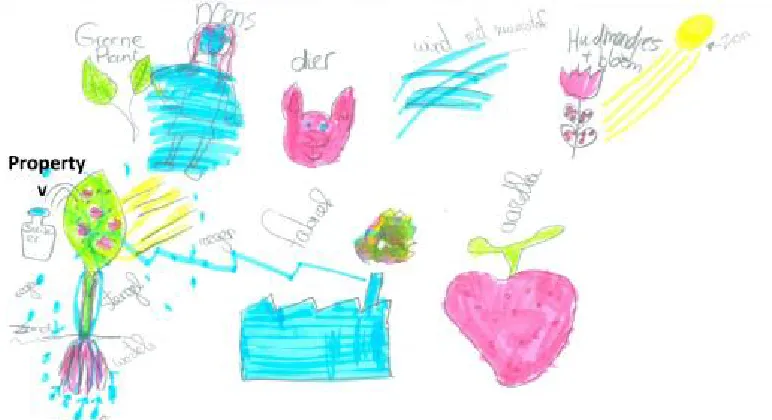
leaves was coded a process, and sugar as the plant’s own nutrition is regarded as a property (see [image:20.595.168.400.278.479.2]Figure 2.1 and 2.2). To code the drawings an expert drawing was used to define the concepts, processes and properties that should be present in the drawing. With this the scoring system for the drawings was developed. A second coder coded about 25% of the drawings. After comparison, the inter-rater reliability coefficient for coding the drawings on the presence of concepts, processes and properties reached .97 (Krippendorff’s alpha) in total, with an alpha for the different items between .92 and 1 (Krippendorff’s alpha).
FIGURE 2.1
Drawing of the process of photosynthesis by a negative working preference dyad in the scripted condition (with Dutch annotations)
FIGURE 2.2
[image:20.595.136.522.519.729.2]21
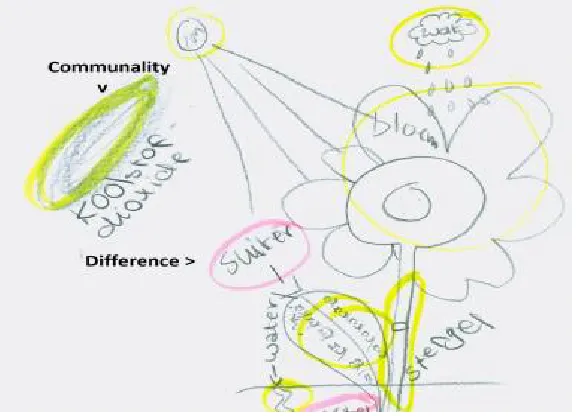
The scores were calculated for the presence of the concepts, processes, properties and their [image:21.595.161.450.312.520.2]annotations, showing the absolute presence of these elements. In addition, the total scores were calculated on the representations (combining the drawn concepts, processes and properties), annotations (combining the annotated concepts, processes and properties), and the overall drawing. Another aspect of the drawings that needed to be analyzed were the communalities and differences marked on the individual drawings only during the comparison phase for the scripted condition. The students circled the communalities with a green marker and the differences with a pink marker. To code this, another coding scheme was developed (see Appendix V). This scheme focused on the counting of the marked concepts, processes and properties (see Figure 2.3).
FIGURE 2.3
Drawing of the process of photosynthesis by a positive working preference dyad in the scripted condition (with Dutch annotations)
2.5.3 Open recall
22
To gain insight in the knowledge acquisition on the open recall tests, knowledge acquisitionscores were calculated for the presence of the concepts, processes and properties. These scores showed the increase in presence of these elements in the answers given by the students. In addition, the total scores were calculated on the overall knowledge acquisition (combining the concepts, processes and properties).
3.
Results
In this section, the results of analyses of the differences between the conditions and the working preferences, the interactions between them, and the (correlational) relations between the different dependent variables are presented. First the overall knowledge acquisition in the study was examined by means of a repeated measures analysis. After this, the differences between the conditions and preferences were assessed by univariate and multivariate analyses of covariance. Subsequently, the interactions between condition and working preference were examined. And finally, correlations and regressions were conducted to analyze the hypothesized relations between the independent variables.
3.1 Overall knowledge acquisition
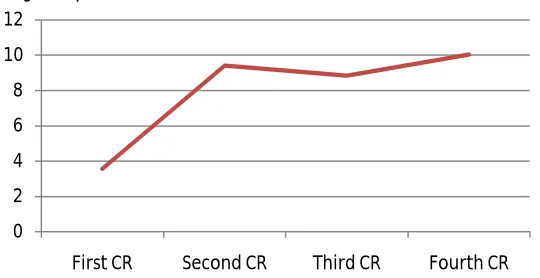
In this section the results of the repeated measures analysis on the overall knowledge acquisition of the students on the cued and open recall tests are reported. Knowledge acquisition on the cued recall tests was measured across four time periods (beginning and ending of the first session, and the beginning and ending of the second session). There is a significant effect for the cued recall tests, F
[image:22.595.164.434.625.764.2](3, 85) = .02, p < .001, Wilks Lambda = .14, η² = .86. The students show a significant increase from the third to the fourth, and from the first to the fourth cued recall tests (see Figure 3.1 for a complete overview). There is no significant effect for the open recall tests which was measured across two time periods (ending of both sessions), F (1, 87) = .52, p = .47, Wilks Lambda = .99, η² = .01. Nevertheless, the students show a small increase in their open recall scores.
FIGURE 3.1
Knowledge acquisition on the cued recall test for the individual students
0 2 4 6 8 10 12
23
3.1 Differences on knowledge acquisition and drawing quality for the
individual students
In this sub-section, the differences between the conditions and working preferences in knowledge acquisition and drawing quality of the individual students are reported. Although the drawing quality resulted from a collaborative activity, individual drawing quality scores for each student were calculated (see section 2.5.2). This procedure is necessary to gain insight in the relation between scripting/working preference and drawing quality for the individual students. Four one-way between-groups multivariate analyses of covariance were performed, and 36 one-way between-between-groups analyses of covariance were conducted to specify the differences. First condition (scripted vs. non-scripted) was the independent variable interchanged by working preference (negative vs. positive). Knowledge acquisition on the cued recall tests, the knowledge acquisition on the open recall tests, and the quality of the joint drawing were the dependent variables.
3.1.1 Scripting influences on knowledge acquisition and drawing quality
One-way ANOVA’s with school/class, age, prior knowledge and ability as dependent variables, and condition as independent variable, reveal conditional differences for students from different schools (school/class) (F (1, 86) = 35.12, p < .001, η² = .29) and age (F (1, 86) = 5.84, p < .05, η² =.06). Consequently, school/class and age are used as covariates. No significant conditional differences were found for prior knowledge and ability.
First all scores on the different subcategories of knowledge acquisition and drawing quality (as listed in Table 3.1) were included in the analyses. The MANCOVA showed that there is a statistically significant difference between the scripted and the non-scripted condition on the dependent variables, F (12, 73) = 5.12, p < .001, Wilks Lambda = .54, η² = .46. A second MANCOVA examined the combined total scores regarding knowledge acquisition and the combined total scores of all aspects regarding drawing quality (as listed in Table 3.1). No statistically significant difference between the scripted and the non-scripted condition on these dependent variables, F (6, 79) = 1.78,
p = .12, Wilks Lambda = .88, η² = .12 is found.
24
15.04, p < .001, η² = .15) as well as the amount of processes that were annotated (F (1, 84) = 9.04, p < [image:24.595.71.526.157.506.2].01, η² = .10).All other univariate ANCOVA’s revealed insignificant results (see Table 3.1).
TABLE 3.1
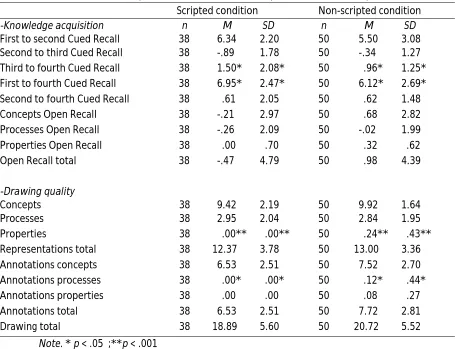
Individual scores of the dependent variables for the scripted and the non-scripted condition Scripted condition Non-scripted condition
-Knowledge acquisition n M SD n M SD
First to second Cued Recall 38 6.34 2.20 50 5.50 3.08 Second to third Cued Recall 38 -.89 1.78 50 -.34 1.27 Third to fourth Cued Recall 38 1.50* 2.08* 50 .96* 1.25* First to fourth Cued Recall 38 6.95* 2.47* 50 6.12* 2.69* Second to fourth Cued Recall 38 .61 2.05 50 .62 1.48 Concepts Open Recall 38 -.21 2.97 50 .68 2.82 Processes Open Recall 38 -.26 2.09 50 -.02 1.99 Properties Open Recall 38 .00 .70 50 .32 .62 Open Recall total 38 -.47 4.79 50 .98 4.39
-Drawing quality
Concepts 38 9.42 2.19 50 9.92 1.64
Processes 38 2.95 2.04 50 2.84 1.95
Properties 38 .00** .00** 50 .24** .43**
Representations total 38 12.37 3.78 50 13.00 3.36
Annotations concepts 38 6.53 2.51 50 7.52 2.70
Annotations processes 38 .00* .00* 50 .12* .44* Annotations properties 38 .00 .00 50 .08 .27
Annotations total 38 6.53 2.51 50 7.72 2.81
Drawing total 38 18.89 5.60 50 20.72 5.52
Note. * p < .05 ;**p < .001
3.1.2 Grouping influences on knowledge acquisition and drawing quality
One-way ANOVA’s with school/class, age, prior knowledge and ability as dependent variables, and preference as independent variable indicate that the ability of the students (F (1, 80) = 11.05, p < .005, η² = .12) significantly differs between the working preferences (positive vs. negative working preference), and therefore should be included as a covariate. Age, prior knowledge and class/school do not show significant differences between the working preferences.
25
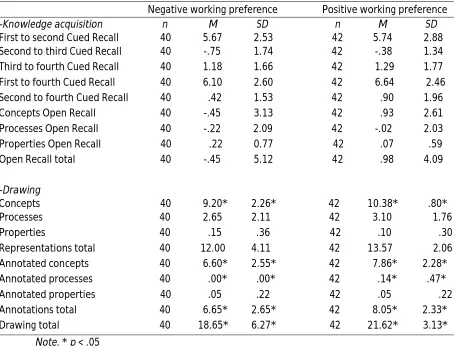
Additionally, univarate ANCOVA’s were conducted for each independent variable to identifythe nature of the differences between the preferences. A significant difference between the working preferences is found on the amount of concepts represented in the drawing (F (1, 79) = 6.24, p < .05,
[image:25.595.72.527.263.609.2]η² = .07), the amount of annotated concepts (F (1, 79) = 3.99, p < .05, η² = .05), the amount of annotated processes (F (1, 79) = 5.78, p < .05, η² = .07), the overall amount of annotations (F (1, 79) = 5.19, p < .05, η² = .06), and the overall drawing quality score (F (1, 79) = 4.63, p < .05, η² = .06).All other UNIANCOVA’s showed insignificant results (see Table 3.2).
TABLE 3.2
Individual scores of the dependent variables for the different working preferences
Negative working preference Positive working preference
-Knowledge acquisition n M SD n M SD
First to second Cued Recall 40 5.67 2.53 42 5.74 2.88 Second to third Cued Recall 40 -.75 1.74 42 -.38 1.34 Third to fourth Cued Recall 40 1.18 1.66 42 1.29 1.77 First to fourth Cued Recall 40 6.10 2.60 42 6.64 2.46 Second to fourth Cued Recall 40 .42 1.53 42 .90 1.96 Concepts Open Recall 40 -.45 3.13 42 .93 2.61 Processes Open Recall 40 -.22 2.09 42 -.02 2.03 Properties Open Recall 40 .22 0.77 42 .07 .59 Open Recall total 40 -.45 5.12 42 .98 4.09
-Drawing
Concepts 40 9.20* 2.26* 42 10.38* .80* Processes 40 2.65 2.11 42 3.10 1.76 Properties 40 .15 .36 42 .10 .30 Representations total 40 12.00 4.11 42 13.57 2.06 Annotated concepts 40 6.60* 2.55* 42 7.86* 2.28* Annotated processes 40 .00* .00* 42 .14* .47* Annotated properties 40 .05 .22 42 .05 .22 Annotations total 40 6.65* 2.65* 42 8.05* 2.33* Drawing total 40 18.65* 6.27* 42 21.62* 3.13*
Note. * p < .05
3.2 Process analyses for the individual students
26
covariance were conducted to specify the differences. First condition (scripted vs. non-scripted) wasthe independent variable interchanged by working preference (negative vs. positive), and discourse quality was the dependent variable.
3.2.1 Scripting influences on the discourse quality
One-way ANOVA’s (see section 3.1.1) reveal conditional differences for students from different schools (school/class) and age. Consequently, school/class and age are used as covariates. No significant conditional differences are found for prior knowledge and ability.
First all scores on the different subcategories of drawing quality (as listed in Table 3.3) were included in the analyses. A MANCOVA shows that there is a statistically significant difference between conditions on the dependent variables, F (20, 61) = 2.63, p < .005, Wilks Lambda = .54, η² = .46. A second MANCOVA examined the combined total scores regarding discourse quality (as listed in Table 3.3). There is a statistically significant difference between the two conditions on the combined variables, F (9, 72) = 2.73, p < .001, Wilks Lambda = .75, η² = .26.
In addition, univarate ANCOVA’s were performed for each independent variable to identify the exact differences between the conditions. There is a significant difference between the conditions on the total amount of talking by the students (F (1, 80) = 1-.89, p < .01, η² = .12), on concept definition in the epistemic dimension F (1, 80) = 11.45, p < .01, η² = .13), on process definition in the epistemic dimension (F (1, 80) = 9.17, p = .01, η² = .10), and on coordination-related talk in the epistemic dimension (F (1, 80) = 4.59, p < .05, η² = .05). The other UNIANCOVA’s show insignificant results (see Table 3.3).
3.2.2 Grouping influences on the discourse quality
By means of previously reported one-way ANOVA’s, ability was indicated as covariate. From this instant collaboration expectations (F (2, 81) = 44,22, p < .001, η² = .52) and the satisfaction with the partner as indicated beforehand (F (2, 80) = 44,74, p < .001, η² = .53) are also included as covariates in the analyses since significant differences between working preferences were found regarding these variables.
27
TABLE 3.3Individual scores of the dependent variables for the scripted and the non-scripted condition Scripted condition Non-scripted condition
-General discourse n M SD n M SD
Total amount of talk 38 134.50** 50.56** 46 183.04** 59.40**
-Epistemic
Concept Naming 38 .26 .10 46 .23 .08 Concept Definition 38 .00** .01** 46 .01** .01** Process Definition 38 .00** .01** 46 .01** .01** Concept-Process conn. 38 .01 .03 46 .03 .03 Off-task talk 38 .28 .13 46 .26 .12 Coordination 38 .30* .10* 46 .37* .13* Concept/Process talk total 38 .28 .12 46 .27 .10
-Social mode
Externalization 38 .38 .09 46 .40 .10
Elicitation 38 .10 .05 46 .11 .05
Agreeing 38 .06 .04 46 .07 .05
Disagreeing 38 .02 .02 46 .02 .01
Integration 38 .01 .01 46 .01 .01
Critiques/Modifications 38 .05 .03 46 .05 .05 Conflicted Off-task 38 .00 .01 46 .00 .00 Non-conflicted Off-task 38 .27 .13 46 .25 .12 Informative talk total 38 .48 .11 46 .51 .11 Quick Consensus Building total 38 .07 .04 46 .04 .05 Transactivity total 38 .06 .04 46 .06 .04 Off-task talk total 38 .28 .13 46 .26 .12
Note. * p < .05; ** p < .01
3.3 Process analyses for the dyads
28
3.3.1 Scripting influences on discourse quality, distribution and drawing qualityOne-way ANOVA’s showed conditional differences for school/class, F (1, 40) = 14.48, p < .001, η² = .27. Therefore, school/class is included as a covariate in upcoming analyses. No other significant conditional differences are found.
The first MANCOVA focused on the percentagewise sub-categorical scores of the dyads regarding the epistemic and social mode dimensions of discourse and regarding drawing quality (as indicated in Table 3.4). There is a statistically significant difference for condition, F (21, 19) = 2.27, p < .05, Wilks Lambda = .29, η² = .72. The second MANCOVA examined the differences in condition on the combined total scores regarding the epistemic and social mode dimensions of discourse and regarding drawing quality for the dyads (as indicated in Table 3.4). There is no significant difference between the conditions, F (10, 30) = 1.59, p = .16, Wilks Lambda = .65, η² = .35.
A third MANCOVA focused on the participation distribution scores of discourse (as indicated in Table 3.4). There is no statistically significant difference between conditions, F (15, 25) = .66, p = 80, Wilks Lambda = .72, η² = .28.
[image:28.595.75.524.587.769.2]Additionally, univarate ANCOVA’s were performed for each independent variable to identify the exact differences between the conditions on discourse quality and participation distribution as assessed in the epistemic and social mode dimensions. Significant differences between both conditions are found on students’ use of concept definition on the epistemic dimension (F (1, 39) = 7.46, p < .01, η² = .16), the use of process definition on the epistemic dimension (F (1, 39) = 75.73 p < .05, η² = .13), the total amount of talking (F (1, 39) = 5.16, p < .05, η² = .12), and the distribution in integration-talk on the social mode dimension (F (1, 39) = 5.22, p < .05, η² = .12). Examining differences between condition was continued regarding the drawing quality. A significant difference is found between conditions regarding the amount of properties represented in the drawing (F (1, 39) = 7.36, p < .05, η² = .16). All other UNIANCOVA’s showed insignificant results (see Table 3.4).
TABLE 3.4
Dyadic scores of the dependent variables for the scripted and the non-scripted condition Scripted condition Non-scripted condition
-General discourse n M SD n M SD
Amount of talk total 19 266.89* 95.74* 23 386.87* 130.28* Distribution of talk 19 82.05 17.44 23 85.70 10.89
-Epistemic
29
TABLE 3.4 (Continued)Dyadic scores of the dependent variables for the scripted and the non-scripted condition Scripted condition Non-scripted condition
-Epistemic n M SD n M SD
Concept/Process talk total 19 .29 .11 23 .27 .10 Distribution Concept Naming 19 79.42 18.82 23 81.35 15.81 Distribution Concept Definition 19 73.68 42.06 23 66.09 36.63 Distribution Process Definition 19 59.63 49.18 23 73.96 40.01 Distribution Concept-Process conn. 19 61.68 39.51 23 62.09 32.60 Distribution Off-task talk 19 73.89 26.82 23 76.48 13.52 Distribution Coordination 19 78.89 16.96 23 85.43 10.54
-Social mode
Externalization 19 .38 .08 23 .40 .09
Elicitation 19 .10 .03 23 .11 .04
Agreeing 19 .05 .03 23 .07 .04
Disagreeing 19 .01 .01 23 .02 .01
Integration 19 .01 .01 23 .01 .01
Critiques/Modifications 19 .05 .03 23 .05 .03 Conflicted Off-task 19 .00 .01 23 .00 .00 Non-conflicted Off-task 19 .28 .12 23 .25 .12 Informative talk total 19 .48 .11 23 .51 .10 Quick consensus building total 19 .07 .03 23 .09 .04 Transactivity total 19 .06 .03 23 .06 .03 Off-task talk total 19 .28 .12 23 .26 .12 Distribution Externalization 19 72.79 22.41 23 77.74 18.19 Distribution Elicitation 19 66.95 25.56 23 67.70 18.62 Distribution Agreeing 19 59.16 22.76 23 65.61 23.74 Distribution Disagreeing 19 45.16 42.80 23 48.96 38.83 Distribution Integration 19 65.42* 32,68* 23 41.61* 29.00* Distribution Critiques/Modifications 19 49.11 29.44 23 55.78 31.94 Distribution Conflicted Off-task 19 84.21 37.46 23 84.78 35.15 Distribution Non-conflicted Off-task 19 73.79 26.90 23 76.78 14.32
- Drawing quality
Concepts 19 9.42 2.20 23 9.83 1.70
Processes 19 2.95 2.06 23 2.91 2.02
Properties 19 .00* .00* 23 .26* .45*
Representations total 19 12.37 3.83 23 13.00 3.53
Annotated concepts 19 6.53 2.55 23 7.26 2.68
Annotated processes 19 .00 .00 23 .13 .46 Annotated properties 19 .00 .00 23 .09 .29
Annotations total 19 6.53 2.55 23 7.48 2.83
Drawing total 19 18.89 5.68 23 20.48 5.74
[image:29.595.71.522.95.738.2]30
3.3.2 Grouping influences on the discourse quality, discourse distribution and drawingquality
One-way ANOVA’s show no significant conditional differences for school/class. A first MANOVA focused on the percentagewise sub-categorical scores of the dyads regarding the epistemic and social mode dimensions of discourse and regarding drawing quality (as indicated in Table 3.5). A second MANOVA examined the differences in working preferences on the combined total scores regarding the epistemic and social mode dimensions of discourse and regarding drawing quality for the dyads (as indicated in Table 3.5). Both analyses reveal no significant differences between the working preferences; resp. F (22, 16) = .89, p = .61, Wilks Lambda = .45, η² = .55, and F (11, 27) = .80,
p = .64, Wilks Lambda = .76, η² = .25.
A third MANOVA focused on the participation distribution scores of discourse (as indicated in Table 3.5). There is no statistically significant difference between preferences, F (15, 23) = 1.15, p = .37, Wilks Lambda = .57, η² = .43.
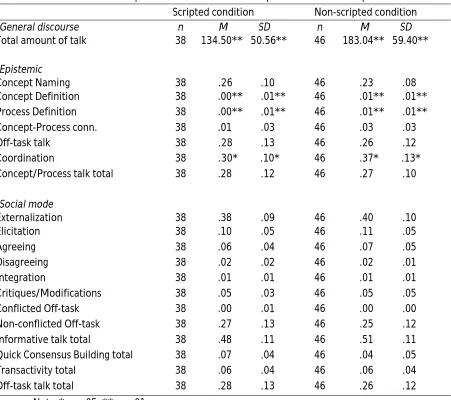
[image:30.595.75.526.517.765.2]Additionally, univarate ANCOVA’s were performed for each independent variable to identify the exact differences between the working preferences on discourse quality and participation distribution as assessed in the epistemic and social mode dimensions. Significant differences between both the working preferences are found on the distribution of off-task talk on the epistemic dimension (F (1, 37) = 4.64, p < .05, η² = .11), and for the distribution of non-conflicted off-task talk on the social mode dimension (F (1, 37) = 4.83, p < .05, η² = .12). Examining differences between working preference was continued regarding the drawing quality. However, all other UNIANCOVA’s show insignificant results (see Table 3.5).
TABLE 3.5
Dyadic scores of the dependent variables for the two working preferences
Negative working preference Positive working preference
-General discourse n M SD n M SD
Amount of talk total 20 288.75 106.13 19 344.53 143.13 Distribution of talk 20 79.40 18.23 19 88.26 7.14
-Epistemic
31
TABLE 3.5 (Continued)Dyadic scores of the dependent variables for the two working preferences
Negative working preference Positive working preference
-Epistemic n M SD n M SD
Distribution Concept-Process conn. 20 55.30 42.13 19 69.58 29.16 Distribution Off-task talk 20 69.30* 24.82* 19 82.89* 12.14* Distribution Coordination 20 80.85 16.98 19 84.84 11.01
-Social mode
Externalization 20 .38 .09 19 .41 .08 Elicitation 20 .10 .04 19 .10 .04 Agreeing 20 .05 .03 19 .07 .03
Disagreeing 20 .02 .01 19 .01 .01
Integration 20 .01 .01 19 .02 .01 Critiques/Modifications 20 .05 .03 19 .05 .03 Conflicted Off-task 20 .00 .01 19 .00 .00 Non-conflicted Off-task 20 .29* .15* 19 .24* .09* Informative talk total 20 .48 .11 19 .51 .09 Quick Consensus Building total 20 .07 .03 19 .09 .04 Transactivity total 20 .06 .03 19 .06 .04 Off-task talk total 20 .29 .14 19 .24 .09 Distribution Externalization 20 71.40 23.36 19 80.26 14.87 Distribution Elicitation 20 68.10 21.25 19 65.26 23.99 Distribution Agreeing 20 61.95 19.83 19 65.63 27.05 Distribution Disagreeing 20 54.25 36.15 19 46.74 43.90 Distribution Integration 20 58.60 36.93 19 45.84 29.59 Distribution Critiques/Modifications 20 51.10 32.99 19 51.58 30.11 Distribution Conflicted Off-task 20 85.00 36.64 19 84.21 37.46 Distribution Non-conflicted Off-task 20 69.15 25.03 19 83.21 12.62
-Drawing quality
Concepts 20 9.20 2.29 19 10.32 .82
Processes 20 2.65 2.13 19 3.21 1.81
Properties 20 .15 .37 19 .11 .32
Representations total 20 12.00 4.17 19 13.63 2.17 Annotated concepts 20 6.60 2.58 19 7.58 2.24 Annotated processes 20 .00 .00 19 .16 .50 Annotated properties 20 .05 .22 19 .05 .23 Annotations total 20 6.65 2.68 19 7.79 2.32 Drawing total 20 18.65 6.35 19 21.42 3.24
Note. * p < .05
3.4
Interactions between the conditions and the working preferences
[image:31.595.74.523.87.693.2]32
working preference and conditions as the independent variables. Subsequently, one-waybetween-groups analyses of covariance were performed to specify the interactions. The covariates used in these analyses resembled the ones used in foregoing analyses; age, school/class, ability, collaboration expectations and satisfaction with the partner beforehand in the analyses for the individual students, and class/school for the dyadic analyses.
3.4.1 Interactions on the discourse quality, drawing quality and knowledge acquisition for the individual students
To examine the interactions between condition and working preference for the individual students, a MANCOVA was conducted with the individual data on discourse quality, drawing quality and knowledge acquisition as dependent variables. A statistically significant interaction, F (28, 38) = 1.95,
p < .05, Wilks Lambda = .41, η² = .59, is found.
In addition, the nature of the interactions were identified. They manifest themselves in the knowledge acquisition regarding concepts on the open recall tests (F (1, 69) = 4.35, p < .05, η² = .06), in the score on the concepts in the joint drawing (F (1, 69) = 7.00, p < .05, η² = .09), on the amount of off-task talk on the epistemic dimension (F (1, 69) = 12.95, p < .01, η² = .17), on the use of coordination-related talk on the epistemic dimension (F (1, 65) = 16.81, p < .001, η² = .21), on the use of externalization on the social mode dimension (F (1, 65) = 7.96, p < .01, η² = .11), on the use of disagreement on the social mode dimension (F (1, 69) = 7.90, p < .01, η² = .11), on the use of non-conflicted off-task talk on the social mode dimension (F (1, 69) = 13.21, p < .01, η² = .17),on the use of informative talk (combined variable of externalizations and elicitation) on the social mode dimension (F (1, 65) = 11.65, p < .01, η² = .15), on the amount of quick consensus building (combined variable of agreeing and disagreeing) on the social mode dimension (F (1, 65) = 6.21, p < .05, η² = .09), on the total amount of off-task talk (combined variable of conflicted and non-conflicted off-task talk) on the social mode dimension (F (1, 65) = 13.02, p < .01, η² = .17). The other UNIANOVA’s show insignificant results (see Table 3.1-3.3 for the descriptive statistics).
33
FIGURE 3.2Graphs on the estimated marginal means (vertical axes) to examine the interactions
Negative working pref. Positive working pref. -0,5 0 0,5 1 1,5 2 Non-scripted Scripted
Concepts Open Recall
Negative working pref. Positive working pref. 8,5 9 9,5 10 10,5 11 Non-scripted Scripted
Concepts joined drawing
Postive working pref. Negative working pref. 0,15 0,2 0,25 0,3 0,35 0,4 Non-scripted Scripted
Off-task talk (epistemic)
Negative working pref. Positive working pref. 0,2 0,25 0,3 0,35 0,4 0,45 Non-scripted Scripted
Coordination-related talk
Negative working pref. Positive working pref. 0,325 0,35 0,375 0,4 0,425 0,45 Non-scripted ScriptedExternalizations
Positive working pref. Negative working pref. 0 0,005 0,01 0,015 0,02 0,025 Non-scripted ScriptedDisagreement
Positive working pref. Negative working pref. 0 0,1 0,2 0,3 0,4 0,5 Non-scripted ScriptedNon-conflicted off-task talk
[image:33.595.86.500.122.652.2]34
FIGURE 3.2 (Continued)Graphs on the estimated marginal means (vertical axes) to examine the interactions
3.4.2 Interactions on the discourse quality, drawing quality and discourse participation for the dyads
To examine the interactions for the dyads between condition and working preference, a MANCOVA was conducted with discourse quality, drawing quality and discourse participation as dependent variables. There is no statistically significant interaction between condition and working preference, F
(34, 1) = 3.07, p = .43, Wilks Lambda = .01, η² = .99.
In addition, the nature of the interactions were identified. They manifest themselves in the use of off-task talk on the epistemic dimension (F (1, 34) = 5.25, p < .05, η² = .13), on the coordination-related talk on the epistemic dimension (F (1, 34) = 9.16, p < .01, η² = .21), on the use of externalizations in discourse (F (1, 34) = 4.88, p < .05, η² = .13), on the amount of disagreement in discourse (F (1, 34) = 4.50, p < .05, η² = .12), the amount of non-conflicted off-task talk in discourse (F (1, 34) = 5.42, p < .05, η² = .14), on the use of informative talk (combined variable of externalizations and elicitation) in discourse (F (1, 34) = 6.56, p < .05, η² = .16), and on the total amount of off-task talk (combined variable of conflicted and non-conflicted off-task