Abstract— As more and more data is becoming available due to advances in information and communication technologies, gaining knowledge and insights from this data is replacing experience and intuition based decision making in organizations. Big data mining can be defined as the capability of extracting useful information from massive and complex datasets or data streams. In this paper, one of the commonly used data mining algorithm, K-means, is used to extract information from a big dataset. Doing so, MapReduce framework with Hadoop is used. As the dataset, the results of the social evolution experiment of MIT Human Dynamics Lab are used. The aim is to derive meaningful relationships between students’ eating habits and the tendency of getting cold.
Index Terms— Big data, data mining, clustering, K-means algorithm.
I. INTRODUCTION
The advancement of technology, the further development of Internet and recent social media revolution has accelerated the speed, and the volume of the produced data. Companies and businesses have started to collect more data than they know what to do with. Hence, Big Data is still in the process of rapidly expanding in different application areas and it began to dominate future technologies. Big data can be defined as volume, high-velocity and high-variety information assets that demand cost-effective, innovative forms of information processing for enhanced insight and decision making. This type of huge volume of data of course brings several challenges. Several challenges include analysis, retrieval, search, storage, sharing, visualization, transfer and security of data. Each one of these challenges constitutes a wide research area.
Data generation capacity has never been so big: Every day 2.5 trillion bytes of data are generated and 90% of produced data in the world so far were produced in the last two years [1]. However, the data are not in a meaningful form; they are in the raw form. It is necessary to process them to explore patterns, hence transforming them to meaningful information [2]. If they are used in an accurate manner, Big Data have the ability to give results on these massive data piles, which shed light to future technologies.
Doing so, data mining methodologies play an important role to explore data.
Data mining is defined as the science of extracting useful information from large datasets or databases. This area combines several disciplines such as statistics, machine
Beste Eren, Galatasaray University, Industrial Engineering
Ezgi Çılga Karabulut, Galatasaray University, Computer Engineering,
S. Emre Alptekin, Galatasaray University, Industrial Engineering,
Gülfem Isiklar Alptekin (corresponding author), Galatasaray University, Computer Engineering, [email protected]
learning, artificial intelligence, pattern recognition, and data management [3]. The idea is to build computer programs that examine the databases automatically, search for rules or patterns in order to make accurate predictions about future data. Since actual data are usually imperfect, it is expected that there will be problems, exceptions to each rule. Therefore, the algorithms must be robust enough to adapt to the imperfect data and extract regularities that are inaccurate, but useful [2]. One of the most important problem sources in Big Data and data mining is still the heterogeneity of data structure and data resources when gathering data [4]. This is why understanding and examination of these structural features of Big Data have impact on the effectiveness and efficiency of data mining.
In this paper, the aim is to analyze and get meaningful results from the Big Data by using one of the most known data mining algorithms: k-Means. As data, we have utilized
datasets called "Reality Commons". They are the mobile
datasets containing the dynamics of several communities of about 100 people each. They are collected with tools developed in the MIT Human Dynamics Lab, which are available as open source. They invite researchers to propose and submit their own applications of the data to demonstrate the scientific and business values of these datasets, suggest how to meaningfully extend these experiments to larger populations, and develop the math that fits agent-based models or systems dynamics models to larger populations.
The paper is structured as follows: Section 2 describes the K-means algorithm that is used to explore data. The utilized software technologies are presented in Section 3, while Section 4 presents the dataset used in the application along with its preparation. Section 5 reveals the results and the concluding remarks of the application. Future works and the conclusion are given in Section 6.
II. K-MEANSALGORITHM
K-means is one of the unsupervised learning and clustering algorithms [5]. This algorithm classifies a given dataset by finding a certain number of clusters (K). The
clusters are differentiated by their centers. The best choice is to place them as much as possible far away from each other. The algorithm is highly sensitive to initial placement of the cluster centers. A disadvantage of K-means algorithm is that it can only detect compact, hyperspherical clusters that are well separated [6]. Another disadvantage is that due to its gradient descent nature, it often converges to a local minimum of the criterion function [7]. The algorithm is composed of the following steps:
i. Initial value of centroids:Deciding K points randomly
into the space which represent the clustered objects. These K
points constitute the group of initial centroids.
ii. Objects-centroid distance: Calculating the distance of
each object to each centroid, and assigning them to the closest cluster that is determined by a minimum distance measure. (A simple distance measure that is commonly used
A K-Means Algorithm Application on Big Data
is Euclidean distance.)
iii Determine centroids:After all objects are assigned to
a cluster, recalculating the positions of the K centroids. vi. Object-centroid distance: Calculating the distances of
each object to the new centroids and generating a distance matrix.
The whole process is carried out iteratively until the centroid values become constant.
III. THE STRUCTURE OF BIG DATA AND UTILIZED SOFTWARE In order to address the problem of partitioning (a.k.a. clustering), several researchers propose parallel partitioning algorithms and/or parallel programming [8]. Currently, Big Data exploration are generated mainly using parallel programming models such as MapReduce, providing with a cloud computing platform. MapReduce has been popularized by Google, but today the MapReduce paradigm is been implemented in many open source projects, the largest being the Apache Hadoop [9].
A. Hadoop Environment and Hadoop Architecture
Apache Hadoop is an open source software framework that supports the massive data storage and its processing. Instead of relying on expensive proprietary hardware to store and process data, Hadoop enables distributed processing of large amounts of data across large server partitions. Hadoop possess various advantages. First, there is no need to change the data formats as the system automatically redistributes Hadoop data. It brings massively parallel computing servers, which makes the massively parallel computing affordable for the ever increasing volume of Big Data. In addition, Hadoop is free and it can absorb any type of data from any number of sources. Hadoop can also recover data failures and the computer that causes the rupture of the node or network congestion [10].
Hadoop provides with the Hadoop Distributed File System (HDFS) which is robust and tolerant of mistakes, inspired by the file system from Google, as well as a Java API that allows parallel processing on the partition of nodes using the MapReduce. Using the code written in other languages, such as Python and C, it is possible with Hadoop Streaming, to create and run the executable works with the mapper and/ or the gearbox. In addition, Hadoop has a task tracker that keeps track of the execution of programs across the cluster nodes [11].
B. Hadoop Distributed File System (HDFS)
Hadoop Distributed File System (HDFS) is a distributed file system that provides with fault tolerance and designed to be run on commodity hardware. HDFS provides high throughput access to application data and is suitable for applications that have large datasets.
HDFS can store data on thousands of servers, and it can perform the given work (Map/Reduce jobs) through these machines. HDFS has master/slave architecture. Large data are automatically divided into pieces that are managed by different nodes of the Hadoop cluster [12]. An HDFS cluster consists of a single NameNode, a master server that manages the file system namespace and regulates access to
files by clients. In addition, there are a number of DataNodes, usually with a cluster node, which manages storage of nodes. HDFS exposes a file system namespace and allows user data to be stored in files. A file is divided into one or more blocks and these blocks are stored in a set of DataNode. NameNode determines the mapping of blocks to DataNodes [12].
C. MapReduce
MapReduce is a parallel computing model for batch processing and for generating large datasets [4]. Users specify computers in terms of a map and a reduce function. The run-time system automatically parallelizes underlying computers, manages failures of inter-computer communications equipment and programs to make efficient use of the network and discs [8].
First, a master node performs a Map function. The entered data are partitioned into smaller sub-problems and they are distributed to workers nodes [12]. The output of map function is a set of records in the form of key-value pairs. The records for any given key are collected at the running Reduce node for that key. After that all data from the Map function were transferred to the right machine, the second stage begins the Reduce progressing and produces another set of key-value pairs, collects the answers to all the sub-problems and combines them as the output [12]. Although this simple model is limited to the use of key-value pairs, many tasks and algorithms may be integrated in this software structure [11].
D. Apache Mahout
Mahout is an open-source software framework for scalable machine learning and data mining based mainly on Hadoop. It is implemented on a wide variety of machine learning and data mining algorithms such as clustering, classification, collaborative filtering and extracting frequent patterns [13].
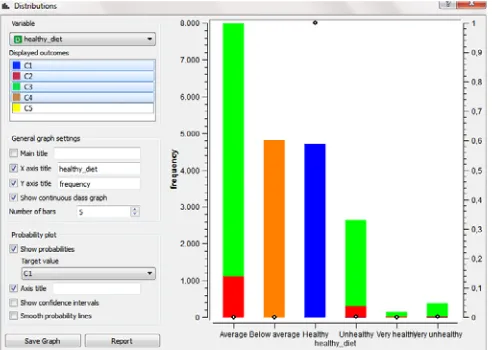
E. Orange
Fig. 1. Elements used in Orange software
IV. DATA PREPARATION
The dataset created by MIT Human Dynamics Lab is utilized [14]. The objective of gathering such a dataset was to explore the capabilities of the smart phones on investigating human interactions. The subjects were 75 students in the MIT Media Laboratory, and 25 incoming students at the MIT Sloan business school. The dataset is one of the pioneering sets studying community dynamics by tracking a sufficient amount people with their personal mobile phones.
In this paper, the Social Evolution dataset is chosen which contains data that follows the life of a student in the dormitory [14]. The data include proximity, location, and call log, collected through a cell-phone application that scans nearby Wi-Fi access points and Bluetooth devices every six minutes. Survey data includes sociometric survey for relationships (choose from friend, acquaintance, or do not know), political opinions (democratic vs. republican), recent smoking behavior, attitudes towards exercise and fitness, attitudes towards diet, attitudes towards academic performance, current confidence and anxiety level, music sharing from 1500 independent music tracks from a wide assortment of genres. Two tables are selected and data are combined with the primary key: user id. The ‘Health Table’ contains user id, current weight, current height, survey month, number of eaten salad per week, number of fruit and vegetables eaten per day, healthy diet, and aerobics per week. The other table, ‘Disease Symptoms’ includes user id, cough and sore throat, discharge, nasal congestion and sneezing, fever, depression, open stressed. Most of these attributes are binary defined.
V. RESULTS
The k-means function of Orange is utilized and the data is clustered. The clusters established with Orange software are depicted in Figure 2. Two attributes are selected for analyzing the relationships between them: ‘healthy diet’ and ‘cough and sore throat’. Several results that are obtained can be given as: The persons which have not any cough and sore throat (the value of cough and sore throat=0) are usually in good health. According to the point clouds graph (Fig. 3), the total population of the group with ‘good health’ and with
‘very good health’ and without ‘cough and sore throat’ is 23. Furthermore, the total population of the group with ‘good health’ and with ‘very good health’ and with a little bit of cough and sore throat is 15. Hence, we can conclude that the persons with healthy diet and very healthy diet have tendency to have less cough and sore throat.
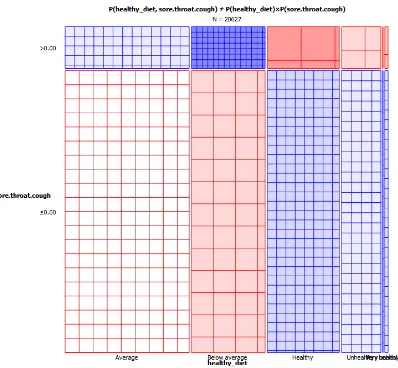
The sieve diagram (Fig. 4) is a graphical method for visualizing the frequencies in a two-way contingency table and comparing them to the expected frequencies under assumption of independence. In Fig. 4, the correlation between ‘healthy diet’ and ‘cough and sore throat’ is shown. The observed frequency in each cell is represented with the number of squares drawn in the related rectangle. The difference between the observed frequency and the expected frequency is the density of shading. The color blue indicates the derivation from independence is positive, and the color red indicates that it is negative. The frequency of the group with ‘average diet’ with the value ‘cough and sore throat’ less or equal to 0 is higher than the frequency of the group with ‘below average diet’. This means that the persons with ‘average diet’ have the tendency to not have any ‘cough and sore throat’. In Table I, the observed value of the number of examples (probability) is 33.49% for ‘average diet’ and ‘cough and sore throat’≤0; but the observed probability is 19.40% when ‘cough and sore throat’≤ 0 and with ‘below average diet’.
[image:3.595.305.551.593.768.2]Fig. 3. Point clouds representation of relationships
[image:4.595.97.495.362.730.2]Table I. Comparison of the frequencies of ‘diet below average’ and ‘average diet’ when ‘cough and sore throat’≤ 0 X Attribute: healthy diet X Attribute: healthy diet
Value: Average Value: Below average Number of examples (p(x)): 7975 (38.66%) Number of examples (p(x)): 4804 (23.29%)
Y Attribute: sore.throat.cough Y Attribute: sore.throat.cough
Value: ≤ 0.00 Value: ≤ 0.00
Number of examples (p(y)): 17868 (86.62%) Number of examples (p(y)): 17868 (86.62%) Number of examples (Probabilities): Number of examples (Probabilities): Expected (p(x)p(y)): 6908.3 (33.49%) Expected (p(x)p(y)): 4161.4 (20.17%) Actual (p(x)p(y)): 6853 (33.22%) Actual (p(x)p(y)): 4001 (19.40%)
Statistics: Statistics: Chi-square: 109.33 Chi-square: 109.33 Standardized Pearson residual:-0.67 Standardized Pearson residual:-2.49
VI. CONCLUSION
In this study, one of the clustering algorithms (K-means) is applied to extract meaningful rules from Big Data. As data, the mobile datasets containing the dynamics of several communities collected by the MIT Human Dynamics Lab is used. The aim of our work is to demonstrate how Hadoop and MapReduce can be used to get insights from data that are not readily available. We have selected Hadoop platform as it is an open-source project written in Java for distributed storage and distributed processing of very large data sets on computer clusters. It is highly scalable and flexible in terms of storage and accessing new data sources, more cost effective compared to a traditional database management system, fast and more fault tolerant in an event of failure. Hadoop’s fault tolerant structure also constitutes one of its weakest points. It ensures its efficiency by data locality, hence it necessitates several copies of data. Its limited SQL support, lack of query optimizer, and inconsistently implemented data mining libraries can be considered in the weaknesses of Hadoop.
On the other hand the Orange platform, which has Python scripting interface, is an open-source general-purpose data visualization and analysis software. Orange is intended both for experienced users and programmers, as well as students of data mining. As the dataset in question was clean, we have been able to fully work in Orange, with its pre-defined classes and functions.
Further research may include writing our own data mining algorithm code, and compare the results of different algorithms, select the most accurate one for given dataset and use different distance measurement techniques for clustering the data.
ACKNOWLEDGMENT
This research has been financially supported by Galatasaray University Research Fund, with the project number 15.402.005.
REFERENCES
[1] IBM, 2012, What Is Big Data: Bring Big Data to the Enterprise. http://www-01.ibm.com/software/data/bigdata/what-is-big-data.html. [2] Witten, I.H., Frank, E., 2011, Data Mining: Practical Machine
Learning Tools And Techniques, Third Edition. San Fransisco: Elsevier Inc.
[3] Hand D., Mannila H. & Smyth P., 2001, Principles of Data Mining. Cambridge: The MIT Press.
[4] Xu X., Zhu X., Wu G., & Ding W., 2014, “Data Mining with Big Data”, IEEE Transactions On Knowledge And Data Engineering, 26 (1), 97-107.
[5] Jain, A.K., Murty, M.N., Flynn, P.J., 1999, “Data Clustering: A Review”, ACM Computing Surveys, 31(3), 264-323.
[6] Çelebi, M.E., Kingravi, H.A., Vela, P.A., 2013, “A comparative study of efficient initialization methods for the k-means clustering algorithm”, Expert Systems with Applications,40, 200-210. [7] Selim, S.Z., Ismail, M.A., 1984, “K-means-type algorithms: A
generalized convergence theorem and characterization of local optimality”, IEEE Transactions on Pattern Analysis and Machine Intelligence, 6(1), 81-87.
[8] Zhao, W., Ma, H. & He Q., 2009, Parallel K-Means Clustering Based on MapReduce, First International Conference, CloudCom, Beijing, 674-679.
[9] Grolinger, K., Hayes, M., Higashino W.A., L'Heureux A., Allison D.S. & Capretz M.A.M., 2014, Challenges for MapReduce in Big Data. IEEE 10th World Congress on Services, Alaska, IEEE. [10] Hu, H., Wen, Y., Chua, T., & Li, X., 2014. “Toward Scalable Systems
for Big Data Analytics: A Technology Tutorial”. Access, IEEE, 2, 652-687.
[11] Taylor, R.C., 2010, An Overview Of The Hadoop/Mapreduce/Hbase Framework And Its Current Applications In Bioinformatics, Washington: BioMed Central Ltd.
[12] Patel, A. B., Birla, M. & Nair, U., 2012, Addressing Big Data Problem Using Hadoop and Map Reduce, 2012 Nirma Universıty International Conference On Engineering, Ahmedabat.
[13] Fan, W., Bifet, A., 2012, “Mining Big Data: Current Status, and Forecast to the Future”, SIGKDD Explorations. 14(2), 1-5.