warwick.ac.uk/lib-publications
Original citation:
Sahota, Amandip S., Gowda, Ravi, Arasaradnam, Ramesh P., Daulton, Emma, Savage, Richard
S., Skinner, Jim R., Adams, Emily, Ward, Stephen A. and Covington, James A.. (2016) A simple
breath test for tuberculosis using ion mobility : a pilot study. Tuberculosis, 99 . pp. 143-146.
Permanent WRAP URL:
http://wrap.warwick.ac.uk/80115
Copyright and reuse:
The Warwick Research Archive Portal (WRAP) makes this work of researchers of the
University of Warwick available open access under the following conditions.
This article is made available under the Creative Commons Attribution 4.0 International
license (CC BY 4.0) and may be reused according to the conditions of the license. For more
details see:
http://creativecommons.org/licenses/by/4.0/
A note on versions:
The version presented in WRAP is the published version, or, version of record, and may be
cited as it appears here.
A simple breath test for tuberculosis using ion mobility: A pilot study
Amandip S. Sahota
a, Ravi Gowda
b, Ramesh P. Arasaradnam
c, Emma Daulton
d,
Richard S. Savage
e, Jim R. Skinner
f, Emily Adams
g, Stephen A. Ward
g,
James A. Covington
d,*aDept. of Infection and Tropical Medicine, University Hospitals of Leicester NHS Trust, Infirmary Square, Leicester, LE1 5WW, UK bDepartment of Infectious Diseases, University Hospitals Coventry and Warwickshire NHS Trust, Coventry, CV2 2DX, UK
cDept. of Gastroenterology, University Hospital Coventry and Warwickshire, and Clinical Sciences Research Institute, University of Warwick, Coventry, CV2
2DX, UK
dSchool of Engineering, University of Warwick, Coventry, UK
eSystems Biology Centre/Medical School, University of Warwick, CV4 7AL, UK fCentre for Complexity Science, University of Warwick, CV4 7AL, UK gLiverpool School of Tropical Medicine, Pembroke Place, Liverpool, L3 5QA, UK
a r t i c l e i n f o
Article history:
Received 18 March 2016 Received in revised form 18 May 2016
Accepted 22 May 2016
s u m m a r y
Tuberculosis (TB) remains one of the world's major health burdens with 9.6 million new infections globally. Though considerable progress has been made in reduction of TB incidence and mortality, there is a continuous need for lower cost, simpler and more robust means of diagnosis. One method that may fulfil these requirements is in the area of breath analysis. In this study we analysed the breath of 21 patients with pulmonary or extra-pulmonary TB, recruited from a UK teaching hospital (University Hospital Coventry and Warwickshire) before or within 1 week of commencing treatment for TB. TB diagnosis was confirmed by reference tests (mycobacterial culture), histology or radiology. 19 controls were recruited to calculate specificity; these patients were all interferon-gamma release assay negative (T.SPOT®.TB, Oxford Immunotec Ltd.). Whole breath samples were collected with subsequent chemical analysis undertaken by Ion Mobility Spectrometry. Our results produced a sensitivity of 81% and a specificity of 79% for all cases of TB (pulmonary and extra-pulmonary). Though lower than other studies analysing pulmonary TB alone, we believe that this technique shows promise, and a higher sensitivity could be achieved by further improving our sample capture methodology.
©2016 The Authors. Published by Elsevier Ltd. This is an open access article under the CC BY license (http://creativecommons.org/licenses/by/4.0/).
1. Introduction
Major advances have been made in TB diagnosis, treatment and mortality since the turn of the century, and the Millennium Development Goal to halt and reverse TB incidence by 2015 has partially been met. Despite this, in 2014 there were still an esti-mated 9.6 million new TB cases, with 1.5 million deaths[1]. Whilst the majority of those affected are from low- and middle-income countries, the significant burden of co-infection with TB and HIV
(Human Immunodeficiency Virus), multi-drug resistance, along-side widespread migration, has resulted in TB remaining a global health concern. A new ambition to end the TB epidemic by 2030 has been set as part of the post-2015 global TB strategy[1]. To achieve this Sustainable Development Goal, the vision of the World Health Organisation (WHO) is for everyone to have access to innovative tools and services required for rapid diagnosis, treatment and care. In line with this, breath analysis for TB diagnosis (within minutes) as opposed to standard microbiological culture, which can take up to 2 months, is attractive.
Breath analysis utilises the detection of volatile organic com-pounds (VOCs), gaseous chemicals that are the endogenous prod-ucts of metabolism of individual microbes and whole organ systems. It has many advantages for diagnosticseit is rapid, non-invasive, acceptable to patients, and sample volumes are both un-limited and can be given at will[2]. Importantly, analysis of breath is thought to allow access to chemical processes not only in the *Corresponding author.
E-mail addresses: [email protected] (A.S. Sahota), ravi.gowda@ ravigowdahealth.com (R. Gowda), [email protected]
(R.P. Arasaradnam),[email protected] (E. Daulton),R.S.Savage@warwick. ac.uk (R.S. Savage), [email protected] (J.R. Skinner), Emily.Adams@ lstmed.ac.uk (E. Adams), [email protected] (S.A. Ward), J.A.Covington@ warwick.ac.uk(J.A. Covington).
Contents lists available atScienceDirect
Tuberculosis
j o u r n a l h o m e p a g e :h t t p : / / i n t l . e l s e v i e r h e a lt h . co m / jo u rn a ls /t u b e
http://dx.doi.org/10.1016/j.tube.2016.05.005
lung, but also in other organ systems. Detected VOCs may be pro-duced directly in the lung, or reach lung tissue via blood through the internal metabolic pathways of respiration. This allows a wholesale comparison of chemical differences in health and a number of diseased states, including infection and malignancy.
For this reason, many researchers have undertaken chemical analysis of breath by various analytical means, with GCMS (Gas Chromatography Mass Spectrometry) being the most popular. The body of literature on GCMS has identified the key gas-phase bio-markers and supports the hypothesis for breath as a potential tool for TB diagnosis[3,4]. However, GCMS is a laboratory-based tech-nique, with equipment being bulky, having a high unit cost, and requiring trained staff and considerable infrastructure. Therefore others have looked into alternative gas analysis techniques with varying success. The electronic nose,first proposed in the 1980s, does not attempt to identify specific chemicals in a sample (as with GCMS), but instead analyses a sample as a whole (like the biological nose) using an array of non-selective gas sensors and a pattern recognition algorithm[5]. The technique can give an immediate result, uses air as the carrier gas, and can be made portable, simple to use, and at a unit-cost which is appropriate to the medical pro-fession. To this end, there have been a number of published studies using different electronic nose instruments for the detection of TB biomarkers in both breath and sputum[6e8]. Though the studies show promise, these instruments have limitations. Firstly, some are based on sensors which rely on a chemical interaction between the surface of the sensor and the complex chemical sample. The surface layers succumb to long-term drift and are affected by changes in sample humidity and temperature. This means regular re-training of equipment is required to optimise performance. In addition, sensor manufacturing is such that each instrument is different and requires every instrument to be trained. An alternative approach is to use GC separation followed by QCM (Quartz Crystal Microbal-ance) detection. This instrument circumvents the aforementioned problems, but the requirement for a continuous helium supply restricts its use in resource-limited settings.
FAIMS (Field Asymmetric Ion Mobility Spectrometry) is a tech-nique which is finding favour with researchers in the medical profession[9,10]. Like an electronic nose it does not attempt to identify specific chemicals within samples, but instead measures the mobility (or movement) of ionised molecules in high electric fields (kVolts). Pattern recognition techniques can then be applied to identify underlying trends within the mobility data, which can be correlated to the presence, or lack, of a disease process. Due to their incredibly high sensitivity (parts per billion or lower), repro-ducible results, use of air as the carrier gas, and portability, in-struments using FAIMS have found favour with the military for the detection of chemical warfare agents. As these instruments mea-sure a physical rather than chemical property of a molecule, they suffer far less from drift and instrument-to-instrument variability
[11]. In this paper we report on the use of FAIMS for the analysis of breath in patients with confirmed TB compared with healthy controls.
2. Methodology
A commercial FAIMS unit was used (Lonestar, Owlstone UK) employing an ultra-violet (UV) ionisation source. Although this does not ionise the same range of chemicals as Ni63 (a radionuclide and the most commonly used ionisation method), units with a UV source can be used in UK hospitals without a special license and are easily transported from site to site. In a FAIMS unit, the complex mixture of gases contained within the sample (in our case breath) is pushed into the instrument where it is then ionised. The ionised sample then passes between two“separator”plates, to which an
oscillating asynchronous waveform is applied (typically GHz). Onto these plates is applied a high positive potential for a short period of time, followed by a small negative potential for a longer period of time. Importantly, the applied amplitudetime are equal in both cases. When in use, the ratio of short/high potential to longer/ smaller negative potential (described as the“dispersionfield”) is cycled from 1 up to the systems maximum value. In the electricfield generated by these potentials, ions are attracted to, repelled by or remain unaffected, depending upon the mobility difference be-tween high- and low-field regime. If an ion then touches one of the plates it loses its charge, thus only ions with specific mobility exit the plates, still with their charge, and are detected. By applying a direct current (DC) voltage (called the compensation voltage) to one of the plates, it is possible to remove this attraction and repulsion, allowing more ions to be detected. This compensation voltage is cycled between a positive and negative potential and therefore for a certain compensation voltage, only chemicals with a specific mobility will be detected. The mobility of an ion depends on the mass, charge, size and shape, however as thefield and the velocity are constant and we can relate the mobility to the velocity using the equation:
v¼KE (1)
wherevandKare the velocity and mobility of ion respectively and
Eis the electricfield strength. Since velocity changes is not pro-portional to the electricfield intensity variations, at higher electric fields the ion mobility can be expressed by the following equation.
Kh¼K
"
1þ
a
NE2þb
NE4#
(2)
whereKhandKare the high-field mobility and low-field mobility respectively.
a
andb
are compound specific values which account for high-field mobility effect,Nis carrier gas density number andEis the electricfield strength. More details of this process can be found in[12,13]. Typical breath outputs using a FAIMS instrument are shown in[9].
We recruited 23 adults (aged over 18 years) with clinically suspected pulmonary or extra-pulmonary TB (by constitutional symptoms or abnormal chest X-ray) from a UK teaching hospital (University Hospital Coventry and Warwickshire) over 6 months (March to September 2014). They were recruited from rapid-access TB clinics or in-patient admissions, before or within 1 week of commencing anti-TB medication. Diagnosis was later confirmed by culture, histology or radiology in 21 cases (average age 47 (18e86), 5 smokers). 2 cases had an alternative infective diagnosis (1 bac-terial pneumonia, 1Staphylococcus aureuschronic hip osteomye-litis). 17 healthy controls were recruited for comparison, all interferon-gamma release assay negative (T.SPOT®.TB, Oxford Immunotec Ltd.). These 2 suspected TB cases with alternativefinal diagnosis were added to the healthy control group to make a total of 19 controls (average age 38 (24e63), 5 smokers). A summary of cases by site of infection and culture result is shown inTable 1. Scientific and ethical approval was obtained from the local Research&Development Department and the Warwickshire Ethics Committee (reference number: 09/H1211/38). Written informed consent was obtained from all participants.
Participants were requested to refrain from eating and drinking for 2 h before breath capture. Whole breath samples were collected, with participants breathing through a standard mouthpiece into a 3L tedlar bag repeatedly until the bag was full. Whole breath was used for simplicity, ease of capture, and to allow disposal of bags after single use for infection control purposes. Samples were ana-lysed within 2 h of collection using the Lonestar instrument A.S. Sahota et al. / Tuberculosis 99 (2016) 143e146
(Owlstone UK). In our case, this wasfitted with an ATLAS sampling system and a pump on the exhaust to pull the sample through the instrument. The bag output was connected in parallel to a splitflow box containing a massflow controller fed byfiltered air. By con-trolling the speed of the pump and setting the massflow controller to a specific flow, theflow out of the bag remained constant at 200 ml/min with theflow through the machine at 2 L/min. The Lonestar was setup with a dispersionfield cycled between 0 and 100% in 51 steps, and the compensation voltage between 6 V andþ6 V in 512 steps. This allowed two complete output cycles to be collected.
The data from these experiments were processed using a pre-viously developed algorithm described in[14]. In brief, each sample run generated 52,224 data points in a 2D matrix of dispersionfields and compensation voltages. First, a 2D wavelet transform (using Daubechies D4 wavelets) was applied to each sample run. This serves both as a data compression step, but also as a matchedfilter which can preferentially extract the diffuse ‘peaks’ in the data corresponding to different sets of chemical species. This has the effect of concentrating the signal in a relatively small number of wavelet coefficients, thus greatly simplifying and improving the subsequent analysis steps.
A threshold was then applied to the variance (across samples) of each wavelet coefficient, removing those coefficients that vary by only a very small amount (or not at all). This is known from (from prior work with FAIMS) to remove only uninformative and/or
noise-dominated coefficients. This thresholding step therefore greatly reduces the dimensionality of the data, whilst only dis-carding data which are unlikely to aid disease prediction.
A 10-fold cross-validation was then applied, using 90% of the data as a training set, and the remaining 10% as a test set. Within each fold, a supervised feature selection step was performed to identify which features in the training set are the best for disease prediction. For this, a Wilcoxon rank sum test was used for each feature in turn, selecting those with the lowest p-value (using a training set only). Two features were extracted, which we have found to be sufficient in other studies. Predictions were then pro-duced (disease/control) for the test set using just the two selected features.
Four different classifiers were used for prediction: Sparse Lo-gistic Regression, Gaussian Process Classifier, Random Forest and Support Vector Machine. Of these, the Gaussian Process Classifier generated the best classification results. The Gaussian Process classifier outputs a predicted probability of a sample being from a TB patient, from which a receiver operator curve (ROC) and per-formance data were calculated.
[image:4.595.41.296.85.192.2]3. Results and discussion
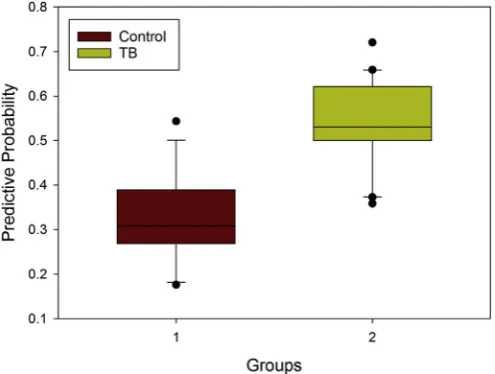
Figure 1 shows the predictive probability using a Gaussian Process Classifier, showing a difference between the two groups (TB patients and controls). It was noted that different analysis tech-niques resulted in exactly the same sensitivity and specificity of 81% and 79% respectively. Figure 2 shows the ROC using the same analytical method. This result has an area under the curve of 0.92 (confidence interval at 95%, 0.84 to 1). Interestingly, just analysing the pulmonary TB patients gives a very similar result AUC¼0.91 (0.81e1).
The sensitivity and specificity reported here are not as high as previously reported using an electronic nose (sensitivity 93.5%, specificity 85.3%)[15]. In this study, however, Bruins et al. only included those with pulmonary TB, which may serve to reduce the number of false negatives thereby increasing sensitivity. Moreover they also excluded cases with HIV; we included 3 such cases. Despite HIV-TB co-infection being a common global scenario, there is a paucity of information on breath analysis in this context and whether, as for atypical clinical presentations of TB, it may also alter breath results.
Nevertheless, using this relatively crude sampling system, the results indicate that FAIMS shows promise for TB detection. Breath Table 1
Summary of cases by site of TB infection and culture result. TB site Sample type Culture
positive
Culture negative*
Total
Pulmonary Sputum 5 0 5
Bronchoalveolar lavage
fluidy
2 2 4
Lymph node Tissue/pus 5 1 6
Spine/psoas abscess
Pus 4 0 4
Joint Fluid 1 0 1
Otherx 0 1 1
Total 21
*Histological or radiological diagnosis. y 1 patient: lung tissue.
[image:4.595.45.293.513.700.2]x 1 patient: testicular TB.
Figure 1.Classification probabilities for the control and TB groups. Applying a Wil-coxon rank-sum test to the sets of classification probabilities from the two groups, we get a p-value of 2.89*106, showing that there is a highly statistically significant
dif-ference between the control and TB groups.
[image:4.595.334.535.538.718.2]capture is limited by cross-reactivity with oro-pharyngeal micro-biota, thus potentially reducing the diagnostic yield in TB. However, we are already in the process of improving our sample capture system and we believe that improved results are achievable.
4. Conclusions
The results indicate that FAIMS, and Ion Mobility Spectrometry (IMS) in particular, has potential as a technology that can be applied to breath testing for clinical diseases including TB. We recognise that we were limited by small sample sizes, sampling of whole breath rather than end-tidal, and undertaking the study in optimal UK hospital conditions as opposed to a low- or middle-incomefield setting. It is also difficult to determine whether the chemicals being detected were directly associated with the metabolism of the TB pathogen, or the body's general response to infection. However, there is considerable potential for utilising IMS as a simple, rapid, cheap breath test for stratifying suspected TB patients. The ad-vantages of IMS in terms of sensitivity, ease of setup with minimal training and minimal instrumental drift and variability, may pro-vide a solution for targeting TB treatment in a global context. We are now looking to further study IMS technology in a more rigorous way, testing its efficacy for different breath capture techniques and in a variety of clinical circumstances.
Data statement: Due to ethical concerns, supporting data cannot be made openly available. Further information about the data and conditions for access are available at the University of Warwick institutional repository:http://wrap.warwick.ac.uk/ 79488/.
Funding: We would like to thank the Medical Research Council (Confidence in Concept grant no. MC_PC_13069), UK, for supporting this work and the Engineering and Physical Sciences Research Council for supporting Mr Skinner's PhD (grant no. EP/ IO1358X/1). We would also like to thank all patients for partici-pating in this study, and staff at UCHW for their help and expertise.
Competing interests: None Declared.
Ethical approval: Scientific and ethical approval was ob-tained from local Research&Development Department and Warwickshire Ethics Committee (ref: 09/H1211/38). Written informed consent was obtained from all patients who partici-pated in the study.
References
[1] Global tuberculosis report 2015, 20th ed. World Health Organisation.http:// apps.who.int/iris/bitstream/10665/191102/1/9789241565059_eng.pdf?ua¼1. [2] Kim K-H, Jahan SA, Kabir E. A review of breath analysis for diagnosis of human
health. TrAC Trends Anal Chem 2012;33:1e8.
[3] Kolk AHJ, Van Berkel JJBN, Claassens MM, Walters E, Kuijper S, Dallinga JW, Van Schooten FJ. Breath analysis as a potential diagnostic tool for tuberculosis. Int J Tuberc Lung Dis 2012;16(6):777e82.
[4] Phillips M, Cataneo RN, Condos R, Erickson GAR, Greenberg J, La Bombardi V, Munawar MI, Tietje O. Volatile biomarkers of pulmonary tuberculosis in the breath. Tuberculosis 2007;87(1):44e52.
[5] Persaud K, Dodd G. Analysis of discrimination mechanisms in the mammalian olfactory system using a model nose. Nature 1982:352e5.
[6] Bruins M, Rahim Z, Bos A, van de Sande WWJ, PhEndtz H, van Belkum A. Diagnosis of active tuberculosis by e-nose analysis of exhaled air. Tuberculosis 2013;93(2):232e8.
[7] Kolk A, Hoelscher M, Maboko L, Jung J, Kuijper S, Cauchi M, Bessant C, van Beers S, Dutta R, Gibson T, Reither K. Electronic-nose technology using sputum samples in diagnosis of patients with tuberculosis. J Clin Microbiol 2010;48(11):4235e8. [8] Phillips M, Basa-Dalay V, Blais J, Bothamley G, Chaturvedi A, Modi KD, Pandya M, Natividad MPR, Urkvish P, Ramraje NN, Schmitt P, Udwadia ZF. Point-of-care breath test for biomarkers of active pulmonary tuberculosis. Tuberculosis 2012;92(4):314e20.
[9] Covington JA, van der Schee MP, Edge ASL, Boyle B, Savage RS, Arasaradnam RP. The application of FAIMS gas analysis in medical diagnostics. Analyst 2015;140(20):6775e81.
[10] Bomers MK, Menke FP, Savage RS, Vandenbroucke-Grauls CMJE, van Agtmael MA, Covington JA, Smulders YM. Rapid, accurate, and on-site detection ofC. difficilein stool samples. Am J Gastroenterol 2015:588e94. [11] Zalewska A, Pawłowski W, Tomaszewsk W. Limits of detection of explosives
as determined with IMS andfield asymmetric IMS vapour detectors. Forensic Sci Int 2013;226(1):168e72.
[12] Wilks A, Hart M, Koehl A, Somerville J, Boyle B, Ruiz-Alonso D. Character-ization of a miniature, ultra-high-field, ion mobility spectrometer. Int J Ion Mobil Spectrom 2012;15:199e222.
[13] Krylov EV. Comparison of the planar and coaxialfield asymmetrical waveform ion mobility spectrometer (FAIMS). Int J Mass Spectrom 2003;225:39e51. [14] Arasaradnam RP, Westenbrink E, McFarlane MJ, Harbord R, Chambers S,
O'Connell N, Bailey C, Nwokolo CU, Bardhan KD, Savage RS, Covington JA. Differentiating Coeliac disease from irritable bowel syndrome by urinary volatile organic compound analysisea pilot study. PLoS One 2014:e107312. [15] Bruins M, Rahim Z, Bos A, van de Sande WJ, Endtz H, Belkum A. Diagnosis of
active tuberculosis by e-nose analysis of exhaled air. Tuberculosis 2013;93: 232e8.
A.S. Sahota et al. / Tuberculosis 99 (2016) 143e146