Abstract—This paper presents a new Eukaryotic promoter recognition method based on principle component analysis (PCA). We compute 3-mer and 5-mer frequencies as input features and use the PCA to reduce the dimensionality of the feature vector. Our system employs three neural network classifiers to distinguish promoters versus exons, promoters versus introns and promoters versus 3’UTR sequences, respectively. Our promoter prediction system produces the smallest number of false positives with the same number true positives in comparison with existing systems.
Index Terms—Promoter recognition, DNA sequence analysis, CpG islands, Transcription start sites, Principal Component analysis
I. INTRODUCTION
Eukaryotic promoter prediction plays a very important role in the study of gene regulation. Although there are a number of promoter prediction algorithms, the result is far from satisfactory and there is a clear need to increase true positive predictions and at the same time reduce false positive predictions. An important problem to solve is to select appropriate features for the prediction system.
It is difficult to find effective patterns in DNA sequences to classify promoter and non-promoter sequences. Most promoter prediction methods use CpG-islands as an important feature. However, only half the human promoters are CpG-island related, which leads to some prediction method producing even worse results than pure random guesswork when performing prediction on non-CpG-island promoters[1]. A similar situation occurs when using only TATA-box or CAAT-box etc. to search for promoters because a high percentage of promoters do not contain these signals. Therefore, it is an important task, to find more effective features and an improved relationship among them. Principal component
Manuscript received October 26, 2007. This work is supported by the Hong Kong Research Grant Council (Project CityU122506) and City University of Hong Kong (Project 9610034).
Xiaomeng Li is with the School of Electrical and Information Engineering, University of Sydney and the Department of Electronic Engineering, City University of Hong Kong. (phone: 852-27889895; fax: 852-27844262; e-mail: lixiaomeng@ ee.usyd.edu.au)
Yongmei Liu was with the School of Electrical and Information Engineering, University of Sydney and is now with the School of Computer Science and Technology, Harbin Engineering University (e-mail:liuyongmei @hrbeu.edu.cn).
Hong Yan is with the Department of Electronic Engineering, City University of Hong Kong and the School of Electrical and Information Engineering, University of Sydney (e-mail: [email protected]).
analysis (PCA) is a useful statistical technique that has been applied in many fields such as human face recognition and image compression. It is also a common technique for finding patterns in data with high dimensions[2]. In this paper, we create high dimensional matrices using features extracted from sample DNA sequences, and select several most import features using PCA. These features are used as input to a neural network for training purposes. The concept of CpG islands is also adopted as an enhancing signal here because they are still associated with ~60% of human promoters[3]. The specificity of our system is greatly improved in comparison with existing methods.
II. DATASET CONSTRUCTION AND FEATURE SELECTION The promoter sequences are downloaded from the Eukaryotic Promoter Database (EPD), Release 86[4], and from the database of transcription start sites (DBTSS), version 5.2.0[5]. Human exon and intron Sequences are extracted from the exon-intron database (http://hsc.utoledo.edu /bioinfo/eid/index.html) and the human 3’UTR sequence is from the UTR database[6]. PCA is used for feature selection and neural network is adopted for classification.
A. Datasets construction and normalization
We construct datasets of 3-mer (codon) and 5-mer frequencies for both the promoter training data set and non-promoter training data set, as follows:
1) For all sequences, the length is fixed at 300bp: Promoter training set: We use 250bp upstream to 50bp downstream of the transcription binding site and 1000 sequences are randomly selected from EPD and 7000 sequences from DBTSS.
Non-promoter training set: We select the sequence whose length is over 1200bp from the non-promoter database (compared to sequence length in EPD, 1200bp of each sequence). We arrange the selected sequence into 300bp each and choose 10000 sequence from each of the Exon, Intron, and UTR databases.
2) We count the 3-mer and 5-mer frequencies (overlapping) of each sequence, and build a 64
×
n
and a 1024×
n
matrix for each dataset, wheren
represents the sample number in each dataset (8000 in the promoter training set and 10000 in each of three non-promoter training sets).We apply the normalization and combine two matrices of each dataset as follows:
Eukaryotic Promoter Predication Based on
Principal Component Analysis
0 1
1 1
max
( , )
( , )
a i j
1, 2,...64
1, 2,...
a i j
i
j
n
a
=
=
=
(1)0 2
2 2
max
( , )
( , ) b i j 1, 2,...1024 1, 2,...
b i j i j n
b
= = = (2)
1
3, 3
2
( , )
(
)
1, 2,...1088
1, 2,...
( , )
a i j
c i j
i
j
n
b i
j
⎡
⎤
=
⎢
⎥
=
=
⎣
⎦
(3)where
a i j
0( , )
1 ,a i j
( , )
1 andb i
0( , )
2j
,b i
( , )
2j
are 3-mer and 5-mer separate frequency matrix elements before and after normalization,a
max andb
max are maximum values of 3-mer and 5-mer matrix respectively, andc i j
( , )
3 is a combined feature matrix element. B. Principal component analysis and feature selectionLet us refer to the
m n
×
matrixC
as the feature matrix, where mis the number of features and n is the number of samples. Our target is to find an orthonormal matrixP
, whereP
−1=
P
T andY
=
PC
such that1
1
T YC
YY
n
≡
−
is diagonalized. The rows ofP
are the principal components ofC
. That is,1
1
1
(
)(
)
1
1
1
1
1
T Y T T T T YC
YY
n
PC PC
n
PCC P
n
C
PAP
n
=
−
=
−
=
−
=
−
(4)where
A
≡
CC
TAs
A
is symmetric, we can find matrixE
andD
so thatA
=
EDE
T, where D is a diagonal matrix and E is a matrix of eigenvectors of A arranged as columns. Thus, we can select P where each row of P is an eigenvector ofCC
T. Now, we can rewriteC
Y in terms ofP
andD
.1 1
1
1
1
(
)
1
1
(
) (
)
1
1
(
) (
)
1
1
1
T Y T T T TC
PAP
n
P P DP P
n
PP
D PP
n
PP
D PP
n
D
n
− −=
−
=
−
=
−
=
−
=
−
(5)It is obvious that P is the matrix that can
diagonalizes
C
Y. The principal components ofC
are theFig.1: Distributions of promoters and exons in the three-dimensional space of first three principal components. The data points in the two classes are well separated.
eigenvectors of
CC
T. The ith diagonal value ofC
Y is the variance ofC
alongp
i(row vector ofP
)[7].We rank the diagonal values of
C
Y, and a large value ofC
Y is associated with a high level of energy. In our work, we select the first three principal components of matrix P(p1, p2, p3) as new feature vectors. We cannotspecify any nucleotide-combined features here as the TATA box or CAAT box because 1088 features mentioned previously are decomposed and merged again. More complicated features are found and a new 3-dimensional space (p1, p2, p3) which can best describe
the characteristics of each dataset group is formed. The dimension of the original feature matrix
C
is reduced by projection onto the new space and then, a new matrix based on each dataset is used as input to a neural network for training purposes. Fig.1 shows the projection of promoter and exon datasets after dimension reduction by PCA. The result shows that the first three principal components can be used to separate promoters and exons effectively.C. CpG islands features
300bp Sliding
Window
Promoter vs. Exon Sensor
Promoter vs. Intron Sensor
Promoter vs. 3'Utr Sensor
Feature Vector Creation
Model
PCA Model
CpG Islands Model
Data processing
Prediction of TSS DNA
Sequence
Fig.2: The overall structure of our promoter recognition system.
(1) GC percentage (GCp)
( )
( ),
GCp
=
P C
+
P G
(6)(2) Observed/expected CpG ratio (
o e
/
)(
)
/
,
( )
( )
P CG
o e
P C
P G
=
×
(7)where
P C
( )
number of C s
'
length
=
(8)'
( )
number of G s
P G
length
=
(9)
P CG
(
)
number of CG s
'
length
=
(10)
If
GCp
>
0.5
, ando e
/
>
0.6
, the sequence is CpG islands related, otherwise it is non-CpG islands related[14].As an important feature of promoters, CpG islands themselves have a high level of energy so that they would have a large contribution to the principal components. However, it is inevitable that some useful signals might be largely reduced or lost during matrix transformation. So we extract CpG island features separately and use them together with those selected by PCA for classification.
III. PREDICTION SYSTEM
We use a sliding window to predict TSS along a large genome sequence. The flow diagram of our system is shown in Fig.2. The window size is 300bp and it moves 20bp in each step in our model. Each sequence segment will receive a score from the CpG islands model and at the same time, the Feature Vector Creation Model generates a feature vector containing 3-mer and 5-mer frequencies. The vector will be projected to a new space by the PCA model and then sent to
three sensors: Promoter vs. Exon Sensor, Promoter vs. Intron Sensor and Promoter vs. Exon Sensor, which perform separate classifications. The three scores from the sensors together with the one from CpG islands are processed in the Data Processing Model and the final prediction of TSS will be produced. The PCA model and the three connected sensors are the neural networks built from training samples.
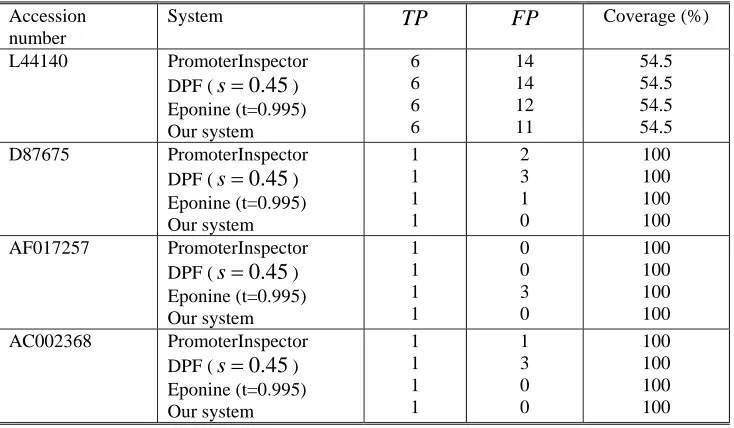
IV. EXPERIMENT RESULTS
The testing set consists of four human genomic sequences from GenBank with a total length of 0.95Mb and 14 known TSS. Table I shows an overview of the selected genomic sequences.Three best known promoter prediction systems are selected in order to compare the performance of our system: PromoterInspector[15], Dragon Promoter Finder and Epoine. A promoter region is counted as true positive (TP) if TSS is located within the region or if a region boundary is within 200bp 5’ of such a TSS. Otherwise the predicted region is counted as false positive (FP). Both PromoterInspector and our system use default settings. In DPF,
s
is set at 0.45 and in Eponine,t
=
0.995
. The results and comparisons are listed in Table II and Table III. It can be seen that our method produces the smallest number of false positives with the same number true positives in comparison with existing methods.V. CONCLUTION
Table I Description of the large genomic sequences in the testing set
Accession number Description Length
(bp)
Number of TSS L44140 Homo sapiens chromosome X region
from filamin (FLM) gene to glucose-6-phoshate dehydrogenase (G6PD) gene. There are 13 known and six candidate genes in the sequence.
219447 11
D87675 Homo sapiens DNA for amyloid precursor protein.
301692 1 AF017257 Homo sapiens chromosome 21-derived
BAC containing erythroblastosis virus oncogene homolog 2 protein (ets-2) gene.
101569 1
AC002368 Homo sapiens Xq 28 BAC PAC and cosmid clones containing FMR2 gene.
324816 1
[image:4.612.124.491.310.524.2]Total 947524 14
Table II Promoter prediction results of four different systems Accession
number
System
TP
FP
Coverage (%)L44140 PromoterInspector DPF (
s
=
0.45
)Eponine (t=0.995) Our system
6 6 6 6
14 14 12 11
54.5 54.5 54.5 54.5 D87675 PromoterInspector
DPF (
s
=
0.45
) Eponine (t=0.995) Our system1 1 1 1
2 3 1 0
100 100 100 100 AF017257 PromoterInspector
DPF (
s
=
0.45
) Eponine (t=0.995) Our system1 1 1 1
0 0 3 0
100 100 100 100 AC002368 PromoterInspector
DPF (
s
=
0.45
) Eponine (t=0.995) Our system1 1 1 1
1 3 0 0
100 100 100 100
TABLE III Performance comparison of four prediction systems in a testing set.
System
TP
FP
(%)
ae
S
S
p(%)
bPromoterInspector 9 17 64.2 34.6
DPF (
s
=
0.45
) 9 20 64.2 31.0Eponine 9 16 64.2 36.0
Our system 9 11 64.2 45.0
a
Sensitivity:
S
e=
TP TP
/(
+
FN
)
.FN
: false negativeb
Specificity:
S
p=
TP TP
/(
+
FP
)
enhancing factors because the impact of some important signals might be reduced during dimension reduction processing.
ACKNOWLEDGMENT
REFERENCES
[1] V.B. Bajic, S.L. Tan, Y. Suzuki, and S. Sugano, “Promoter prediction analysis on the whole human genome,” Nature Biotechnology, vol. 22, pp. 1467-1474, 2004.
[2] L.I. Smith, “A tutorial on Principal Components Analysis,” pp. 26, 2002.
[3] S.H. Cross and A.P. Bird, “Isolation of CpG islands from large genomic clones.,” Nucleic Acids Research, vol. 27, pp. 2099-2107, 1999.
[4] C.D. Schmid, R. Perier, V. Praz, and P. Bucher, “EPD in its twentieth year: towards complete promoter coverage of selected model organisms,” Nucleic Acids Research, vol. 34, pp. 82-85, 2006. [5] Y. Suzuki, R. Yamashita, K. Nakai, and S. Sugano, “DBTSS:
DataBase of human Transcriptional Start Sites and full-length cDNAs,” Nucleic Acids Research, vol. 30, pp. 328-331, 2002. [6] G. Pesole, S. Liuni, G. Grillo, F. Licciulli, F. Mignone, C. Gissi, and
C. Saccone, “UTRdb and UTRsite: specialized databases of sequences and functional elements of 5' and 3' untranslated regions of eukaryotic mRNAs. Update 2002,” Nucleic Acids Research, vol. 30, pp. 6, 2001.
[7] J. Shlens, “A Tutorial on Principal Component Analysis,” pp. 13, 2005.
[8] L. Ponger and D. Mouchiroud, “CpGProD: identifying CpG islands associated with transcription start sites in large genomic mammalian sequences,” Bioinformatics, vol. 18, pp. 631-634, 2002.
[9] V.B. Bajic, A. Chong, S.H. Seah, and a.V. Brusic, “An Intelligent System for Vertebrate Promoter Recognition,” IEEE Intelligent Systems, vol. 17, pp. 64-70, 2002.
[10] V.B. Bajic, S.H. Seah, A. Chong, S.P.T. Krishnan, J.L.Y. Kon, and V. Brusic, “Computer model for recognition of functional transcription start sites in RNA polymerase II promoters of vertebrates,” Journal of Molecular Graphics and Modelling, vol. 21, pp. 323-332, 2003.
[11] V.B. Bajic and S.H. Seah, “Dragon Gene start Finder: An Advanced System for finding Approximate Location of the start of Gene Transcriptional Units,” Genome Res. 2003, vol. 13, pp. 1923-1929, Jul 17 2003.
[12] R.V. Davuluri, I. Grosse, and M.Q. Zhang, “Computational identification of promoters and first exons in the human genome,”
Nature Genetics, vol. 29, pp. 412-417, 2001.
[13] X. Xie, S. Wu, K.-M. Lam, and H. Yan, “PromoterExplorer: an efective promoter identificaiton method based on the Adaboost algorithm,” Bioinformatics, vol. 22, pp. 2722-2728, 2006.
[14] Gardiner-Garden and Frommer, “CpG islands in vertebrate genomes,” Journal of Molecular Biology, vol. 196(2), pp. 261-282, 1987.
[15] M. Scherf, A. Klingenhoff, and T. Werner, “Highly Specific Localization of Promoter Regions in Large Genomic Sequences by PromoterInspector: A Novel Context Analysis Approach,” Journal of Molecular Biology, vol. 297, pp. 599-606, 2000.