Attribute-Based and Value-Based Clustering: An Evaluation
Abdulrahman ALMUHAREB and Massimo POESIO Department of Computer Science and Centre for Cognitive Science
University of Essex
Colchester, United Kingdom, CO4 3SQ
[email protected] [email protected]
Abstract
In most research on concept acquisition from corpora, concepts are modeled as vectors of relations extracted from syntactic structures. In the case of modifiers, these relations often specify values of attributes, as in (attr red); this is unlike what typically proposed in theories of knowledge representation, where concepts are typically defined in terms of their attributes (e.g., color). We compared models of concepts based on values with models based on attributes, using lexical clustering as the basis for comparison. We find that attribute-based models work better than value-based ones, and result in shorter descriptions; but that mixed models including both the best attributes and the best values work best of all.
1 Introduction
In most recent research on concept acquisition from corpora (e.g., for lexicon construction), concepts are viewed as vectors of relations, or properties, extracted from syntactic structures (Grefenstette, 1993; Lin, 1998; Curran and Moens, 2002; Kilgarriff, 2003, and many others). These properties often specify values of attributes such as color, shape, or size: for example, the vector used by Lin (1998) for the concept dog includes the property (dog adj-mod brown). (We will use the term values here to refer to any modifier.) To our knowledge, however, no attempt has been made by computational linguists to use the attributes themselves in such vectors: i.e., to learn that the description of the concept dog includes elements such as (dog color) or (dog size). This is surprising when considering that most models of concepts in the AI literature are based on such attributes (Brachman and Levesque, 1985).
Two problems need to be addressed when trying to identify concept attributes. The first problem is that values are easier to extract. We found, however, that patterns like the X of the dog,
already used in (Berland and Charniak, 1999; Poesio et al, 2002) to find part-of relations (using techniques derived from those used in (Hearst, 1998; Caraballo, 1999) to find hyponymy relations) are quite effective at finding attributes. A second problem might be that instances of such patterns are less frequent than those used to extract values, even in large corpora such as the British National Corpus (BNC). But this problem, as well, is less serious when using the Web as a corpus (Kilgarriff and Schuetze, 2003; Keller and Lapata, 2003; Markert et al, submitted).
We report on two experiments whose goal was to test whether identifying attributes leads to better lexical descriptions of concepts. We do this by comparing the results obtained by using attributes or more general modifiers – that we will simply call values – as elements of concept vectors used to identify concept similarities via clustering. In Section 2, we discuss how Web data were used to build attribute- and value- based concept vectors, and our clustering and evaluation methods. In Section 3, we discuss a first experiment using the set of concepts used in (Lund and Burgess, 1996). In Section 4, we discuss a second experiment using 214 concepts from WordNet (Fellbaum, 1998). In Section 5 we return to the notion of attribute.
2 Methods
2.1 Using Text Patterns to Build Concept Descriptions
complete descriptions are built (see below) and allows the specification of much more general patterns (e.g., matching descriptions modified in a variety of ways, see below), but is computationally much more expensive, particularly when Web data are used, as done here. We also found that when using the Web, simple text patterns not requiring parsing or POS tagging were sufficient to extract large numbers of instances of properties with a good degree of precision.
Our methods for extracting 'values' are analogous to those used in the previous literature, apart from the two simplifications just mentioned: i.e., we just consider every nominal modifier as expressing a potential property. The pattern we use to extract values is as follows:
• "[a|an|the] * C [is|was]"
where C is a concept, and the wildcard (*) stands for an unspecified value. The restriction to instances containing is or was to ensure that the C actually stands for a concept (i.e., avoiding modifiers) proved adequate to ensure precision. An example of text matching this pattern is:
• … an inexpensive car is …
The pattern we use for extracting concept attributes is based on linguistic tests for attributes already discussed, e.g., in (Woods, 1975). According to Woods, A is an attribute of C if we can say [V is a/the A of C]: e.g., brown is a color of dogs. If no V can be found which is a value of A, then A can not be an attribute for the concept C. This test only selects attributes that have values, and is designed to exclude other functions defined over concepts, such as parts. But some of these functions can be (and have been) viewed as defining attributes of concepts as well; so for the moment we used more general patterns identifying all relational nouns taking a particular concept as arguments. (We return on the issue of the characterization of attributes below.) Our pattern for attributes is shown below:
• "the * of the C [is|was]"
where again C is a concept, but the wildcard denotes an unspecified attribute. Again, is/was is used to increase precision. An example of text matching this pattern is:
• … the price of the car was …
Both of the patterns we use satisfy Hearst's desiderata for good patterns (Hearst, 1998): they are (i) frequent, (ii) precise, and (iii) easy to recognize. Patterns similar to our attribute pattern were used by Berland and Charniak (1999) and Poesio et al (2002) to find object parts only; after
collecting their data, Berland and Charniak filtered out words ending with "ness", "ing", and "ity", because these express qualities of objects, and used a ranking method to rank the remaining words. (An accuracy of 55% for the top 50 proposed parts was reported.) We found that these patterns can be used to collect other sorts of 'attributes', as well.
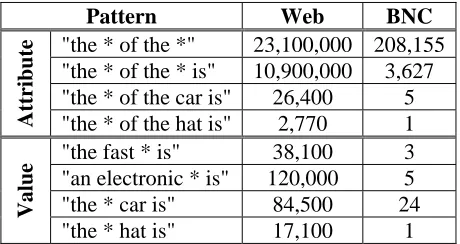
[image:2.595.311.541.358.480.2]2.2 Web Data Collection through Google In recent years there has been growing evidence that using the Web as a corpus greatly reduces the problem of data sparseness, and its size more than compensates the lack of balance (e.g., (Keller and Lapata, 2003)). The benefits from using the Web over even large corpora like the BNC for extracting semantic relations, particularly when using simple text patterns, were informally pointed out in (Poesio, 2003) and demonstrated more systematically by Markert et al (submitted). These findings were confirmed by our experiments. A comparison of numbers of instances of some patterns using the Web and the BNC is shown in Table 1.
Pattern Web BNC
"the * of the *" 23,100,000 208,155 "the * of the * is" 10,900,000 3,627 "the * of the car is" 26,400 5 Attribute "the * of the hat is" 2,770 1 "the fast * is" 38,100 3 "an electronic * is" 120,000 5 "the * car is" 84,500 24
Value
"the * hat is" 17,100 1
Table 1: Comparison of frequencies of some patterns in BNC and the Web. Web frequency is
based on Google counts
We collect our data from the Web using the Google search engine, accessed via the freely available Google Web API1. The API only allows to retrieve the first 1,000 results per search request; to overcome this restriction, we use the daterage feature of the Google search request. This feature allows the user to fragment the search space into a number of periods, hence retrieving only pages that have been updated during a specified period. In the two experiments presented here, we aimed to collect up to 10,000 matches per search request using the daterage feature: we divided the search space into 100 days starting from January, 1990 until mid 2004. (The procedure we used does not guarantee collecting all the instances in the accessed periods, because if there are more than
1,000 instances in one period, then only the first 1,000 instances will be collected.) 2
Our requests to Google take the general form "s1
* s2" (including the double quotes), where s1 and s2
are two strings and the wildcard denotes an unspecified single word. For example, the search request "a * car is" catches instances such as: [a red car is], [a small car is], and [a sport car is]. It is worth mentioning that Google does not pay attention to punctuation marks; this is one area in which parsing would help.
When receiving results from Google, we do not access the actual Web pages, but instead we process the snippets that are returned by Google.3
2.3 Clustering Methods
The task that we use to compare concept descriptions is lexical acquisition via clustering. We experimented with clustering systems such as COBWEB (Fisher, 1987) and SUBDUE (Cook and Holder, 2000) before settling on CLUTO 2.1 (Karypis, 2002). CLUTO is a general-purpose clustering tool that implements three different clustering algorithms: partitional, agglomerative, and graph partitioning algorithms. CLUTO produces both flat and hierarchical clusters. It uses a hard clustering technique, where each concept can be assigned to only one cluster. The software allows to choose a similarity metric between a set including extended Jaccard and cosine. CLUTO was optimized to cluster data of large sizes in a reasonable time. The software also provides analysis and visualization tools.
In this paper, we use extended Jaccard, which was found to produce more accurate results than the cosine function in similar tasks (Karypis, 2002; Curran and Moens, 2003). In CLUTO, the extended Jaccard function works only with the graph partitioning algorithm.
2.4 Evaluation Measures
We used two types of measures to evaluate the clusters produced by CLUTO using the concept descriptions discussed above, both of which compare the clusters produced by the system to model clusters. Accuracy is computed by dividing the number of correctly clustered concepts by the total number of concepts. The number of correctly clustered concepts is determined by examining
2 Also, registered users of the API can send up to 1,000 requests per day, but our daily limit was increased by Google to 20,000 requests per day.
3 Snippets are text excerpts captured from the actual web pages with embedded HTML tags. We process the snippets by removing the HTML tags and extracting the targeted piece of text that was specified in the request.
each system cluster, finding the class of each concept in the model clusters, and determining the majority class. The cluster is then labeled with this class; the concepts belonging to it are taken to be correctly clustered, whereas the remaining concepts are judged to be incorrectly clustered.
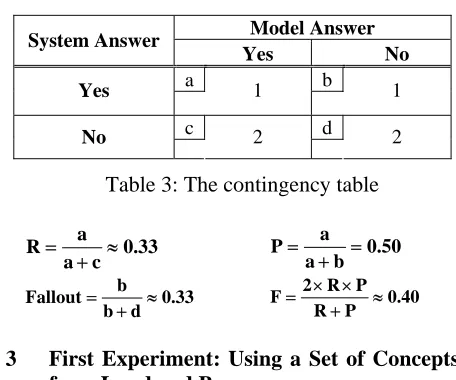
In the contingency table evaluation (Swets, 1969; Hatzivassiloglou and McKeown, 1993), the clusters are converted into two lists (one for the system clusters and one for the model clusters) of yes-no answers to the question "Does the pair of concepts occur in the same cluster?" for each pair of concepts. A contingency table is then built, from which recall (R), precision (P), fallout, and F measures can be computed. For example, if the model clusters are: (A, B, C) and (D), and the system clusters are: (A, B) and (C, D), the yes-no lists are as in Table 2, and the contingency table is as in Table 3.
Question Model
Answer
System Answer Does the pair (A, B) occur in
the same cluster? Yes Yes
Does the pair (A, C) occur in
the same cluster? Yes No
Does the pair (A, D) occur in
the same cluster? No No
Does the pair (B, C) occur in
the same cluster? Yes No
Does the pair (B, D) occur in
the same cluster? No No
Does the pair (C, D) occur in
[image:3.595.310.542.309.493.2]the same cluster? No Yes
Table 2: Model and the system answers for the co-occurrence question
Model Answer System Answer
Yes No
a b
Yes 1 1
c d
No 2 2
Table 3: The contingency table
33 . 0 c a
a
R ≈
+
= 0.50
b a
a
P =
+ =
33 . 0 d b
b
Fallout ≈
+
= 0.40
P R
P R 2
F ≈
+ × × =
3 First Experiment: Using a Set of Concepts from Lund and Burgess
[image:3.595.309.537.527.717.2]we used much smaller sets of concepts in our two experiments. The first set allowed us to compare our results with those obtained by Lund and Burgess (1996); the second set consisted of a larger number of concepts from WordNet.
Lund and Burgess (1996) used a set of 34 concepts belonging to 3 different classes (animals, body parts, and geographical locations) to evaluate their method for acquiring lexical representations, HAL (Hyperspace Analogue to Language). Lund and Burgess were able to correctly cluster all of the concepts except for one body part, tooth, which was incorrectly clustered with animals. In this first experiment, we used the 34 Lund and Burgess concepts plus Italy, horse, and tongue (37 in total) to compare value-based and attribute-based description when used for clustering, using concept descriptions collected using the methods described above.
The input to clustering is a frequency table with concepts as rows and values, attributes, or both attributes and values as columns. Each cell in the table contains the frequency of co-occurrence between the concept and corresponding value or attribute. Before clustering, the frequencies are transformed into weighted values using the t test (Manning and Schutze, 1999). (The t test was found by Curran and Moens (2002) to be the best weighting method.) The t test formula we used for attributes is shown below:
2 j i
2
j i
j i
j , i
N
) attribute , concept ( C
N
) attribute ( C ) concept ( C
N
) attribute , concept ( C
t
⎟⎟ ⎠ ⎞ ⎜⎜
⎝
⎛ ×
−
≈ (1)
where N is the total number of relations, and C is a count function. The values formula is similar.
We use the CLUTO vcluster command for clustering, with parameters: similarity function = Extended Jaccard Coefficient, clustering method = Graph Partitioning, no. of clusters = 3.
Vector Size4
Used Data
500 1522 3044 4753 4969 Values
Only 64.86% 94.59% - - 94.59% Attributes
Only 97.30% 97.30% - 97.30% - Attributes1522
and Values1522
[image:4.595.58.281.449.496.2]- - 100.00% - -
Table 4: Clustering accuracy with values, attributes, and their combination, using different
vector sizes
4 Here, we choose the top k features by their overall frequency.
Table 4 shows the accuracy of the produced clusters when using values, attributes, and the combination with different vector sizes. The results show that with concept descriptions of length 500, attributes (97.30%) are much more accurate than values (64.86%). With vectors of size 1522, the accuracy with attributes remains the same, while the accuracy with values improves, but is still lower than the accuracy with attributes (94.59%). This indicates that attributes have more discriminatory power than values: an attribute vector of size 500 is sufficient to produce a more accurate result than using a value vector of three times the size. But perhaps the most interesting result is that even though further increasing the size of pure attribute- and value- descriptions (to 4753 and 4969, respectively) does not improve accuracy, perfect accuracy can be obtained by using vectors of length 3044, including the 1522 best attributes and the 1522 best values. This suggests that while attributes are a good way of generalizing across properties, not all properties of concepts can be viewed as attribute/value pairs (section 5; also (Poesio and Almuhareb, submitted)).
4 Second Experiment: Using a Set of Concepts from WordNet
In order to get a more realistic evaluation and a better comparison with work such as (Lin, 1998; Curran and Moens, 2002), we also ran a second experiment using a larger set of concepts from the WordNet noun hierarchy (Fellbaum, 1998). We chose 214 relatively common concepts from 13 different classes covering a variety of subhierarchies (see Appendix A). Each class contains a set of concepts that share a common hypernym in the WordNet hierarchy.
Model Answer Systems Answer
Yes No
Yes 1294 503
Boolean
No 387 20607
Yes 1117 950
Frequency
[image:4.595.309.542.556.638.2]No 564 20160
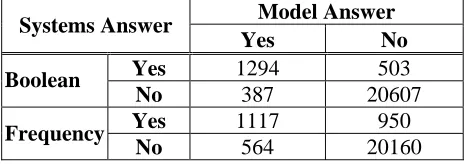
Table 5: The contingency table based on boolean and frequency for the combined attributes and
values
The frequencies for attributes and values were again collected as in the first experiment. However, these data were used in a different way. In determining the weight, we performed the t test5
on boolean values instead of the original
[image:4.595.56.285.593.712.2]frequencies6, treating all positive frequencies as 1
and everything else as 0. This eliminates the effect of variations in frequencies in the original data, the intuition being that frequencies do not add to the semantics of concepts: what we are interested in is the fact that a concept has a given attribute/value, regardless of how many times we have encountered this fact. This approach is similar to the approach adopted in (Hearst, 1998); see also (Curran and Moens, 2002) for a comparison of methods dealing with concept vectors based on raw frequencies or boolean values. The transformed table is a binary table that contains only zeros and ones in its cells. Table 5 shows the contingency table for clusters produced based on boolean and frequency for the combined data of attributes and values; it shows that boolean data is more accurate in the four cases.
For clustering, as well, we used CLUTO in a different way. Instead of asking CLUTO to compute the similarities between the concepts, we computed them ourselves, using the version of the extended Jaccard similarity function used by Curran and Moens, as this version produces better results than the one used in CLUTO. The two versions of the extended Jaccard function are shown below:
where tm,i and tn,i are the weighted co-occurrence values between concept m and concept n with attribute/value i, and computed as in equation (1).
Measures Used
Data7 Accuracy
Recall Precision Fallout F Values
Only 71.96% 58.48% 52.91% 04.14% 55.55% Attributes
Only 64.02% 59.90% 53.54% 04.14% 56.54%
Attributes
And Values 85.51% 76.98% 72.01% 02.38% 74.41%
Table 6: Clustering evaluation based on values, attributes, and the combination
We compute the similarity between each pair of concepts, produce a similarity matrix and send it to CLUTO for clustering. We then call the scluster
6 In equation (1), this will effect only C(concepti,
attributej), other counts will not be effected.
7 Here, we use full size vectors that contain all the features.
command of CLUTO with the following parameters: clustering method = Graph Partitioning, no. of clusters = 13. The results of the evaluation are shown in Table 6.
Value-based concept descriptions resulted in better clusters than attribute-based when measured using Accuracy (71.96% vs. 64.02%), but the other measures all indicate that attributes work slightly better than values: e.g., F=55.55% for values, 56.64% for attributes. The reason for this difference is that the Accuracy measure simply evaluates if each concept is assigned to its correct cluster, while the remaining measures concern about the relation between each pair of concepts (i.e., if they were assigned to the same cluster or not). But, just as in Experiment 1, the best results by any measure are again obtained when using concept descriptions containing the best 'attributes' and the best 'values'; this time, however, the difference is much more significant: Accuracy is 85.51%, F is 74.41%.
Model Cluster
Sys
tem Cluste
r
Building Disease Vehicle Feeling Body Pa
rt Fruit Creator Publicati o n Animal
Furniture Clo
th
F. Relati
on
Time
1 0 2 0 11 0 0 0 0 0 0 0 0 0
2 0 0 13 0 0 0 0 0 0 0 0 0 0
3 0 0 0 0 0 0 0 0 0 0 0 0 17
4 0 0 0 0 0 0 2 0 18 0 0 6 0
5 2 0 0 1 0 16 0 0 1 0 0 1 0
6 1 16 0 0 0 0 0 0 0 0 0 0 1
7 0 0 0 0 0 0 15 0 0 0 0 0 0
8 0 0 0 0 0 0 0 15 0 0 0 0 0
9 0 0 0 0 16 0 0 0 0 4 0 0 1
10 0 0 0 0 0 0 0 0 1 0 0 9 0
11 1 0 1 0 0 0 0 0 0 6 0 0 0
12 0 0 0 0 0 0 0 0 0 2 16 0 0
[image:5.595.309.541.334.550.2]13 15 0 0 1 0 0 0 1 0 2 0 0 0
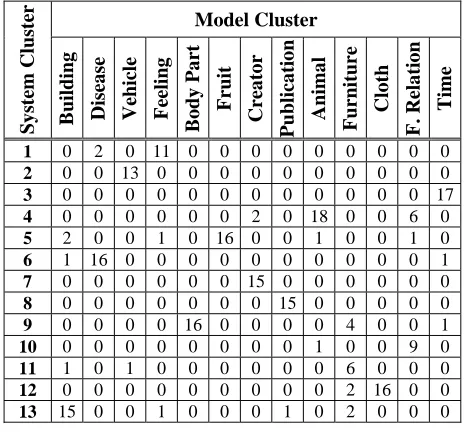
Table 7: The confusion matrix for the clusters produced using both attributes and values
Table 7 shows the confusion matrix for the clusters produced using both attributes and values. A close inspection of these clusters reveals that 'furniture' concepts were the less homogeneous because they were scattered among four different clusters. There are 14 'furniture' concepts; six of them (bookcase, cabinet, couch, cradle, desk and wardrobe) were grouped in a separate cluster which also contains two more concepts (pickup and greenhouse). Four of the concepts (bed, lamp, seat, and table) were clustered with 'body part' concepts. Two of the concepts (dresser and sofa) were clustered with 'cloth' concepts, and the remaining two concepts (chair and lounge) were clustered with 'building' concepts.
[image:5.595.55.282.543.635.2]Two points should be noted about the furniture concepts. First, at least two concepts (seat and lounge) have more than one sense in WordNet. Seat was clustered with body part concepts, which is acceptable if we think of seat as "the fleshy part of the human body that you sit on" (WordNet, sense 2). The same for lounge, which was clustered with buildings, which is consistent with its second sense in WordNet: "a public room (as in a hotel or airport) with seating where people can wait". This indicates that techniques for differentiating between different senses are needed – e.g., using a soft clustering technique as in (Pereira et al, 1993) instead of a hard clustering technique. Second, furniture concepts may not have a common prototype that is shared by all of the member concepts. This is a well known problem in the prototype theory of concepts (Laurence and Margolis, 1999).
The greater compactness of attribute-based representations vs. value-based ones was more evident in this second experiment. We collected 51,045 distinct values and 8,934 distinct attributes; the total number of value-concept relations is 1,026,335, compared to 422,621 attribute-concept relations.
5 Attributes and Values: A discussion
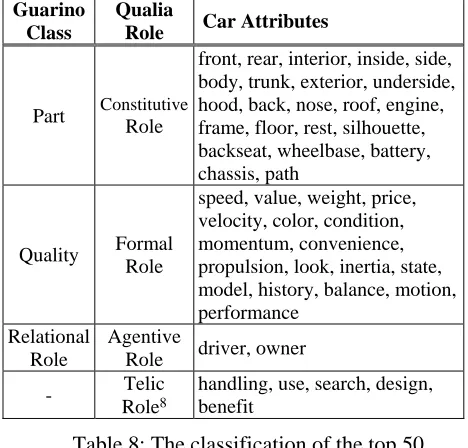
Although our results suggest that trying to identify attributes is beneficial, the notion of 'attribute' is not completely clear, and has been used in widely different ways in Knowledge Representation literature. An attempt of defining the notion has been made by Guarino (1992), who classifies attributes into relational and non-relational attributes. Relational attributes include qualities such as color and position, and relational roles such as son and spouse. Non-relational attributes include parts such as wheel and engine. The Qualia Structure of the Generative Lexicon (Pustejovsky, 1991) is another attempt at identifying "the essential attributes of an object as defined by the lexical item". Pustejovsky identifies four roles: Constitutive Role (Guarino's parts), Formal Role (Guarino's qualities), Agentive Role (Guarino's relational roles), and Telic Role (not included in Guarino's classification).
Our analysis of the attribute data shows that the attributes we found can be mapped in the four roles of the Qualia structure. Table 8 shows how we manually mapped the top 50 attributes of the concept car to the Qualia roles and the Guarino's classes. This mapping is not trivial (e.g., a path is not part of a car, and design can be regarded as a quality), but a variety of tests may help:
Morphological and Ontological Tests:
Dixon (1991) proposed a semantic classificationfor nouns. According to Dixon, parts are concrete concepts and mostly basic noun roots or rarely derived from verbs, while qualities are abstract concepts and many of them are basic noun roots or derived from adjectives, some derived from stems, and few derived from verbs. Our observations also suggest that telic attributes are usually derived from verbs.
Attributes Test: Since attributes can also be
viewed as concepts (e.g., in WordNet), they themselves should have some shared attributes. For example: since parts are concrete objects they should share attributes such as size, length, and geometry. Also, since qualities usually can be assigned values (e.g. age (25)), then they should share attributes such as range and average.Question Type Test: Different types of
attributes tend to occur with different types of questions. For example, relational role attributes tend to occur with who-questions like "Who is the driver of the car?" and "Who is the manufacturer of the car?"Guarino Class
Qualia
Role Car Attributes
Part Constitutive
Role
front, rear, interior, inside, side, body, trunk, exterior, underside, hood, back, nose, roof, engine, frame, floor, rest, silhouette, backseat, wheelbase, battery, chassis, path
Quality Formal
Role
speed, value, weight, price, velocity, color, condition, momentum, convenience, propulsion, look, inertia, state, model, history, balance, motion, performance
Relational Role
Agentive
Role driver, owner
- Telic
Role8
[image:6.595.306.540.351.575.2]handling, use, search, design, benefit
Table 8: The classification of the top 50 attributes of the concept car
In future work, we plan to use some of these tests to classify attributes, and possibly filter some of them; this might improve the discrimination power of attributes. Also, concepts may share certain Qualia, but differ in other respects: for example, the chair concept and the man concept share some parts (e.g., arm, back, leg, and seat) and even some qualities (e.g., color, size, and shape) but differ in other levels (i.e., Agentive Role, and Telic Role).
6 Conclusions
Simple text patterns were used to automatically extract both basic value-based and attribute-based concept descriptions for clustering purposes. Our preliminary results suggest, first of all, that when large amounts of data such as the Web are accessed, these simple patterns may be sufficient to compute descriptions rich enough to discriminate quite well, at least with small sets of concepts belonging to clearly distinct classes. Secondly, we found that even though attributes are fewer than values, attribute-based descriptions need not be as long as value-based ones to achieve as good or better results. Finally, we found that the best descriptions included both attributes and more general properties. We plan to extend this work both by refining our notion of attribute and by using more sophisticated patterns working off the output of a parser.
7 Acknowledgement
Abdulrahman Almuhareb is supported by King Abdulaziz City for Science and Technology (KACST), Riyadh, Saudi Arabia. We want to thank Google for making their Web API available to the research community and George Karypis for the CLUTO clustering toolkit.
References
M. Berland and E. Charniak. 1999. Finding parts in very large corpora. In Proc. of the 37th ACL, pages 57–64, University of Maryland.
R. J. Brachman and H. J. Levesque, editors. 1985. Reading in Knowledge Representation. Morgan Kaufmann, California.
S. A. Caraballo. 1999. Automatic construction of a hypernym-labeled noun hierarchy from text. In Proc. of the 37th ACL.
D. J. Cook and L. B. Holder. 2000. Graph-based data mining. IEEE Intelligent Systems, 15(2), 32-41.
J. R. Curran and M. Moens. 2002. Improvements in automatic thesaurus extraction. In Proc. of the ACL Workshop on Unsupervised Lexical Acquisition, pages 59–66.
R. M. W. Dixon. 1991. A New Approach to English Grammar, on Semantic Principles. Clarendon Press, Oxford.
C. Fellbaum, editor. 1998. WordNet: An electronic lexical database. The MIT Press.
D. H. Fisher. 1987. Knowledge acquisition via incremental conceptual clustering. Machine Learning, 2:139–172.
G. Grefenstette. 1993. SEXTANT: Extracting semantics from raw text implementation details. Heuristics: The Journal of Knowledge Engineering.
N. Guarino. 1992. Concepts, attributes and arbitrary relations: some linguistic and ontological criteria for structuring knowledge base. Data and Knowledge Engineering, 8, pages 249–261.
V. Hatzivassiloglou and K. McKeown. 1993. Towards the automatic identification of adjectival scales: clustering adjectives according to meaning. In Proc. of the 31st ACL, pages 172– 182.
M. A. Hearst. 1998. Automated discovery of WordNet relations. In C. Fellbaum, editor, WordNet: An Electronic Lexical Database. MIT Press.
G. Karypis. 2002. CLUTO: A clustering toolkit. Technical Report 02-017, University of Minnesota. Available at URL: http://www-users.cs.umn.edu/~karypis/cluto/.
F. Keller and M. Lapata. 2003. Using the Web to obtain frequencies for unseen bigrams. Computational Linguistics, 29(3).
A. Kilgarriff and H. Schuetze. 2003. Introduction to the special issue of Computational Linguistics on the web as a corpus. Computational Linguistics.
A. Kilgarriff. 2003. Thesauruses for Natural Language Processing. In Proc. of the IEEE 2003 International Conference on Natural Language Processing and Knowledge Engineering (NLP-KE'03), Beijing.
S. Laurence and E. Margolis. 1999. Concepts and Cognitive Science. In E. Margolis and S. Laurence, editors, Concepts: Core Readings. Cambridge, MA., Bradford Books/MIT Press, pages 3-81.
D. Lin. 1998. Automatic retrieval and clustering of similar words. In Proc. of COLING-ACL, 768-774.
K. Lund and C. Burgess. 1996. Producing high-dimensional semantic spaces from lexical co-occurrence. Behavior Research Methods, Instrumentation, and Computers, 28, 203-208. C. D. Manning and H. Schuetze. 1999.
Foundations of Statistical NLP. MIT Press. K. Markert, M. Nissim, and N. Modjeska. 2004.
Comparing Knowledge Sources for Nominal Anaphora Resolution. Submitted.
Proc. of the 31st ACL, pages 183-190, Columbus, Ohio.
M. Poesio and A. Almuhareb. 2004. Feature-based vs. Property-based KR: An Empirical Perspective. Submitted.
M. Poesio, T. Ishikawa, S. Walde, and R. Vieira. 2002. Acquiring lexical knowledge for anaphora resolution. In Proc. of LREC, Las Palmas, June. M. Poesio. 2003. Associative descriptions and
salience. In Proc. of the EACL Workshop on Computational Treatments of Anaphora, Budapest.
J. Pustejovsky. 1991. The generative lexicon. Computational Linguistics, 17(4), pages 409-441.
J. A. Swets. 1969. Effectiveness of Information Retrieval Methods. American Documentation, 20, pages 72-89.
W. A. Woods. 1975. What’s in a link: Foundations for semantic networks. In Daniel G. Bobrow and Alan M. Collins, editors, Representation and Understanding: Studies in Cognitive Science, pages 35-82. Academic Press, New York.
Appendix A. The 214 Concepts from the 13 WordNet Classes Used in Experiment 2 Class Concepts
Animal bear, bull, camel, cat, cow, deer, dog, elephant, horse, kitten, lion, monkey, mouse, oyster, puppy, rat, sheep, tiger, turtle, zebra
Building abattoir, center, clubhouse, dormitory, greenhouse, hall, hospital, hotel, house, inn, library, nursery, restaurant, school, skyscraper, tavern, theater, villa, whorehouse
Cloth pants, blouse, coat, costume, gloves, hat, jacket, jeans, neckpiece, pajamas, robe, scarf, shirt, suit, trousers, uniform
Creator architect, artist, builder, constructor, craftsman, designer, developer, farmer, inventor, maker, manufacture, musician, originator, painter, photographer, producer, tailor
Disease acne, anthrax, arthritis, asthma, cancer, cholera, cirrhosis, diabetes, eczema, flu, glaucoma, hepatitis, leukemia, malnutrition, meningitis, plague, rheumatism, smallpox
Feeling anger, desire, fear, happiness, joy, love, pain, passion, pleasure, sadness, sensitivity, shame, wonder
Fruit apple, banana, berry, cherry, grape, kiwi, lemon, mango, melon, olive, orange, peach, pear, pineapple, strawberry, watermelon
Furniture bed, bookcase, cabinet, chair, couch, cradle, desk, dresser, lamp, lounge, seat, sofa, table, wardrobe
Body Part ankle, arm, ear, eye, face, finger, foot, hand, head, leg, nose, shoulder, toe, tongue, tooth, wrist
Publication atlas, book, booklet, brochure, catalog, cookbook, dictionary, encyclopedia, handbook, journal, magazine, manual, phonebook, reference, textbook, workbook
Family Relation
boy, child, cousin, daughter, father, girl, grandchild, grandfather, grandmother, husband, kid, mother, offspring, sibling, son, wife
Time century, decade, era, evening, fall, hour, month, morning, night, overtime, quarter, season, semester, spring, summer, week, weekend, winter, year