Jurnal Pendidikan IPA Indonesia
http://journal.unnes.ac.id/index.php/jpiiA ROBUST DATA ENVELOPMENT ANALYSIS FOR EVALUATING
TECH-NICAL EFFICIENCY OF INDONESIAN HIGH SCHOOLS
U. Mahmudah*
1, Suhartono
2, A.D. Rohayana
3 1Faculty of Tarbiya and Teaching SciencesState Islamic Institute of Pekalongan, Pekalongan, Indonesia
1School of informatics and Applied Mathematics
Universiti Malaysia Terengganu, Malaysia
2Sebelas Maret University, Kebumen, Indonesia 3State Islamic Institute of Pekalongan, Pekalongan, Indonesia
DOI: 10.15294/jpii.v7i1.9883
Accepted: November 30th, 2017. Approved: February 28th, 2018. Published: March 19th, 2018 ABSTRACT
The main purpose of this study is to evaluate the technical efficiency of high school education in Indonesia by applying Data Envelopment Analysis (DEA), which is the most frequently used to measure the efficiency scores. However, this study uses a robust approach to face the complex problem of the traditional DEA, which may lead to biased results. Besides, it is a powerful approach to estimate technical efficiency when outliers contaminate the data set. Statistical data from general senior secondary schools in the period 2015/2016 is analyzed, using 34 provinces as decision-making units (DMUs), with eight input and six output variables. The results indicate that the average efficiency score of Indonesia’s major political subdivisions in managing high school education is 0.936. Furthermore, as many as 32.35 percents of provinces achieve efficient performances, with an efficiency score equal to one, while 17 provinces have above average efficiency scores. The results also indicate that effi-ciency scores from robust data envelopment analysis provide better accuracy. Overall, application of robust data envelopment analysis (RDEA) is appropriate for measuring the efficiency of provincial performance in organ-izing secondary education.
© 2018 Science Education Study Program FMIPA UNNES Semarang
Keywords: DEA, efficiency, robust, outliers
INTRODUCTION
High schools are very important educatio-nal institutions because they prepare students to face the real world by providing them with the necessary skills and knowledge to be able to live independently and co-exist in the community in a proper manner. Completing the high school level of education may help students in the next stage of their lives, whether they decide to go to college or take the first steps in their careers. Moreover,
it is difficult to find a decent job without a high school diploma, as educational attainment is usu-ally considered to be an absolute requirement in securing a job. In Indonesia, education level is an important consideration in certain positions that require appropriate skills. Therefore, graduation from high school is generally regarded as a mi-nimum requirement for further education or for direct entry into work.
Therefore, analysis of the measurement of the efficiency of high school education is impor-tant. This study aims to measure the efficiency of Indonesia’s major political subdivisions in orga-*Correspondence Address:
nizing high school education by using the DEA method. However, a robust approach is used to face the possibility of the existence of outliers in the actual data set. This approach tends to provide results with better accuracy. By knowing the effi-ciency of each province in managing high school education, the Indonesian government is con-sequently able to determine the best role model of high school management in order to improve the efficiency level of other provinces. This study is expected to make a contribution to Indonesi-an education, especially high school education, and enhance the quality of high school graduates who are ready to meet further challenges, whet-her these be college life or going straight to work.
Unfortunately, research on high school efficiency measurement in Indonesia is limited. In fact, no research has been found regarding the same topics. Fatimah & Mahmudah (2017) inves-tigate the measurement of the efficiency of ele-mentary schools in Indonesia by using two-stage data envelopment analysis. However, other stu-dies use high schools in Indonesia as samples for evaluation analysis. Yusrizal et al. (2017) investi-gate the level of knowledge and understanding of physics teachers in Senior High Schools in Banda Aceh when developing and analyzing test items. By using as many as 32 physics teachers, analysis of the results indicates that their skills are not sa-tisfactory.
Measurement efficiency was introduced by Farrel (1957), and one of the most commonly used methods is DEA, which is a non-parame-tric method for performing frontier analysis to estimate the efficiency scores of DMUs. This method allows us to make comparisons between DMUs in order to establish which are performing efficiently. An efficient DMU has an efficiency score exactly equal to one, which is equivalent to an efficiency value of 100 percent. Otherwise, DMU is said to be inefficient.
Many studies have applied DEA methods to evaluate the efficiency of educational insti-tutions (see, amongst others: Carrington et al., 2005; Kong & Fu, 2012; Nazarko & Saparaus-kas, 2014; and Mikusova, 2015). Barrow (1991) applied stochastic frontier analysis for estimating the stochastic cost frontier of schools in England, while Bonesrqnning & Rattsq (1994) analyze the efficiency of high schools in Norway. Moreo-ver, the technical efficiency of school districts in South Carolina is studied by Cooper & Cohn (1997). Although the DEA method has notable strengths in the analysis of frontier production, its estimator has complex and multidimensional properties.
Therefore, the existence of outliers causes the traditional DEA method to be sensitive due to it relies on the best DMU. It is important to note that the presence of outliers may produce less accurate results of the analysis. In order to deal with the problem that appears in the tradi-tional DEA, Cooper et al. (1998) and Gstach (1998) use stochastic DEA but this approach usually needs classical assumptions of statistical distribution. Further, Wilson (1995) suggests an approach to detect outliers regarding DEA met-hods. Other studies which used this procedure are those of Charnes et al. (1992) & Zhu (1996). Furthermore, Bertsimas & Sim (2003) analyze DEA method using robust optimization. Howe-ver, this study applies robust approach for estima-ting bias-corrected scores of technical efficiency, which is introduced by Simar & Wilson (1998). The statistical data of Indonesian high schools from 2015/2016 is analyzed using an R program. Due to the importance of science and technolo-gy, which influences very many areas, this study focuses on the field of scientific study in high schools in Indonesia. As mentioned by Dwianto et al. (2017), students in Indonesia are left behind regarding science accomplishment and there are some weaknesses in the science learning process.
METHODS
DEA is a non-parametric method used to measure DMUs by comparing those that have si-milar characteristics or are homogeneous, based on several input variables, to produce a number of outputs. This method has good advantages compared to other measurement methods becau-se there is no need to make distribution assump-tions, which are required in a parametric ana-lysis. DEA method consists of two models, i.e. the CRS (constant return to scale) and the VRS (variable return to scale) models. CRS model was introduced by Charnes, et al. (1978), that is why this model is often called the CCR model whe-reas the second model was developed by Banker, et al. (1984) and also known as the BCC model. However, the second model is a development of the first model. The difference between these two models relies on the initial assumption where the first model uses similarity ratios between the in-creasing input and output variables. Further, the CRS model also presumes that most DMUs per-form at an optimal scale. Meanwhile, the VRS model does not use similarity ratios but the inc-reases in input and output variables are different. Further, the VRS model presumes that DMUs do not perform at an optimal scale.
Basically, the DEA method which is con-cerning naïve score can be explained as follows. Let the observed input variables are defined by
, where while the output
va-riables are defined by , where
Suppose that .
The-refore, the input set have input variables to produce output variables under P and condition is applied (Shephard, 1981) and Coelli, et al., 1994). Therefore, following Besstremyannaya, et al., (2015) the CRS model of DEA method where input-oriented is applied
for where can be written
as follows:
subject to
and
The assumption used in this model show that has strict convexity as well as disposability of the input and output variables. Strong disposa-bility refers to when and then
. Further, the additional constraints of are needed in order to impose this model on the VRS model.
As this method is based on frontiers, then to produce better results it requires the accuracy and preciseness of the input and output variables, because even the slightest change can change the estimates significantly.
Even though DEA method is very often used and is the most powerful method, precise and accurate data is required to yield unbiased scores of efficiency. However, most researchers face difficulties in obtaining real data accurately because the input and output variables are full of uncertainties. Therefore, in order to deal with the uncertainty this study applies bootstrap method which is a very good method for approximating the estimator where empirical distribution is concerned. Bootstrap is used to correct for bias, as the estimated boundary of the input
variables may fail to include the most efficient DMU. Consequently, for each DMU j then bias
can be explained by bias where it can be written as bias
Therefore, the following steps are required in ful-filling this:
Step 1: Estimating the naive scores of DEA in equation (2) that is defined by
Step 2: Repeating B times to provide bootstrap estimates as many as J sets.
Step 3: Calculating for
Step 4: Calculating bias-corrected efficiency
scores by using .
Simar and Wilson (2007) report that the input variables in bootstrap DEA where the input-oriented model is concerned in correcting the bias scores , which is the reciprocal of do not depend on the environmental variables . In other words, the input variables which are not controlled by producers can be explained by the following procedures:
Step 1: Estimating the naïve distance scores which are defined as , where . Step 2: Assuming that the naive distance scores
, where with left
truncation at .
Step 3: Calculating and with condition .
Step 4: Repeating B times to provide bootstrap estimates as many as J sets.
Step 5: Calculating .
Step 6: Calculating bias-corrected scores by using .
RESULTS AND DISCUSSION
The study uses statistics from high schools from 2015/2016 that were prepared by the Cen-ter for Educational and Cultural Data and Statis-tics, Secretariat General, Ministry of Education and Culture of Republic of Indonesia. Basically, the data presents a general description of high schools in Indonesia that covers the number of schools, applicants, new entrants, students, re-peaters, graduates, headmasters, teachers, classes and classrooms. Furthermore, the data is based on the results of the verification and validation that are made by the Secretariat Directorate Ge-neral of Primary and Secondary Education and
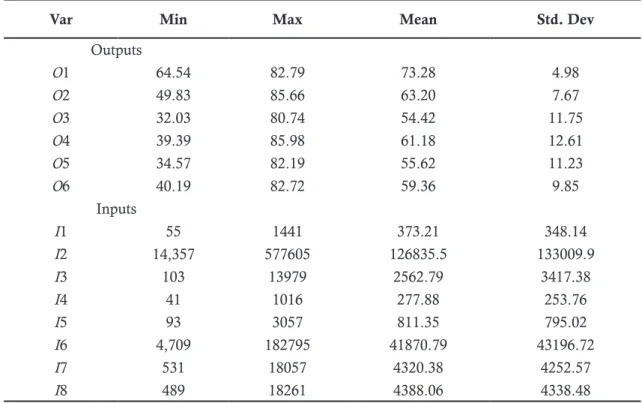
eight input variables (I). Furthermore, the study is based on high schools from a Science point of view, so the output variables are the average of national exams in the Science field of study. Tab-le 1 gives a general description for all the variabTab-les used in this study.
the Directorate of Senior Secondary Schools through basic educational data.
The calculation of efficiency scores using the DEA method is made for all provinces in In-donesia. 34 provinces are used as DMUs, which are analyzed by using six output variables (O) and
Table 2. Cumulative Distribution
Table 1. Descriptive Statistics
Var Min Max Mean Std. Dev
Outputs O1 64.54 82.79 73.28 4.98 O2 49.83 85.66 63.20 7.67 O3 32.03 80.74 54.42 11.75 O4 39.39 85.98 61.18 12.61 O5 34.57 82.19 55.62 11.23 O6 40.19 82.72 59.36 9.85 Inputs I1 55 1441 373.21 348.14 I2 14,357 577605 126835.5 133009.9 I3 103 13979 2562.79 3417.38 I4 41 1016 277.88 253.76 I5 93 3057 811.35 795.02 I6 4,709 182795 41870.79 43196.72 I7 531 18057 4320.38 4252.57 I8 489 18261 4388.06 4338.48
average of the Indonesian language (O1); that of the English language (O2); the average of mathe-matics (O3); of physics (O4), of chemistry (O5); and of biology (O6). Table 2 shows the cumula-tive distribution of the efficiency scores for tradi-tional DEA.
I1 indicates the number of schools; I2 the number of students; I3 the number of teachers;
I4 the number of libraries; I5 the number of labo-ratories; I6 the number of graduates; I7 the num-ber of classes; and I8 the number of classrooms. The output variables are the average of national exams in the Science field of study, namely the
Scores Total 1.000 11 0.950-0.999 3 0.900-0.949 12 0.850-0.899 4 0.800-0.849 2 <0.800 2 Total 34
The analysis results indicate that the ave-rage of the efficiency scores of Indonesia’s major political subdivisions in managing high school
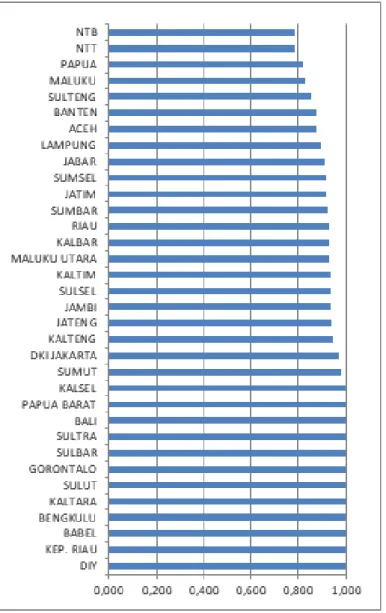
education is 0.936, with a standard deviation of 0.065. Figure 1 indicates the traditional DEA effi-ciency scores for all provinces in Indonesia.
Figure 1. Efficiency Scores
Jakarta requires 96.9 percent of the input variab-les to be able to carry out its activities.
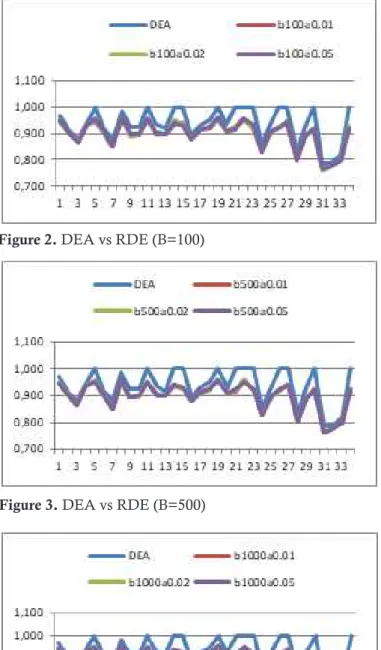
As previously mentioned, traditional DEA tends to provide biased efficiency scores. Besides, the actual data can be contaminated by outliers, which all the input variables contain. This stu-dy applies a robust approach of bias-corrected technical efficiency to DEA scores. Figure 2, 3 and 4 show a comparison of the efficiency scores for the 34 provinces in Indonesia using traditio-nal DEA and robust DEA, in which the number of bootstrap replications B = 100, 500 and 1000. Furthermore, this study uses the size of confiden-ce intervals for the bias-corrected DEA scores alpha = 0.01, 0.02 and 0.05.
32.35 percent of provinces show an effi-cient performance, with an efficiency score equal to one. Further, 17 provinces (50 percent) have efficiency scores above the average score. The lo-west efficiency score is 0.785, corresponding to West Nusa Tenggara.
Based on discrimination stages introdu-ced by Thanassoulis et al. (1987) then it is save report that the province of South Kalimantan should be able to sustain its activities to produce an optimum output using only 99.9 percent of the available inputs, whereas the province of North Sumatra should be able to carry out its activities with optimum results using 98.5 percent of the existing resources. The Special Capital Region of
Figure 2, 3 and 4 indicate that the efficien-cy scores of RDEA deliver consistent results, whose values always follow the technical efficien-cy scores of traditional DEA. The average of bias for naive DEA scores for all degrees of confiden-ce level (alpha) is classified as small; they have the same bias efficiency score, i.e. 0.04. Descriptive statistics of the RDEA efficiency scores are as follows. The average efficiency scores with repli-cation B=100 and alpha=0.01, 0.02 and 0.05 are (0.898, 0.899, 0.900), while the average
efficien-cy score with replication B=500 and alpha=0.01, 0.02 and 0.05 are (0.900, 0.900, 0.899). The ave-rage of efficiency scores with replication B=1000 and alpha=0.01, 0.02 and 0.05 are (0.899, 0.899, 0.900). Further, the standard deviation equals 0.05 for all the replications, as well as for the size of confidence interval. Moreover, the results also indicate that RDEA efficiency scores with num-ber of replications B= 100, 500 and 1000 and alpha = 0.01, 0.02 and 0.05 are within the confi-dence intervals.
Figure 2. DEA vs RDE (B=100)
Figure 3. DEA vs RDE (B=500)
CONCLUSION
This study used robust data envelopment analysis (RDEA) to investigate efficiency measu-rement when the actual data are contaminated by outliers, as the efficiency scores of traditional DEA are susceptible to bias. 34 provinces were used as DMUs, whose efficiencies were measu-red by using eight input variables and six output variables to evaluate technical efficiency in mana-ging high school education in Indonesia.
The results show that traditional DEA gi-ves 11 provinces efficiency scores equal to one, which indicates efficient performance. West Nusa Tenggara has the lowest efficiency score (0.785), while fifty percent, or 17 provinces, have efficien-cy scores above average. The study uses the num-ber of bootstrap replications B = 100, 500 and 1000, while the size of confidence interval = 0.01, 0.02 and 0.05. The results of RDEA reveal that its efficiency scores always follow the techni-cal efficiency scores of traditional DEA, with its scores within the confidence intervals. Further, the bias efficiency score for all confidence levels is classified as small (0.04). Overall, RDEA is ap-propriate for application to measure the efficien-cy of provincial governments in organizing high school education in Indonesia.
ACKNOWLEDGMENTS
The authors would like to thank the Center for Educational and Cultural Data and Statistics, Secretariat General, Ministry of Education and Culture of The Republic of Indonesia, which has allowed access to data for analysis purposes. The authors would also like to thank the editors for their comments and support during the review process.
REFERENCES
Banker, R. D., Charnes, A., & Cooper, W. W. (1984). Some models for estimating technical and scale inefficiencies in data envelopment analysis. Management science, 30(9), 1078-1092.
Barrow, M. M. (1991). Measuring local education au-thority performance: a frontier approach. Eco-nomics of Education Review, 10(1), 19-27. Ben-Tal, A., & Nemirovski, A. (2000). Robust
solu-tions of linear programming problems con-taminated with uncertain data. Mathematical programming, 88(3), 411-424.
Bertsimas, D., & Sim, M. (2003). Robust discrete opti-mization and network flows. Mathematical pro-gramming, 98(1-3), 49-71.
Besstremyannaya, G., Simm, J., & Golovan, S. (2014). Robust non-parametric estimation of cost efficiency with an application to banking industry. Working paper.
Bonesrønning, H., & Rattsø, J. (1994). Efficiency vari-ation among the Norwegian high schools: con-sequences of equalization policy. Economics of education review, 13(4), 289-304.
Carrington, R., Coelli, T. I. M., & Rao, D. S. (2005). The performance of Australian universities: Conceptual issues and preliminary results. Eco-nomic Papers: A journal of applied ecoEco-nomics and policy, 24(2), 145-163.
Charnes, A., Cooper, W. W., & Rhodes, E. (1978). Measuring the efficiency of decision making units. European journal of operational research, 2(6), 429-444.
Charnes, A., Haag, S., Jaska, P., & Semple, J. (1992). Sensitivity of efficiency classifications in the additive model of data envelopment analysis. International Journal of Systems Science, 23(5), 789-798.
Coelli, T. J., Rao, D. S. P., O’Donnell, C. J., & Battese, G. E. (2005). An introduction to efficiency and pro-ductivity analysis. Springer Science & Business Media.
Cooper, S. T., & Cohn, E. (1997). Estimation of a fron-tier production function for the South Carolina educational process. Economics of Education Re-view, 16(3), 313-327.
Cooper, W. W., Huang, Z., Lelas, V., Li, S. X., & Ole-sen, O. B. (1998). Chance constrained program-ming formulations for stochastic characteriza-tions of efficiency and dominance in DEA. Journal of Productivity Analysis, 9(1), 53-79. Dwianto, A., Wilujeng, I., Prasetyo, Z. K., &
Sury-adarma, I. G. (2017). The Development of Science Domain Based Learning Tool Which is Integrated with Local Wisdom to Improve Science Process Skill and Scientific Attitude. Jurnal Pendidikan IPA Indonesia, 6(1), 23-31. Efron, B. (1979). Bootstrap methods: another look at
the jackknife annals of statistics 7: 1–26. View Article PubMed/NCBI Google Scholar.
Farrell, M. J. (1957). The measurement of productive efficiency. Journal of the Royal Statistical Society. Series A (General), 120(3), 253-290.
Fatimah, S., & Mahmudah, U. (2017). Two-Stage Data Envelopment Analysis (DEA) for Measuring the Efficiency of Elementary Schools in Indo-nesia. International Journal of Environmental and Science Education.
Gstach, D. (1998). Another approach to data envelop-ment analysis in noisy environenvelop-ments: DEA+. Journal of Productivity Analysis, 9(2), 161-176. Kong, W. H., & Fu, T. T. (2012). Assessing the
per-formance of business colleges in Taiwan using data envelopment analysis and student based value-added performance indicators. Omega, 40(5), 541-549.
Mikušová, P. (2015). An application of DEA method-ology in efficiency measurement of the Czech public universities. Procedia Economics and Fi-nance, 25, 569-578.
Ministry of Education and Culture of Republic of Indonesia. 2016. Nilai Rata-rata Sekolah UN. Retrieved from https://data.go.id/dataset/ nilai-rata-rata-sekolah-un.
Nazarko, J., & Šaparauskas, J. (2014). Application of DEA method in efficiency evaluation of public higher education institutions. Technological and Economic development of Economy, 20(1), 25-44. Simar, L., & Wilson, P. W. (1998). Sensitivity analysis
of efficiency scores: How to bootstrap in non-parametric frontier models. Management science, 44(1), 49-61.
Simar, L., & Wilson, P. W. (2007). Estimation and in-ference in two-stage, semi-parametric models of production processes. Journal of econometrics, 136(1), 31-64.
Suhardi, D. (2017). Statistik Persekolahan Sekolah Menengah Atas (SMA) 2016/2017.
Thanassoulis, E., Dyson, R. G., & Foster, M. J. (1987). Relative efficiency assessments using data en-velopment analysis: an application to data on rates departments. Journal of the Operational Re-search Society, 38(5), 397-411.
Wilson, P. W. (1995). Detecting influential observa-tions in data envelopment analysis. Journal of productivity analysis, 6(1), 27-45.
Yusrizal, Y., Suliyanah, S., & Basri, T. H. (2017). Anal-ysis of Knowledge, Understanding and Skills of Physics Teachers of State Senior High Schools in Developing and Analyzing Test Items. Jurnal Pendidikan IPA Indonesia, 6(2), 335-340. Zhu, J. (1996). Robustness of the efficient DMUs in
data envelopment analysis. European Journal of operational research, 90(3), 451-460.