HAL Id: hal-02333489
https://hal.archives-ouvertes.fr/hal-02333489
Submitted on 29 Oct 2019HAL is a multi-disciplinary open access archive for the deposit and dissemination of sci-entific research documents, whether they are pub-lished or not. The documents may come from teaching and research institutions in France or abroad, or from public or private research centers.
L’archive ouverte pluridisciplinaire HAL, est destinée au dépôt et à la diffusion de documents scientifiques de niveau recherche, publiés ou non, émanant des établissements d’enseignement et de recherche français ou étrangers, des laboratoires publics ou privés.
Process-oriented Risk Assessment Methodology for
Manufacturing Processes Evaluation
Liaqat A. Shah, Alain Etienne, Ali Siadat, François Vernadat
To cite this version:
Liaqat A. Shah, Alain Etienne, Ali Siadat, François Vernadat. Process-oriented Risk Assessment Methodology for Manufacturing Processes Evaluation. International Journal of Production Research, Taylor & Francis, 2016, 55 (15), pp.4516-4529. �10.1080/00207543.2016.1268728�. �hal-02333489�
Process-oriented Risk Assessment Methodology for
Manufacturing Processes Evaluation
Abstract:
A process-oriented quantitative risk assessment methodology is proposed. Risks involved in a process and the corresponding risk factors are identified through a novel objective-oriented risk identification approach and analyzed qualitatively in the Process FMEA. Critical risks with high RPN (risk priority number) values identified in the FMEA are incorporated in the process model for further quantitative analysis in the simulation environment. To this end, risk measures of the critical risks are determined for which data is collected during simulation execution. Using the proposed methodology as a decision-making tool, alternative scenarios are developed and compared with each other as well as with two fictive situations to elicit normalized values for the risk measures employing value function approach. To ease the decision-making process in case of multiple risk measures, a global risk indicator is developed by aggregating the individual normalized risk measures through a 2-additive Choquet Integral operator. The global risk indicator is then used to rank the alternative scenarios on the basis of desirability. The methodology is illustrated with a case study issued from parts manufacturing but is applicable to a wide range of other processes.Keywords: Risk assessment, process modeling, objectives modeling, discrete event simulation and decision-making support system.
1. Introduction
In the process context, risk stems from uncertainty regarding the ability of a process to deliver “the value proposition”– and the consequences thereof. The value proposition refers to the implicit or explicit promise a company makes to its stakeholders to deliver a particular combination of values (Martinez, 2003). To make sure the promise would be delivered; process risks should be modeled and assessed to account for the uncertainties and their consequences on the “value proposition”. Risk management is carried out in the same spirit to protect and maximize the process value for its stakeholders (Shah et al. 2012; Sienou et al. 2008).
To deal with risk in product/system/project context, various tools and techniques have been developed so far. An exhaustive review of these tools and techniques can be found in the literature (Tixier et al., 2002; Moeller, 2007) and risk management standards (Knight, 2010;
L.A. Shah*; A.Etienne*; A.Siadat*; F.B.Vernadat** *LCFC, Arts et Métiers ParisTech; **LGIPM, University of Metz
ISO/IEC31010:2009). These techniques have different goals; some of them are used to evaluate multiple scenarios, depending on which risky event occurs such a decision tree, strength, weakness, opportunity and threat analysis (SWOT), SWIFT Analysis and What-If Analysis(Cagliano et al., 2015). Other techniques, instead, focus on the origins and implications of the risk events. Commonly used techniques in this category are: failure modes and effects analysis (Braaksma et al., 2012; Case et al., 2010), fault tree analysis(Cheng et al., 2013; Limnios, 2007), event tree analysis (Aven, 2008). In addition to these analytical techniques, Monte Carlo simulation provides a statistical approach towards risk assessment (Lee et al., 2013; Moghaddam, 2015; Mun, 2006).
These techniques have their strengths and weaknesses and are aimed at different application domains. For instance, FMEA is often used in aeronautical, automotive and other industries producing machinery, electronic or electro-mechanical components (Su and Chou, 2008). Hazard and Operability (HAZOP) technique, however, is commonly applied in the chemical industry (Dunjó et al., 2010; Labovskỳ et al., 2008). Furthermore, Hazard Analysis and Critical Control Points (HACCP) is developed specifically for the beverage and food industry (Pierson, 2012; Sun and Ockerman, 2005). Fault tree and event tree techniques have been applied widely in the nuclear power plants and also in the chemical industry (Groso et al., 2012). Similarly, the CREA (Clinical Risk and Error Analysis) technique is developed for medical domain (Trucco and Cavallin, 2006).
Irrespective of the application domain, often the risk analysis methods are developed to model and analyze risks from a subsystem perspective. A system is reduced to subsystems or component parts and each part is then dealt independently. For example, in FMEA only one component is considered at a time and the rest are assumed to work perfectly. Therefore, the method is not suitable to model critical combinations of component failures (Aven, 2008, p. 64). Same is the case with many of the risk assessment techniques (Groso et al., 2012). However, a failure may not happen because of one risk event but a combination of mutually inclusive risk events may lead to one or more failures (Shah, 2013).
To address this issue, one way is to approach the risk assessment problem via process modeling and simulation. Because processes are everywhere no matter what organization or scenario one chooses. They manifest whenever a service or product is delivered. Among the many benefits of
process-based initiatives are process improvement, process analysis for possible problems and issues and performance measurement (Indulska et al., 2009). But, the risk management discipline and thus the techniques thereof have been developed separately from the operational concern of the business processes (i.e. manufacturing, sales, inventory management etc.). Although risk is the element that can affect (business) process negatively, it is still managed independently (Shah, 2013). A sufficient link is missing between process and quantitative risk models(Scott and Vessey, 2002). To better manage risk of a process, it should be integrated, and evaluated dynamically (through simulation) within the process to account for the uncertainties and chain of events intertwined with activities of a process.
Recently, some research work has been carried out to either treat process risk or integrate risk in the process perspective. Two streams of studies have emerged: the management of risk in (business) processes (Cope et al., 2010; Neiger et al., 2009; Sienou et al., 2008; Suriadi et al., 2014) and process-based risk management (Kayis et al., 2007; Cha et al., 2009; Kusiak and Zakarian, 1996; Sackmann, 2008; Yu, 2011). The former is called risk-aware business process management and the latter is process-oriented risk management. In any case, this convergence of risk management and process management is a positive development for maximizing the value of the process. It is not surprising given the tendency of process based organization design in the last two decades (Aguilar-Savén, 2004; Dumas, 2013; Hammer and Champy, 2003). Furthermore, the importance of such a research has also been confirmed in a number of studies (Becker et al., 2010; Chapman, 2006; Rikhardsson et al., 2006). Nevertheless, the research and practice of risk management in association with processes is still very limited and requires further exploration. The proposed techniques have not yet made inroads into the industry despite the fact that process based management and frameworks are widely practiced nowadays (e.g. supply chain operations reference model, SAP ERP system).
To advance the theory of risk in the process context, this study proposes a process-based risk management methodology. The central theme of the study is to provide methods and techniques for risk assessment and management for process-based organizations. The methodology draws on, for the most part, the risk modeling concepts in the process context for the risk measurement model from the literature (Larson and Kusiak, 1996) and extends it to integrate risk identification, evaluation and decision-making mechanisms to better manage risk of industrial systems.
2. RISK MEASUREMENT MODEL
In the process perspective, uncertainty lies “internally” and “externally” to the activity in the form of risk factors. External risk factors can be machine breakdown, unreliable supplier, natural disaster etc. Internal risk factors of an activity is associated to the uncertainty regarding the estimation of its work content (Salah., 2005). For instance, assigning an activity (operation) having low capability index to meet a specific objective (e.g. specification of a product) or underestimating activity duration. Whether external or internal, a risk factor can trigger the occurrence of any undesirable events that ultimately affect the activity progress towards objective(s) attainment (cf. Figure 1).
Risk factor Risk event Objective
Causes Influences
1*… 1*… 1*… 1*…
Figure 1: Risk factors and objectives relationship (Vernadat et al., 2013)
It is therefore essential to identify and then assess the impact of risk events originating from the risk factors (both external and internal) on the defined process objectives. For this purpose, risk 𝑅, in the first place, is parameterized in terms of risk scenario 𝑆, likelihood 𝑃 and consequence 𝐶 as expressed by Equation 1:
𝑅 = (𝑆, 𝑃, 𝐶) (1)
Next, it is modeled and assessed in the activity environment. The underlying assumption for activity-based risk assessment is that each activity in a process is exposed to risk factors RFi, ( 𝑖 = 1, … . , 𝑛) and thus can trigger one to many risk events, which in turn can affect the fulfilment of process objectives (as illustrated in Figure 2).
Output
Input
Control
Risk Factors
Objectives
Activity
Mechanism
Figure 2: Activity exposure to risk factors
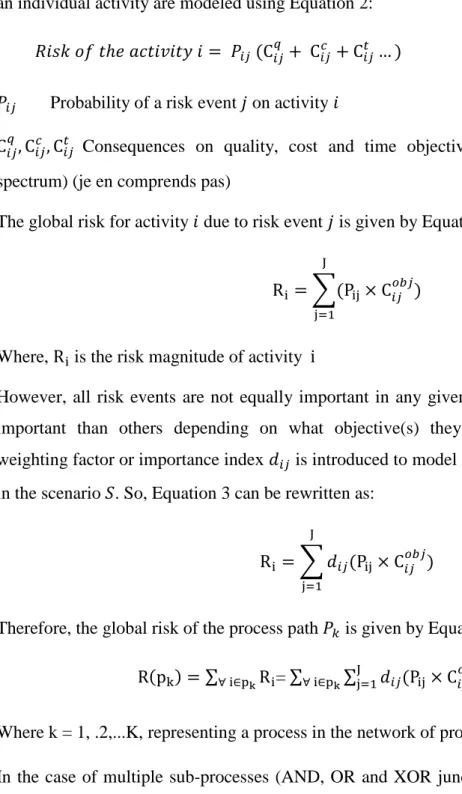
To quantify the process risks 𝑅𝑖, the likelihood of a risk event multiplied by its consequences on an individual activity are modeled using Equation 2:
𝑅𝑖𝑠𝑘 𝑜𝑓 𝑡ℎ𝑒 𝑎𝑐𝑡𝑖𝑣𝑖𝑡𝑦 𝑖 = 𝑃𝑖𝑗 (C𝑖𝑗𝑞 + C𝑖𝑗𝑐 + C𝑖𝑗𝑡 … ) (2)
𝑃𝑖𝑗 Probability of a risk event 𝑗 on activity 𝑖
C𝑖𝑗𝑞, C𝑖𝑗𝑐, C𝑖𝑗𝑡 Consequences on quality, cost and time objectives, respectively [consequences spectrum) (je en comprends pas)
The global risk for activity 𝑖 due to risk event 𝑗 is given by Equation 3:
Ri = ∑(Pij× C𝑖𝑗 𝑜𝑏𝑗 ) J j=1 (3)
Where, Ri is the risk magnitude of activity i
However, all risk events are not equally important in any given scenario. Some risks are more important than others depending on what objective(s) they are influencing. Therefore, a weighting factor or importance index 𝑑𝑖𝑗 is introduced to model the importance of the risk events in the scenario 𝑆. So, Equation 3 can be rewritten as:
Ri = ∑ 𝑑𝑖𝑗(Pij× C𝑖𝑗𝑜𝑏𝑗)
J
j=1
(4)
Therefore, the global risk of the process path 𝑃𝑘 is given by Equation 5:
R(pk) = ∑∀ i∈pkRi= ∑∀ i∈pk∑Jj=1𝑑𝑖𝑗(Pij× C𝑖𝑗𝑜𝑏𝑗) (5) Where k = 1, .2,…K, representing a process in the network of processes (scenarios)
In the case of multiple sub-processes (AND, OR and XOR junctions in the context of IDEF3), special cases apply.
In the case of multiple parallel sub-processes (AND junction), since all successor activities immediately after the junction are performed, so the probability 𝑃𝑟(𝑃𝑘) of occurrence of each
path set 𝑃𝑘 is one, so Equation (5) is applied to all possible path set (parallel sub-processes) in order to calculate the process risk of the scenario understudy.
For mutually exclusive alternative sub-processes (XOR Junction), since only one subsequent sub-process after branching can be performed, the summation of all probabilities of occurrence of the sub-processes therefore should be equal to 1. So the probability of the path set (or scenario) in the mutually exclusive setting is such that:
∑ 𝑃𝑟(𝑃𝑘)
K
k=1
= 1 (6)
So, the expected risk of the process 𝑃 made of 𝐾 path sets is:
𝐸(𝑅𝑝) = ∑ 𝑃𝑟(𝑃𝑘) K k=1 ( ∑ ∑ 𝑑𝑖𝑗(Pij× C𝑖𝑗𝑜𝑏𝑗) J j=1 ∀ i∈pk ) (7)
Regarding mutually inclusive alternative sub-processes (OR Junction), the probability (𝑃𝑟) of any process 𝑘 after branching is unconditional and is calculated differently. If the number of alternative sub-processes (𝑁) after branching is greater than 2, then there are 2𝑁−1 combinations of subsequent sub-processes. Let us assume that 𝑈𝑗 is the set containing sub-processes in combination 𝑗 and 𝑀 is the total number of all possible combinations thus the probability of performing only one subsequent sub-process in a combination 𝑗,𝑃𝑟(𝐶𝑗) is calculated from Bayes’ formula in Equation(8)
Pr(𝑈𝑗) =∏∀𝑖∈𝐶𝑗𝑃𝑖 × ∏∀𝑖∉𝐶𝑗(1 − 𝑃𝑖) 1 − ∏𝑁 (1 − 𝑃𝑖)
𝑖=1
(8) So the process risk for the whole process becomes;
𝐸(𝑅𝑝) = Pr(𝑈𝑗) ∗ ( ∑ ∑ 𝑑𝑖𝑗(Pij× C𝑖𝑗𝑜𝑏𝑗)
J
j=1 ∀ i∈pk
) (9)
It is highly likely that a single scenario have both the conjunctive and disjunctive (inclusive and exclusive) branching and therefore a combination of Equations (5), (7) and (9) are used to model the risk of the whole scenario.
3. RISK ASSESSMENT METHODOLOGY
Having defined the mathematical model for risk measurement in process setup, a risk assessment methodology is presented in this section. The proposed methodology relies on modeling, simulation and decision-making approaches and establishes a risk management process consisting of the following three phases:
1. Context establishment 2. Risk modeling and analysis 3. Risk analysis via simulation
Risk monitoring and control phase is not included in the methodology because the current study focus is solely on the risk assessment. The assessment phase consists of risk identification and risk evaluation. The risk assessment phase is supported with process analysis technique such as simulation. Each phase of the methodology is detailed in the following subsections.
3.1 Context establishment phase
Context is about defining external and internal parameters to be considered when managing risk and setting the scope and risk criteria for the risk management policy (ISO Guide 73:2009). In the framework of the current methodology, the context establishment phase identifies the application domain, the stakeholders of the process, their roles and responsibilities as well as the upper and lower bounds for each stakeholder’s expectations and concerns. Moreover, the focus of the risk assessment is also determined in the context establishment phase; whether the assessment is about a project or a business activity, merger or acquisition or overseeing a new production facility (Chapman, 2006, p. 109).
In the framework of the current study, the context for risk management is set up using process models which are further enriched with statements about assets (name, value, type, and risk tolerance), stakeholders and relations between assets and stakeholders in terms of interest including stakeholders appetite of each stakeholder (Sienou et al., 2008).
3.2 Risk modelling and analysis phase
To account for risks in processes, the current methodology proposes a two pronged strategy: objectives-driven risk identification, and activity-based approach to risk assessment. The objective-driven approach is important because risk cannot be ascertained fully if objectives are
unclear as risk by definition is the effect of uncertainty on business objectives (ISO 31000:2009). However, risk evaluation without (temporal) contextual information is incomplete and the process models enriched with additional statements are therefore required to establish the context.
3.2.1 Objectives-oriented risk identification
The general approach to risk identification starts with objectives identification (COSO, 2007). Relying on this theory, an objective-driven approach to risk identification is to find an assertion that obstructs the objectives attainment. For instance, if the global objective of a process is to satisfy customer order, then the corresponding global risk would be: “failure to satisfy customer order”. Many possible dimensions of the global risk are identified by decomposing it into lower level risks while employing principles of Value Focused Thinking (VFT), a decision-making methodology developed by Keeney (1992).
Within the VFT framework, an objective is “a statement of something that one wants to strive toward” (Keeney, 1994). Keeney categorizes objectives into fundamental and means objectives. The former concerns the ends that the decision-makers (DM) value in a specific decision context, whereas the latter refers to the “methods to achieve fundamental objectives”. For detail review and applications of VFT, the interested reader is referred to (Parnell et al. 2013).
In the context of risk management, the fundamental objectives of the VFT are “risk objectives” whereas, the means objectives will be termed “risk factors”. Because, the theme of the risk management is to “minimize certain risk” and here the minimization has a preference orientation so it is an objective per VFT technique. Also, similar to means objectives, which are the ways to achieve the fundamental objectives, risk factors are the means that determine the likelihood of a risk occurrence. A chain/network of risk factors contributes to risk objectives in the risk hierarchy. For the sake of simplicity, risk objective is simply called risk in the current study. To apply VFT for risk identification and structuring, the principle of “specification” is used. Specification generally aims to break down an objective into logical parts (Keeney, 1996, p. 68). A simple question: “What do you mean by that” is sufficient to specify, refine and characterize the upper level risk into lower level. This decomposition mechanism transforms global risk into more measurable risks while keeping in view the objectives of the process understudy. For example, the question “what do you mean by failure to satisfy customer order?” brings forward
lower level risks such as technical performance risk, incomplete order fulfillment risk, schedule risk and cost overrun, which correspond to quality, reliability, on-time delivery and cost objectives of the process. To refine further, schedule risk means delay in order processing, manufacturing and logistic or distribution. Each part (tasks) of the process (order satisfaction) has its own deliverables and associated risks. It is noteworthy that each risk on the lower level is a dimension or specification of the upper level risk and assumed to holds the axiom of preferential independent (Kirkwood and Sarin, 1980). That is risk of order processing is independent of logistic risk and also of manufacturing related risks. But all risks when added together contribute to scheduling risk. Figure 3 shows a risk hierarchy for customer order satisfaction process.
Failure to satisfy
customer order
Performance
risk
Schedule risk
Cost
overrun
Logistics
risk
Mfg. delay
Order processing
delay
Incomplete
order delivery
Figure 3: Risk hierarchy
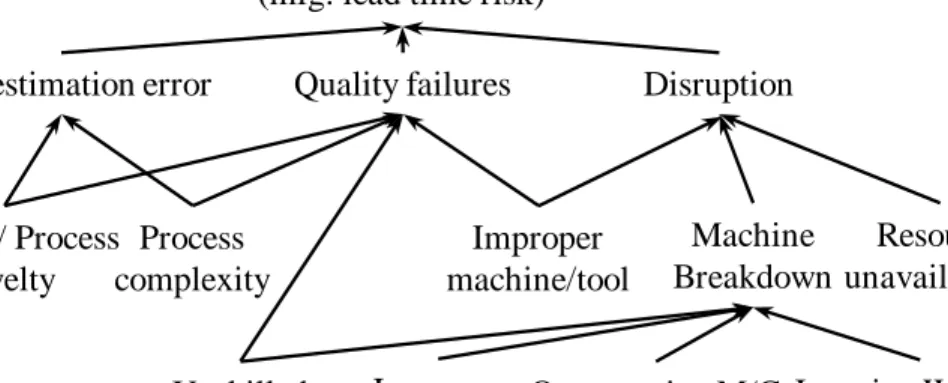
“What causes the risk event to occur?” brings forward the factors for each risk in the lower tier of the risk hierarchy (cf. Figure 3). For instance, the manufacturing delay is a fundamental risk but can be triggered by frequent quality failures. So, quality failures are the means (contributing factor) to the manufacturing delay. Other risk factors can be disruption (machine breakdown) which is further related to other risk factors such as improper machine maintenance, overrunning machine capability, ignoring warning signals etc. such are the factors which form chain/network and contribute to machine breakdown. However, machine breakdown is not a fundamental risk per se but a factor to major risk such as manufacturing delay which affects the customer satisfaction objective. In a similar way, risk factors are identified for cost overrun and technical performance. Once done, a network of risk factors is formed and is linked to the objective risk as shown in Figure 4
Manufacturing delay (mfg. lead time risk)
Quality failures
Time estimation error Disruption
Improper machine/tool Resource unavailability Process complexity Product/ Process novelty Unskilled operator Machine Breakdown Improper maintenance Overrunning M/C capability Ignoring Warning Signal Figure 4: Risk factors network for manufacturing lead time risk
Risk factors identification is mandatory for risk monitoring and control. To minimize the
probability of risk happening, risk factors should be identified, prioritized and mitigation actions should be developed.
The risk hierarchy and risk factor networks are sufficient to map all the relevant risks and their causes in any given scenario. However, the identified risks with their risk factors cannot be assessed because they lack the contextual information. For this purpose, they are further investigated in the (business) process environment where they may happen.
3.2.2 Process-based risk analysis
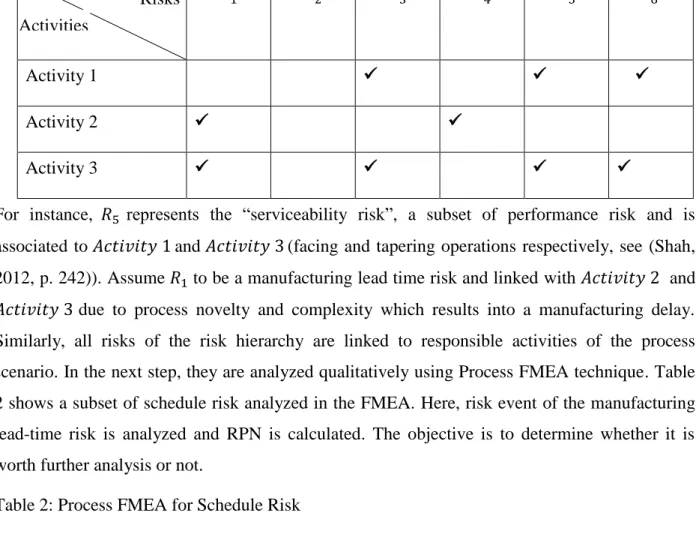
The identified risks of the risk hierarchy are assessed using the FMEA technique. For this reason, the required contextual information is obtained from the process model. Because the process model contains sufficient information regarding the execution of the activities and their environment, they are therefore consulted when analyzing a particular risk. For instance, without knowing the type of machine/tool and operator to be employed to machine a critical feature of a mechanical part, it is difficult to know whether the risk may be triggered or not and, hence, risk assessment cannot be performed. It is therefore essential to identify those activities responsible for (in the case of internal risk factors) or prune to (in the case of external risk factors) the identified risks. To this end, a risk/activity matrix is developed which links the risks of the risk hierarchy to the activities of the process model (cf. Table 1).
𝑅1 𝑅2 𝑅3 𝑅4 𝑅5 𝑅6
Activity 1
Activity 2
Activity 3
For instance, 𝑅5 represents the “serviceability risk”, a subset of performance risk and is associated to 𝐴𝑐𝑡𝑖𝑣𝑖𝑡𝑦 1and 𝐴𝑐𝑡𝑖𝑣𝑖𝑡𝑦 3(facing and tapering operations respectively, see (Shah, 2012, p. 242)). Assume 𝑅1 to be a manufacturing lead time risk and linked with 𝐴𝑐𝑡𝑖𝑣𝑖𝑡𝑦 2 and
𝐴𝑐𝑡𝑖𝑣𝑖𝑡𝑦 3 due to process novelty and complexity which results into a manufacturing delay. Similarly, all risks of the risk hierarchy are linked to responsible activities of the process scenario. In the next step, they are analyzed qualitatively using Process FMEA technique. Table 2 shows a subset of schedule risk analyzed in the FMEA. Here, risk event of the manufacturing lead-time risk is analyzed and RPN is calculated. The objective is to determine whether it is worth further analysis or not.
Table 2: Process FMEA for Schedule Risk
Process Failure mode Causes Effects P C D RPN Activity i Duration estimation error Process - novelty - complexity Uncertain lead time 5 7 6 210
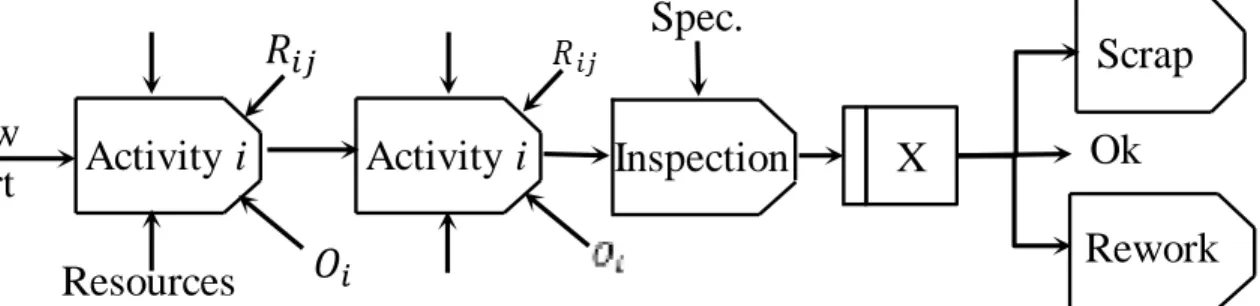
By analyzing qualitatively risk events in the PFMEA Table, the most critical ones are then integrated into the process model for quantitative analysis in the simulation environment as shown in
Figure 5. 5 (pb) Activities
Raw
part
Resources
Activity
i
Activity
i
X
Rework
Ok
Scrap
Spec.
𝑅
𝑖𝑗 𝑖Inspection
Figure 5: Excerpt from a risk aware manufacturing process plan model
To analyze risk events of the process model quantitatively, the risk measurement model described in section 2 is employed in simulation experiment.
3.3 Risk analysis via simulation phase
Quantitative risk evaluation requires quantitative data regarding risk event parameters which can be obtained from the historical records employing statistical analysis (Ahmed et al. 2007). However, in the a priori evaluation of processes, such data do not usually exist. If they exist, they are either not enough or not in the shape to be used. In such circumstances, simulation is the right tool that can generate sufficient data regarding risk parameters that the simulation model can use later to estimate risk measures. To carry out simulation experiments for this purpose, input data for simulation are generated.
Input data gathering: The input data required for risk analysis in the simulation environment can be divided into three categories: functional data (activities), parameters to make the conceptual process model executable and risk evaluation methods. The former data are obtained in the context establishment phase by process modeling of the scenario using IDEF3 method. For the parameters, it is advisable to divide them into several categories such as run parameters (job arrival law, arrival type: batch or single entity arrival, warm-up period and so on) process plan parameters (i.e. operation times) and objectives related parameters (i.e. order quantity) as described in (Shah et al., 2012; Shah, 2012). Concerning the evaluation methods (see Table 3), they are formula required to analyze the scenario.
Table 3: Evaluation Methods
Cost overrun 𝑅𝑐(𝑃𝑃𝑘) = ∑ 𝑃𝑖(𝐶𝑖 > 𝑈𝐵) ∗ 𝐶(𝑥) 𝑛 𝑖=1 Schedule Risk 𝑅𝑠(𝑃𝑃𝑘) = ∑ 𝑃𝑖(𝐶𝑖 > 𝑑𝑢𝑒𝑑𝑎𝑡𝑒) ∗ 𝐶(𝑥) 𝑛 𝑖=1 Quality Risk 𝑅𝑞(𝑃𝑃𝑘) = ∑ 𝑃𝑖(𝑄𝑖 ≠ 𝑆𝑝𝑒𝑐𝑠) ∗ 𝐶 𝑛 𝑖=1
For computing the risk of cost overrun, an upper bound (UB) for the cost is defined. Cost values falling beyond the upper bound will trigger risk event; however, its impact is a function of 𝑥 i.e. deviation of the outcome from the upper bound. The more the value deviates, the higher is the risk. It may be a linear or non-linear function to a point beyond which the impact can grow exponentially. Same is the case for the schedule risk. A customer can wait for an order to arrive up to certain time beyond that either the penalty applies (a function of 𝑥; where 𝑥 is delay time after due date). For the quality risk, product specifications are important. Tolerances are defined and any feature beyond tolerance may impact the proper functioning of a part or product as a whole and hence the improper tolerance can trigger a performance or technical risk.
Simulation experimentations and output data collection: Having defined the input data, the risk aware process model (conceptual model) is transformed into a simulation model. The simulation parameters and evaluation method are fed into the simulation model. In the probabilistic setup, the simulation model generates random data for each parameter and estimates risk measures of interest (cf. Table 3). They are used in the risk evaluation phase to pass on judgment on each risk measure w.r.t the defined risk criteria.
In the case of multiple risk measures of heterogeneous nature (cost vs. time), it is advisable to develop a commensurate scale defined on the interval [0,1]. The evaluation, then, of different risk measures will make sense. Multi-criteria decision making techniques can be employed for the purpose.
4. Risks evaluation and aggregation via multi-criteria decision-making phase
Risk evaluation means estimating significance or judging the acceptability of the risk. The significance or judgment of a risk can only be established when compared against its target value, upper and lower bounds. In addition, risk measures obtained from simulation experiments are heterogeneous in nature and most often large in numbers. Therefore, it is desirable to consider multiple criteria decision-making technique(s) which develops a normalized value function (also called utility function) for each risk measure. This is carried out by comparing each risk measure against its UB and LB. It also set the stage for aggregation of the normalized risk measures (henceforth, risk expressions) to facilitate decision-making process.
In the multi-criteria model of the current methodology, risk measures are normalized using the MACBETH method. Determination of interaction among risk measures is carried out using Choquet capacity while aggregation is performed using the 2-additive Choquet integral.
4.1 MACBETH
MACBETH (Measuring Attractiveness by a Categorical Based Evaluation TecHnique) is a multi-criteria decision analysis approach used to determine value functions as well as aggregated ones while comparing different scenarios (Bane e Costa and Vansnick, 1999). Similar to value functions, risk functions set reflects decision-makers’ (DMs) preferences or judgments of risk criteria with reference to fictive situations. Two situations are compared pairwise for a risk criterion and thus ordinal information is obtained, which is then transformed into cardinal information through “difference of attractiveness”. The preference through difference of attractiveness is quite natural to decision-makers who usually rely on verbal levels of attractiveness such as {null, very weak, weak, moderate, strong, very strong, extreme} (Bana e Costa and Vansnick, 1994). Details about the MACBETH method application can be found in the literature (Cliville et al., 2007).
In the current study, the MACBETH procedure is used to develop risk expressions 𝑟𝑖
(normalized value of individual risk of 𝑅𝑖) by solving inter criteria commensurability issue and to map them on a [0, 1] scale. Because MACBETH relies on the weighted mean to aggregate risk expressions, which is often not the case in real-life examples where criteria may interact, the Choquet integral has been chosen as the operator for the aggregation of risk expressions. It can handle interdependencies among different risk functions through Choquet capacity.
4.2 Choquet Integral (CI)
To aggregate the risk functions 𝑟𝑖, the following 2-additive Choquet integral mathematical model is used (Grabisch et al., 2008):
Cu(x) = ∑ viri−1 2 n i=1 ∑ Iij|ri− rj| n i=1 (10)
Where 𝐶𝑢 models vectors of risk expressions 𝑟𝑖, 𝑣𝑖 denotes a Shapely index with ∑𝑛𝑖=1𝑣𝑖 = 1
that represents importance of risk expression 𝑟𝑖 relative to all other risks expressions and 𝐼𝑖𝑗, interaction between risk expressions (𝑟𝑖, 𝑟𝑗), ranging in [-1,1]. To calculate the unknown CI parameters (𝑣𝑖 & 𝐼𝑖𝑗), two fictive situation are considered besides alternative processes and are ranked pairwise and individually (Clivillé et al., 2007; Shah, 2013). A preference ranking of these situations along with the strength of preferences gives a system of equations whose solution determines the Choquet Integral parameters.
In such preference modeling, the alternatives satisfy one or two risk expressions simultaneously. The situations where only one 𝑅𝑖 = 1 and all others are equal to zero, the aggregated value is as follows: R𝑖𝑎𝑔 = 𝑣 𝑖 − 1 2∑ 𝐼𝑖𝑗 𝑛 𝑗=1 𝑗≠𝑖 (11)
The aggregated value of the situations where one 𝑅𝑖 =0 and all other equals to 1 will be as follows: R𝑖𝑎𝑔 = 1 − 𝑣𝑖 −1 2∑ 𝐼𝑖𝑗 𝑛 𝑗=1 𝑗≠𝑖 (12)
In brief, the decision-making techniques are used to solve the following problem
𝑉(𝑅) = 𝐹(𝑣(𝑟1) + 𝑣(𝑟2) … 𝑣(𝑟𝑛)) (13) Where,
𝑣(𝑟) Risk function (risk expression)
𝑉(𝑅) Global risk function (global risk indicator)
𝐹 Aggregation operator (CI)
𝑣(𝑥) or simply 𝑥𝑖 are determined using the MACBETH procedure while the operator 𝐹 (Choquet Integral in the current study) is employed to aggregate the risk expressions to form global risk indicator.
5. APPLICATION
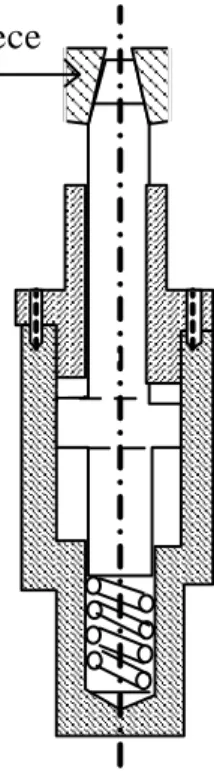
The methodology is illustrated on a case study about a manufacturing company that designs and fabricates product on make-to-order (MTO) basis. The reference product for this case study is a mechanical locator (Figure 6), a work holding device used for centering of job on a machine-tool. Axle Cap Body Spring Bolt Loaded workpiece clamped
Figure 6: Mechanical Locator
To illustrate the use of the proposed methodology within the company, a manufacturing scenario is defined.
5.1 Case study: Manufacturing Scenario
The company under study receives an order for 200 high quality mechanical locators from a customer with a lead time of two weeks (10 working days). The price of the product is kept at
$14 /per unit. So, the most critical objective in the scenario is technical performance of the product, measured in terms of satisfaction index (q) (Anselmetti, 2008).
The company has sufficient resources at its disposal, therefore parts: axle, body and cap are machined at the facility while springs and bolts are purchased from the market. We assume that all raw materials and the purchased parts are available whenever needed.
Failing to satisfy the customer order will cause penalty cost. A product having satisfaction index below 0.8 are rejected. In case of delay after the tolerance period (2 days), the company has to pay $2/unit time tardiness up to 5 working days for each product, beyond this period the order is cancelled and backlog cost of $10 per unit is paid. In addition, upper bound cost is set to $18.) Having described the manufacturing scenario, the proposed risk assessment methodology is then applied to determine the level of risk involved in the scenario.
5.2 Application of the methodology to the mfg. scenario
To assess risks involved in the manufacturing scenario, the company generates manufacturing process plans for the reference product. For this purpose, the methodology described in Sormaz and Khoshnevis (2003) have been adopted. To develop alternative process plans, the product is decomposed into geometrical features. To manufacture each feature, process candidates are selected using inquiries to the appropriate knowledge base of the manufacturing processes. Once the process plans are generated, they are then modelled using IDEF3 modelling method.
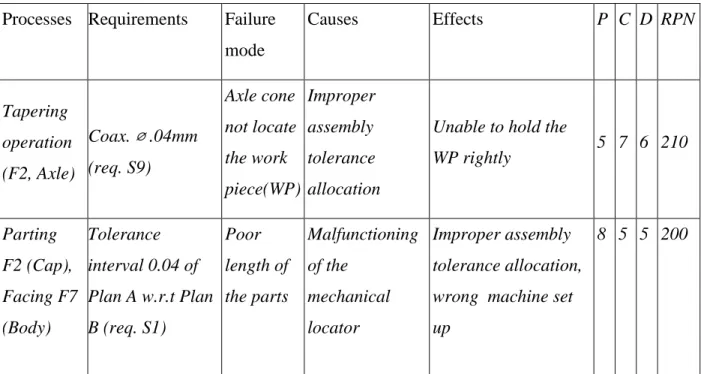
To identify risks and the corresponding risk factors, objectives-oriented risk identification approach is used. A global risk: “failure to satisfy customer order” for the scenario is fixed and decomposed into schedule risk, cost overrun and performance risk. Since critical objective for the customer order fulfillment is the technical performance of the product, therefore, this facet of the risk is further decomposed into more refined facets. In the second step, risk factors for each identified risk are determined. The identified risks and risk factors are then structured into risk hierarchy and risk network respectively similar to Figure 3 and Figure 4. To determine risk parameters for the risk events, they are first contextualized using activity/risk matrix. Once linked, they are then analyzed in the process FMEA Table (cf. Table 4)
Processes Requirements Failure mode Causes Effects P C D RPN Tapering operation (F2, Axle) Coax. ⌀ .04mm (req. S9) Axle cone not locate the work piece(WP) Improper assembly tolerance allocation
Unable to hold the
WP rightly 5 7 6 210 Parting F2 (Cap), Facing F7 (Body) Tolerance interval 0.04 of Plan A w.r.t Plan B (req. S1) Poor length of the parts Malfunctioning of the mechanical locator Improper assembly tolerance allocation, wrong machine set
up
8 5 5 200
High RPN risks are integrated into the process plan model for further analysis in the simulation environment. To calculate the probability of a risk event, it is sufficient to observe and record at a critical activity (whose risk is of concern) in the simulation model; the number of times the activity objective is not achieved divided by the total number of observations made. For determining the impact of a risk event, an impact function 𝑦 = 𝑓(𝑥) is calculated. For example, in case of delay, the formula: 𝑦 = 𝑎. 𝑒𝑏𝑥 is employed where a and b are the coefficients and 𝑥 is the dependent variable indicating the range which exceeds the due date. Similarly, the cost impact function is calculated assuming a quadratic function (i.e. per unit cost overrun 𝑥 has an impact 𝑥2). For the quality failure impact, the severity scale of the FMEA is used.
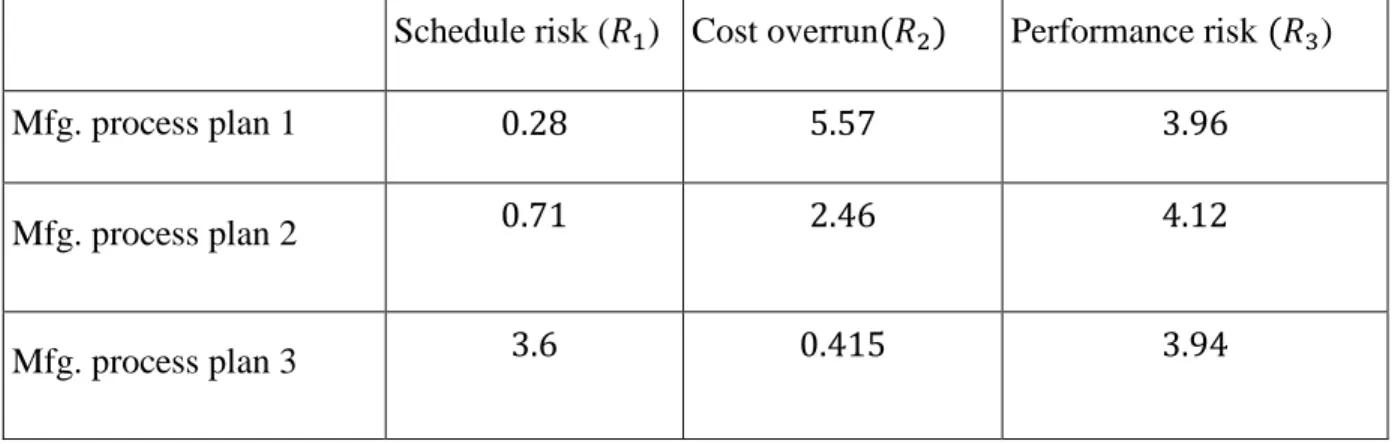
For quantitative analysis of the risk events, the risk aware process plan models are transformed into executable simulation models. They are then simulated using the discrete event simulation software: Rockwell ARENA v.13.5. Ten independent replications for each process plan were run. In each replication run, process plan and scenario related parameters were loaded into the simulation model and risk measures estimates are obtained as presented in Table 5.
Schedule risk (𝑅1) Cost overrun(𝑅2) Performance risk (𝑅3)
Mfg. process plan 1 0.28 5.57 3.96
Mfg. process plan 2 0.71 2.46 4.12
Mfg. process plan 3 3.6 0.415 3.94
Since risk measures obtained from simulation experimentations are simply numbers they carry no clear meaning. They are therefore normalized for solving the issue of commensurability among risk measures. For this purpose, first, two fictive situations representing upper and lower bounds for each measure are defined. (In the case of cost, SIB “Smaller Is Better” means the lesser the cost, the better the utility and for the quality, NIB “Nominal Is Better” means the target value or nominal is preferable). So “Good” situation means SIB for cost and schedule while NIB for quality. Next, process plans and the two fictive situations are ranked in the desirability order along with strength of preferences (ℎ𝑖 , 𝑖 = 1 𝑡𝑜 6) as follow:
𝑅1 ⇒ 𝐺𝑜𝑜𝑑 >1 𝑃𝑃1 >2 𝑃𝑃2 >5 𝑃𝑃3 >1 𝑁𝑒𝑢𝑡𝑟𝑎𝑙
𝑅2 ⇒ 𝐺𝑜𝑜𝑑 >1 𝑃𝑃3 >4 𝑃𝑃2 >5 𝑃𝑃1 >1 𝑁𝑒𝑢𝑡𝑟𝑎𝑙 𝑅3 ⇒ 𝐺𝑜𝑜𝑑 >3 𝑃𝑃3 >1 𝑃𝑃1 >2 𝑃𝑃2 >1 𝑁𝑒𝑢𝑡𝑟𝑎𝑙
The preference modeling information is next transformed into risk expressions using MACBETH procedure. The resulting risk expressions are then populated in Table 6.
Table 6: Risk expressions (normalized risk measures from MACBETH)
𝑅1 expression 𝑅2 expression 𝑅3 expression
Mfg. process plan 1 0.12 0.98 0.66
Mfg. process plan 2 0.38 0.57 0.78
Risk expressions 𝑟𝑖 as well as the CI parameters (𝑣𝑖 & 𝐼𝑖𝑗) identified via Equations (11) & (12)are put in Equation (10) and global risk for each process plan is calculated (
Table 7).
Table 7: global risk indicator for manufacturing process plans
Global Risk 𝐼𝑖𝑗 & 𝑣𝑖 for risk measures
𝐼𝑖𝑗 𝑣𝑖
Manufacturing process plan 1 𝟎. 𝟓𝟑 𝐼12= 0.09 𝑣1 = 0.34
Manufacturing process plan 2 𝟎. 𝟓𝟗 𝐼13= 0.13 𝑣2 = 0.18 Manufacturing process plan 3 𝟎. 𝟓𝟔 𝐼23 = 0.10 𝑣3 = 0.48
From
Table 7, it can be concluded that manufacturing process plan 1 involves the least risk (0.53) followed by process plan 3 (0.56) and process plan 2 with a maximum risk score of 0.59.
Furthermore, the technical performance being the critical risk in the scenario carries more weight with a Shapley index of (0.48) followed by schedule risk (0.34) and cost overrun (0.18). Similarly, the interaction among schedule & cost, schedule & performance, and cost & performance risks are respectively 0.09, 0.13 and 0.10. A comparatively high positive interaction effect is observed between schedule and quality (performance) risks (i.e. 0.13), this is because quality failures lead to manufacturing delay.
6. CONCLUSIONS AND FUTURE WORK
A process-oriented risk assessment methodology for manufacturing processes has been presented. The methodology establishes a risk identification and process and provides tools and techniques to develop a global risk indicator that can be used a decision-making tool to rank alternative manufacturing processes on the basis of desirability. The methodology is tested with a case study which supports both its conceptual and operational validity. Moreover, the current study stresses on the need to identify major or global risk and then decompose them using specification principle of the Value Focused Thinking technique (VFT). The decomposition of global risk into lower level risks and then identification of the risk factors and linkage of the latter with the former provides a risk structure for the scenario understudy. The risk structuring alone provides an insight and can help risk manager while devising mitigation plans.
In authors’ view, risk identification is the most crucial part to any risk management activity, however it is mostly ignored in many risk assessment techniques. Brainstorming and historical data are the tools mostly used for risk profiling but a systematic approach to risk identification is missing in the literature. The current study proposes the risk identification process using objective-driven approach and integrates it with other assessment techniques—process model, FMEA and simulation techniques. For evaluation and ease of decision-making, the risk measures are normalized and aggregated. Although long the methodology is reasonably thorough and handy regarding assessment of risks in the process context.
To further enhance the applicability of the methodology, it will be extended to model the causality relationship between risk factors and risk events via Bayesian network. In addition, cost effective risk mitigation strategy will be incorporated. A risk acceptability zone vis-à-vis value (objectives) will also be defined to make the proposed methodology more robust for decision-making.
References
Aguilar-Savén, R.S., 2004. Business process modelling: Review and framework. International Journal of Production Economics 90, 129–149. doi:10.1016/S0925-5273(03)00102-6 Aven, T., 2008. Risk analysis: assessing uncertainties beyond expected values and probabilities.
Wiley & Sons, NewYork.
Bana e Costa, C.A., Vansnick, J.-C., 1994. MACBETH — An interactive path towards the construction of cardinal value functions. International Transactions in Operational Research 1, 489–500. doi:10.1016/0969-6016(94)90010-8
Becker, J., Breuker, D., Wei\s s, B., Winkelmann, A., 2010. Exploring the status quo of business process modelling languages in the banking sector–an empirical insight into the usage of methods in banks, in: 21st Australasian Conference on Information Systems (ACIS 2010). Brisbane, Australia.
B. Kayis, Arndt, G., M. Zhou, S. Amornsawadwatana, 2007. A Risk Mitigation Methodology for New Product and Process Design in Concurrent Engineering Projects. CIRP Annals - Manufacturing Technology 56, 167–170. doi:10.1016/j.cirp.2007.05.040
Braaksma, A.J.J., Meesters, A.J., Klingenberg, W., Hicks, C., 2012. A quantitative method for Failure Mode and Effects Analysis. International Journal of Production Research 50, 6904–6917. doi:10.1080/00207543.2011.632386
Case, K., Nor, A., Teoh, P.C., 2010. A diagnostic service tool using FMEA. International Journal of Computer Integrated Manufacturing 23, 640–654.
Chapman, R.J., 2006. Simple Tools and Techniques for Enterprise Risk Management. Wiley. Cha, S.-C., Liu, L.-T., Yu, B.-C., 2009. Process-oriented approach for validating asset value for
evaluating information security risk, in: Computational Science and Engineering, 2009. CSE’09. International Conference on. IEEE, pp. 379–385.
Cheng, C.-Y., Li, S.-F., Chu, S.-J., Yeh, C.-Y., Simmons, R.J., 2013. Application of fault tree analysis to assess inventory risk: a practical case from aerospace manufacturing. International Journal of Production Research 51, 6499–6514.
doi:10.1080/00207543.2013.825744
Cliville, V., Berrah, L., Gilles Mauris, 2007. Quantitative expression and aggregation of
performance measurements based on the MACBETH multi-criteria method. International Journal of Production Economics, 105, 171-189.
Cope, E.W., Kuster, J.M., Etzweiler, D., Deleris, L.A., Ray, B., 2010. Incorporating risk into business process models. IBM J. Res. & Dev. 54, 4:1–4:13.
doi:10.1147/JRD.2010.2045777
Dumas, M., 2013. Fundamentals of business process management. Springer, Berlin; New York. Dunjó, J., Fthenakis, V., Vílchez, J.A., Arnaldos, J., 2010. Hazard and operability (HAZOP)
analysis. A literature review. Journal of Hazardous Materials 173, 19–32. doi:10.1016/j.jhazmat.2009.08.076
Grabisch, M., Kojadinovic, I., Meyer, P., 2008. A review of methods for capacity identification in Choquet integral based multi-attribute utility theory:: Applications of the Kappalab R package. European journal of operational research 186, 766–785.
Groso, A., Ouedraogo, A., Meyer, T., 2012. Risk analysis in research environment. Journal of Risk Research 15, 187–208. doi:10.1080/13669877.2011.634513
Hammer, M., Champy, J., 2003. Reengineering the corporation: A manifesto for business revolution. Harper Paperbacks.
Indulska, M., Recker, J., Rosemann, M., Green, P., 2009. Business Process Modeling: Current Issues and Future Challenges, in: Eck, P., Gordijn, J., Wieringa, R. (Eds.), Advanced Information Systems Engineering. Springer Berlin Heidelberg, Berlin, Heidelberg, pp. 501–514.
J. Tixier, G. Dusserre, O. Salvi, D. Gaston, 2002. Review of 62 risk analysis methodologies of industrial plants. Journal of Loss Prevention in the Process Industries 15, 291–303. doi:10.1016/S0950-4230(02)00008-6
Keeney, R.L., 1996. Value-focused thinking: a path to creative decisionmaking. Harvard University Press, Cambridge, Mass.
Kirkwood, C.W., Sarin, R.K., 1980. Preference Conditions for Multiattribute Value Functions. Operations Research 28, 225–232.
Knight, K.W., 2010. AS/NZS ISO 31000: 2009-the New Standard for Managing Risk. Keeping good companies 62, 68.
Kusiak, A., Zakarian, A., 1996. Risk assessment of process models. Computers & Industrial Engineering 30, 599–610.
Labovskỳ, J., Švandová, Z., Markoš, J., Jelemenskỳ, L., 2008. HAZOP study of a fixed bed reactor for MTBE synthesis using a dynamic approach. Chemical Papers 62, 51–57. Larson, N., Kusiak, A., 1996. Managing design processes: A risk assessment approach. IEEE
Transactions on Systems, Man, and Cybernetics- Part A: Systems and Humans 26, 749– 759.
Lee, C.K.M., Lv, Y., Hong, Z., 2013. Risk modelling and assessment for distributed
manufacturing system. International Journal of Production Research 51, 2652–2666. doi:10.1080/00207543.2012.738943
Liaqat, S., 2012. (Value, Risk)-Based Performance Evaluation of Manufacturing Processes, in: Theodor, B. (Ed.), . pp. 1586–1591. doi:10.3182/20120523-3-RO-2023.00145
Limnios, N., 2007. Fault trees. John Wiley & Sons, New York.
Martinez-Hernandez, V., 2003. Understanding value creation: The value matrix and the value cube. Ph.D. Thesis, University of Strathclyde
Moeller, R., 2007. COSO Enterprise Risk Management: Understanding the New Integrated ERM Framework, 1st ed. Wiley & Sons, New York.
Moghaddam, K.S., 2015. Supplier selection and order allocation in closed-loop supply chain systems using hybrid Monte Carlo simulation and goal programming. International Journal of Production Research 53, 6320–6338. doi:10.1080/00207543.2015.1054452 Mun, J., 2006. Modeling Risk: Applying Monte Carlo Simulation, Real Options Analysis,
Forecasting, and Optimization Techniques. Wiley & Sons, New York.
Neiger, D., Rotaru, K., Churilov, L., 2009. Supply chain risk identification with value-focused process engineering. Journal of Operations Management 27, 154–168.
Pierson, M.D., 2012. HACCP: Principles and Applications. Springer Science & Business Media Berlin ?.
Rikhardsson, P., Best, P.J., Green, P., Rosemann, M., 2006. Business process risk management and internal control: A proposed research agenda in the context of compliance and ERP systems. Proceedings of 2nd Asia/Pacific Research Symposium on Accounting
Information Systems, Melbourne Australia.
Sackmann, S., 2008. A Reference Model for Process-Oriented IT Risk Management., in: European Conference on Information Systems ECIS. pp. 1346–1357.
Salah E., E., 2005. On the fallacy of averages in project risk management. European Journal of Operational Research 165, 307–313. doi:10.1016/j.ejor.2004.04.003
Scott, J.E., Vessey, I., 2002. Managing risks in enterprise systems implementations. Commun. ACM 45, 74–81. doi:10.1145/505248.505249
Shah, L.A., 2013. Process-Oriented Performance Evaluation: Concepts and Methodology: Value and risk based approach. Lambert Academic Publishing, Saarbrücken.
Sienou, A., Lamine, E., Pingaud, H., 2008. A method for integrated management of process-risk. Proceedings of the 1st International Workshop on Governance, Risk and Compliance - Applications in Information Systems (GRCIS), Montpellier, France, 17-20 June vol. 339, pp.17-30.
Sormaz, D.N., Khoshnevis, B., 2003. Generation of alternative process plans in integrated manufacturing systems. Journal of Intelligent Manufacturing 14, 509–526.
Su, C.-T., Chou, C.-J., 2008. A systematic methodology for the creation of Six Sigma projects: A case study of semiconductor foundry. Expert Systems with Applications 34, 2693–2703. doi:10.1016/j.eswa.2007.05.014
Sun, Y.-M., Ockerman, H.W., 2005. A review of the needs and current applications of hazard analysis and critical control point (HACCP) system in foodservice areas. Food Control 16, 325–332. doi:10.1016/j.foodcont.2004.03.012
Suriadi, S., Wei\s s, B., Winkelmann, A., ter Hofstede, A.H., Adams, M., Conforti, R., Fidge, C., La Rosa, M., Ouyang, C., Rosemann, M., others, 2014. Current research in risk-aware business process management: overview, comparison, and gap analysis. Communications of the Association for Information Systems 34, 933–984.
Trucco, P., Cavallin, M., 2006. A quantitative approach to clinical risk assessment: The CREA method. Safety Science 44, 491–513. doi:10.1016/j.ssci.2006.01.003
Vernadat, F., Shah, L., Etienne, A., Siadat, A., 2013. VR-PMS: a new approach for performance measurement and management of industrial systems. International Journal of Production Research 51, 7420–7438. doi:10.1080/00207543.2012.752593
Yu, Z.W., 2011. A Business Process-based Risk Evaluation Framework, in: Advanced Materials Research. Trans Tech Publ, pp. 1024–1028.