Heart Rate Variability Feature Selection using Random Forest
for Mental Stress Quantification
Chang Su
A Thesis in
The Department of
Electrical and Computer Engineering
Presented in Partial Fulfillment of the Requirements For the Degree of
Master of Applied Science (Qualifying Program) at Concordia University
Montréal, Québec, Canada
September 2020
c
CONCORDIA UNIVERSITY SCHOOL OF GRADUATE STUDIES
This is to certify that the thesis prepared By: Chang Su
Entitled: Heart Rate Variability Feature Selection using Random Forest for Mental Stress Quantification
and submitted in partial fulfillment of the requirements for the degree of
Master of Applied Science (Electrical and Computer Engineering)
complies with the regulations of this University and meets the accepted standards with respect to originality and quality.
Signed by the final examining committee:
________________________________________________ Chair Dr. C. Wang ________________________________________________ External Examiner Dr. H. Ge (BCEE) ________________________________________________ Internal Examiner Dr. C. Wang ________________________________________________ Co-Supervisor Dr. W.-P. Zhu ________________________________________________ Co-Supervisor Dr. Y. Zeng (CIISE) Approved by: ___________________________________ Dr. Y.R. Shayan, Chair
Department of Electrical and Computer Engineering
_______________ 20___ __________________________________ Dr. Mourad Debbabi, Interim Dean,
Gina Cody School of Engineering and Computer Science
Abstract
Heart Rate Variability Feature Selection using Random Forest for Mental
Stress Quantification
Chang Su
Mental stress is considered as an essential element that affects decision making. Apart from mental stress, cognitive workload, mental effort, attention, and cognitive engagement are also involved in the decision-making process. Ambiguities of these concepts lead to confusion in their applications.
One objective of this thesis is to explore the relationship between mental stress and stress-related concepts. By investigating the mechanisms for decision-making, the differ-ence and correlation of mental stress and other concepts are disclosed.
Heart rate variability (HRV) is a common method to measure mental stress. By in-vestigating the correlation between HRV and mental stress, it can be confirmed that HRV does respond to mental stress changes instead of other concepts. HRV features are used to assess whether there is a relationship between baseline HRV and mental stress. However, the extracted features usually contain a large amount of redundancy, which adds compu-tational complexity to mental stress quantification while not contributing to quantification accuracy. Recently, researchers have resorted to the random forest as a tool for HRV feature selection.
Another objective of this thesis is to select significant HRV features to quantify the mental stresses using the random forest method.
In this thesis, an open-source data set, called the SWELL-KW data set, is used for mental stress measurement, where three labels are assigned according to different mental
stress conditions, i.e., neutral, time pressure, and interruption. A set of HRV features are proposed based on time domain and frequency domain analysis for mental stress measure-ment. Statistical analysis is performed to select the essential features that reflect mental stress.
The random forest algorithm of feature selection is then studied, and the accuracy in measuring mental stress is validated by comparing the extracted features of the training set and the testing set. In order to evaluate the random forest algorithm’s performance, the comparisons with other related algorithms, including support vector machine (SVM), de-cision tree, gradient boosting dede-cision tree (GBDT), k-nearest neighbor algorithm (KNN), and deep neural networks (DNN), are also conducted in terms of accuracy and time cost.
The optimal HRV feature subset is proposed for mental stress quantification, including median RR, mean RR, median REL RR, HR, pNN25, SDRR RMSSD, SDRR RMSSD REL RR, TP, SD2, and SDRR. It is shown that this subset of features gives a high feature importance score and thus has a significant effect on mental stress quantification.
Performing random forest analysis with a sufficient amount of labeled data shows that the optimal HRV feature subset yields high mental stress quantification accuracy by using random forest. Moreover, random forest always makes the best overall performance in feature selection compared with other algorithms in terms of accuracy and time cost. It also infers the potential relation between physiological responses and mental activities.
Acknowledgments
First of all, I would like to give my thanks to my supervisors, Dr. Yong Zeng and Dr. Wei-Ping Zhu, for their patience and insightful guidance in my research, also for their consistent support and encouragement through all stages of my Master study. Their guidance helped me in my research and thesis writing.
Secondly, I would like to thank my friends for their love and support when I was struggling. I will never forget the memory that they accompanied me when I was in trouble. I would like to thank Mr. Wentao Zhang for his help in modifying the HRV analysis program.
Finally, I want to say thanks to my parents. Without their courage and support, I would not have the opportunity to enjoy this adventure in a new culture and an exciting university. They have provided me an invaluable opportunity to gain experience in studying abroad. I love you 3000 times.
Contents
List of Figures ix
List of Tables x
List of Abbreviations xi
1 Introduction 1
1.1 Background and motivation . . . 1
1.2 Objectives . . . 4
1.3 Contributions . . . 5
1.4 Thesis organization . . . 5
2 Mental stress in decision making: mechanism models and concepts 7 2.1 The concept of mental stress . . . 7
2.2 The elicitation of mental stress . . . 9
2.3 Relations of mental stress with other relevant concepts . . . 11
2.4 Mechanisms for decision making . . . 12
3 Heart rate variability (HRV) 15 3.1 The anatomy of the heart . . . 15
3.2 The electrical activity of the heart . . . 17
3.4 The physiological and cognitive responses to stress-related phenomena . . . 24
3.5 Different measuring methods for mental stress . . . 27
4 Random forest and other related algorithms 30 4.1 The principle of random forest . . . 30
4.2 Random forest algorithm . . . 32
4.3 Other related algorithms . . . 33
4.3.1 SVM . . . 33
4.3.2 Decision tree . . . 34
4.3.3 GBDT . . . 37
4.3.4 KNN . . . 38
4.3.5 DNN . . . 39
5 Statistical analysis and results 41 5.1 SWELL-KW dataset . . . 41
5.1.1 Participants . . . 42
5.1.2 Design and tasks . . . 42
5.1.3 Procedure . . . 43
5.2 Preprocessing . . . 44
5.3 Tuning . . . 49
5.4 Feature selection . . . 51
5.4.1 Comparisons and model choices . . . 52
5.4.2 Feature importance . . . 55
5.4.3 Feature selection and comparison . . . 59
5.5 Summary . . . 62
6 Conclusion and future work 65 6.1 Conclusion . . . 65
6.2 Future work . . . 66
Bibliography 68
List of Figures
1 The relationship between performance and mental stress [58] . . . 8
2 A mechanism for decision making in rational states . . . 13
3 A mechanism for decision making in intuition states . . . 14
4 The anatomy of heart [4] . . . 16
5 The conduction system of heart [50] . . . 19
6 A typical normal ECG waveform [59] . . . 21
7 The physiological and cognitive responses to stress related phenomena . . . 26
8 The conceptual diagram of a random forest model [45] . . . 31
9 The maximal margin hyperplane [6] . . . 33
10 Sorting number using decision tree algorithm . . . 35
11 An example of KNN [83] . . . 38
12 A general model of DNN with N hidden layers [66] . . . 39
13 The design process [43] . . . 43
14 The sample size under three mental stress conditions . . . 52
15 Test accuracy comparisons among different models . . . 54
16 Feature importance in 99.98% accuracy . . . 57
17 Feature importance in 80.65% accuracy . . . 58
18 Top 10 features importance . . . 59
List of Tables
1 Components’ inherent rates in the cardiac conduction system [37] . . . 20
2 Time domain features [80] . . . 23
3 Frequency domain features [80] . . . 24
4 Functions of brain waves [57] . . . 28
5 Feature extraction in time domain . . . 46
6 Feature extraction in frequency domain . . . 47
7 Accuracies of 31 features in different algorithms . . . 53
8 Feature importance ranking . . . 56
9 The test accuracy gap of 31 features and top 10 features in random forest . . 60
10 The test accuracy from 31 features and top 10 features in different models . 61 11 The training time of each method . . . 62
List of Abbreviations
ANS Autonomic Nervous System
AV Atrioventricular
CART Classification and Regression Tree
CWT Color Word Test
DNN Deep Neural Networks
ECG Electrocardiogram
EEG Electroencephalogram
GBDT Gradient Boosting Decision Tree
GC Glucocorticoid
HF High Frequency
HPA Hypothalamic–Pituitary–Adrenal
HR Heart Rate
HRV Heart Rate Variability
ID3 Iterative Dichotomiser 3
KNN K-Nearest Neighbors
LF Low Frequency
NASA-TLX NASA Task Load Index
PNS Parasympathetic Nervous System
PSD Power Spectral Density
RMSSD Root Mean Square of Successive Differences
SA Sinoatrial
SDNN Standard Deviation of Normal-to-Normal R-R intervals
SDRR Standard Deviation of R-R intervals
SNS Sympathetic Nervous System
SVM Support Vector Machine
Chapter 1
Introduction
1.1
Background and motivation
It has been commonly and scientifically known that mental stress plays a significant role in human decision making. When people engage in activities such as driving, playing games, or giving a lecture, they must constantly balance the demand for an accurate de-cision against many parameters, e.g., time pressure. Based on qualitative research and experiments, the traditional literature generally concludes that mental stress mostly neg-atively affects the decision-making process [28]. The study by Giora K [38] offers the effects of stress on a critical phase of the decision-making process and makes individual consideration of alternative faulty. Another study [95] shows that the relationship between mental stress and performance is a bell-shaped curve. Nguyen T A and Zeng Y [44, 55, 89] proposed a theoretical framework to illustrate that the mental stress can be determined by the mental workload and the mental capacity, while the individual mental capacity can be defined by knowledge, skills, and affect. Increases in mental workload may trigger more mental stress and reduce individual performance. Consequently, the study of measuring and quantifying mental stress is essential if we are to reduce the harmful effect caused by mental stress and to achieve the best performance.
For developing mental stress quantification, it is essential to define mental stress. Stokes and Kite suggested that stress should be viewed as an agent, circumstance, situation, or variable that disturbs the ’normal’ functioning of the individual, and stress is also seen as an effect—that is, the disturbing state itself [22]. While later, Contrada contended that stress is defined as a processing capacity of an organism, resulting in psychological and biological changes that may place persons at risk for disease [17]. Briefly speaking, the definition of stress includes internal or external stressors, perception of the organism’s stimulation, and a physiological response [32, 52]. Since mental stress can generate a physiological response, several scholars attempt to use these reactions to substitute mental stress. However, some researchers contend that the measurement of physiological parameters cannot accurately explain the human stress response and does not necessarily represent mental stress [22]. An opinion is purposed in some biological stress responses that can only represent mental workload. TA Nguyen et al. [56] concluded that Heart Rate Variability (HRV) can quantify mental stress while the Electroencephalogram (EEG) energy can quantify mental effort.
However, there is widespread confusion about mental stress (arousal), workload, cog-nitive workload, mental effort, attention, and cogcog-nitive engagement. In the literature, these different concepts sometimes are used to describe the same phenomenon, while the same concept may be resorted to referring to different phenomena. For example, Roger Daglius Dias concluded that HRV analysis is a metric to assess cognitive workload [22]. How-ever, other researchers asserted that mental stress influences HRV [75, 86]. Meanwhile, the mental effort can be measured both on NASA-TLX and EEG energy as per the authors of [13, 59].
Ambiguities of concepts often lead to confusion in their applications. Cognitive work-load, attention, and cognitive engagement are also referred to in mental stress studies. To the author’s best knowledge, very few works have addressed the differences between mental
stress, mental effort, cognitive workload, attention, and cognitive engagement. The clari-fication of these concepts will facilitate the effective and efficient applications of existing research to real-world problems.
The majority of current studies investigating mental stress quantification make use of different triggering methods and criteria, e.g., Color Word Test (CWT). Using this ap-proach, TA Nguyen et al. indicated that the Low Frequency (LF) / High Frequency (HF) ratio in the HRV signal and EEG signal could quantify the mental stress [56]. Moreover, the previous studies classify mental stress measurement into electrophysiological measure-ment, subjective measuremeasure-ment, and biochemical measurement. Quantifying mental stress by its physiological feature is a field of research that received special and increasing atten-tion. For example, HRV and EEG are reliable methods for quantifying mental stress. Since several measuring methods can be used to quantify mental stress, more and more studies tried to find out the best quantitative features. There’s a wide spectrum of opinions on this issue. A challenging problem that arises in this domain is to select the appropriate features. In this thesis, we will investigate mental stress based on HRV.
The HRV data set used for quantification in this thesis is taken from the SWELL Knowl-edge Work (SWELL-KW) data set [43], which is provided by Koldijk S, et.al. They re-searched on stress and user modeling. Participants experienced typical work pressures in their experiment, such as receiving unexpected email interruptions and completing the work on time. During their experiment, the data set was collected by researchers, which is called the SWELL-KW data set [43]. SWELL-KW designed a mental stress experiment that 25 people participated in collecting and storing real-time R-R interval data, which were used to obtain HRV data. This thesis uses the HRV data set based on this experi-ment. Features used to quantify cardiovagal reactivity included time and frequency domain measures such as high frequency (HF) power, Standard Deviation of Normal-to-Normal R-R intervals (SDNN), and Root Mean Square of Successive Differences (RMSSD). By
analyzing HRV data using the random forest algorithm, the relationship between feature selection, physiological responses, and autonomic nervous system dynamics is verified. In addition to a longitudinal study method of analyzing data from all individuals at different stress conditions, feature selection results are validated from 31 features in 3 conditions (relaxed, stressed, and interrupted) based on their accuracy by using random forest. Five classification methods viz Support Vector Machine (SVM), Decision Tree, Gradient Boost-ing Decision Tree (GBDT), K-Nearest Neighbors (KNN), Deep Neural Networks (DNN) have been selected to compare with Random Forest in this study. The accuracy value is recorded for analysis.
This thesis is focused on the hypothesis that mental stress can be determined by men-tal workload and menmen-tal capacity, i.e., adjusting to a positive emotion can reduce stress. Furthermore, we hypothesized that the combination of mental effort, cognitive engage-ment, attention, and cognitive workload would induce mental stress, which would cause a positive or negative effect on performance. This performance can generate physiological response, i.e., decreased HRV and increased blood pressure.
1.2
Objectives
The objective of this thesis is two-fold. The first objective is to clarify mental stress, cog-nitive workload, mental effort, attention, and cogcog-nitive engagement by investigating the decision-making process’s mechanisms. The second objective is to quantify mental stress by measuring and analyzing the HRV features using the random forest algorithm.
For the first objective, a mechanism for mental stress to be triggered in decision making is proposed to clarify stress-related concepts. It reveals the relationship between mental stress and HRV, which can quantify mental stress by analyzing variables.
Although HRV feature selection is useful in statistical analysis, the extracted features usually contain considerable redundant. In the second objective, an optimal HRV feature
subset is selected by using the random forest.
1.3
Contributions
This thesis focuses on finding the relations between mental stress and physiological mea-sures, and the correlation between mental stress, stress-related concepts, and decision-making activities. The main contributions of this thesis include the following:
• Based on the literature review on stress-related concepts and phenomena, a mecha-nism of decision making is proposed to infer the causal relationships between differ-ent stress-related concepts.
• Critical HRV features to quantify and classify mental stress levels are identified by applying the random forest algorithm.
• The effectiveness of the random forest algorithm is validated by comparing it with other related algorithms and models.
1.4
Thesis organization
The remainder of this thesis is organized as follows: chapter 2 reviews relevant research in mental stress concepts, stress elicitation, and stress measurements. It also proposes a decision-making mechanism and figures out the connection between mental stress, cogni-tive workload, cognicogni-tive engagement, and mental effort. Chapter 3 describes the theoretical aspect of HRV and the superiority of HRV measurement. I also show the physiological and cognitive responses to stress-related phenomena. Chapter 4 presents the theoretical aspect of random forest and the related models and algorithms (SVM, decision tree, GBDT, KNN, DNN). Chapter 5 introduces the experimental setup and validation results for SWELL knowledge work under different stress conditions. It also focuses on the statistical analysis
of the HRV dataset, including preprocessing, feature extraction, and feature selection. The algorithm is also validated by carrying out comparative studies on other models. Chapter 6 summarizes the research results of this thesis and suggests some topics for future work.
All the experiment data in this thesis were provided by the SWELL-KW dataset, col-lected within the SWELL project. The collection of this dataset was supported by re-searchers at the Institute for Computing and Information Sciences at Radboud University.
Chapter 2
Mental stress in decision making:
mechanism models and concepts
This chapter reviews relevant research in mental stress concepts, stress elicitation, and stress measurements. It also proposes mechanisms for mental stress to be triggered in decision making.
2.1
The concept of mental stress
Mental stress, as a common psychological phenomenon, is often encountered in our daily lives. Selyes [78] defines stress as ’the nonspecific result of any demand upon the body’. The definition of stress includes internal or external stressors, perception of the organism’s stimulation, and a physiological response [32, 52]. It is generally asserted that psycholog-ical stress includes two traditional modes: stimulus-based and response-based [84]. The former assumes that certain environmental conditions, situations, or external events are ex-pected to trigger stressful and considered as stressors (i.e., war, divorce, workload, heat and cold, et cetera.), ignoring the differences between individuals, circumstances appraisal, and emotional effects. The latter asserts that stress is a change response pattern of physical
function under stressors, and the variables are endogenous. Meanwhile, according to the intensity and duration of stressors, mental stress is generally divided into acute stress and chronic stress [21]. The effect and challenges arising from a mild stressor are temporary, often lasting from several minutes to hours.
In contrast, chronic stressor usually lasts for quite a few hours each day, sometimes up to several weeks or months, whose essential feature is persistent, repetitive, or high inten-sity. No matter what kind of stress can influence our brain, it affects physical, cognitive, affective, and behavioral aspects. Therefore, the current techniques and stress measurement methods and quantification are mostly derived from the response-based stress model.
The Yerkes-Dodson law [95] shows the bell-shaped curve relationship between mental arousal (stress) and performance, as given in Figure 1.
Figure 1: The relationship between performance and mental stress [58]
As shown in Figure 1, the performance may increase with mental stress, up to a point, but it will then show a negative correlation with mental stress if it is further increased.
According to the Yerkes-Dodson law, mental stress plays an important role in individual performance. However, Yerkes-Dodson law didn’t specify the factors influencing mental stress. Many studies have been carried out on this topic. A paper relevant to this research was published by Nguyen T A and Zeng Y [58, 60, 61]. They gave a theoretical framework
for mental stress, which is expressed as:
σ = Wp
(K+S)∗a (1)
where Wp represents perceived mental workload, K is knowledge, S represents skill, a
means affect, specifically emotion , andσ represents mental stress.
The stress performance model defines the factors influencing mental stress. It can be seen from Equation (1) that knowledge, skills, and emotion can define the individual mental capacity. The mental workload and mental capacity can determine mental stress. Therefore, the stress-performance model can be used to clarify and quantify these concepts.
2.2
The elicitation of mental stress
Before 1993, several researchers had elicited mental stress by using some laboratory tasks, such as the cold pressor test, the Stroop test, public speaking, etc. Much of the research in stressor distinguish in recent decades has divided the elicitation of mental stress into five terms based on stressors.
1 Working memory
Working memory refers to the brain system that provides temporary storage and ma-nipulation of the necessary information for complex cognitive tasks [5]. Higher working memory individuals use simpler (and less efficacious) problem-solving strategies under high-pressure conditions and suffer from performance accuracy. A slice of researchers used working memory as a stressor for measuring mental stress. By way of illustration, the CWT is the classic working memory case that is widely used in the elicitation of mental stress [27, 67].
To a certain extent, reaction time indicates stress. When performing mental tasks at a satisfactory level of performance, it often encounters some complications, which can be due to many happenings and mistakes. Therefore, measuring reaction time is vital for monitoring and evaluating mental stress [7].
An example of this is the study carried out by Wolf Langewitz et al. in which a re-action time task is used to trigger individual mental stress [44]. By comparing the blood pressure at rest and under mental stress, they found that decreased parasympathetic nerve control leads to sympathetic and parasympathetic cardiovascular control disorders during hypertension.
3 Selective attention
Selective attention is directing our consciousness to relevant stimuli while ignoring ir-relevant ones in the environment. This phenomenon is that people can focus on the process of particular aspects while ignoring irrelevant objects in the environment for a certain pe-riod.
The CWT is a typical case in this area. Vanitha L et al. claimed that HRV parameters are sensitive to working memory demands during the CWT test, thus sensitive to mental stress [89].
4 Physical pressure
Physical discomfort has also been used as a stress-inducing protocol. The typical case of physical pressure is the cold pressor test [90, 93]. The cold pressor test requires the subject to immerse the hand into an ice water container to trigger changes on blood pres-sure and heart rate of healthy participants [55]. Cold pressor stress indicated that acute stress undermines working memory performance, which is Secretory immunoglobulin A and cardiovascular reactions to mental arithmetic and cold pressor.
At last, social stress also plays a principal role in measuring mental stress. It is gener-ated based on relationships with others and a unique social environment. Public speaking is a representative case of social stress. Schubert et al. [77] reported that using speech task to induce stress, Standard Deviation of R-R intervals (SDRR) in HRV showed a discordant increase due to a slow respiration rate and a relative reduction in ventilation.
2.3
Relations of mental stress with other relevant concepts
Mental stress is associated and very often confused with concepts such as workload, cogni-tive workload, mental effort, attention, and cognicogni-tive engagement. Ambiguities of concepts will lead to confusion in their applications. Therefore, clarifying these concepts will facil-itate the effective and efficient applications of existing research to real-world problems.
Several studies led to the definitions of mental stress, mental effort, cognitive engage-ment, cognitive workload, and attention. Beginning with mental stress, due to its wide range of applications, scholars in different research fields have given various definitions. In the aspect of mental effort, Heemstra stated that mental effort could be defined as the total use of cognitive resources [34]. Sun and Yao found that mental effort is positively related to design novelty and quantity [85]. Nguyen and Zeng verified that mental effort is the lowest at a high-stress level, and there is no significant difference in mental effort between medium-stress level and low-stress level [59]. Unlike mental effort, cognitive engagement is defined as the degree to which students are willing and able to immerse themselves in taking on the task at hand [34, 85]. The definition of cognitive workload is the measurable level of mental effort that an individual presents in response to one or more cognitive tasks, which is not the task but a property of the individual [68].
In short, mental stress is typically regarded as an essential influence factor leading to different cognitive degrees of later results (i.e., mental effort, cognitive engagement, and cognitive workload). Several scholars have attempted to use these results (e.g., cognitive
workload) to substitute mental stress. However, how mental stress affects cognition and behaviors of humans is unclear.
In order to better understand the variables that allow measuring the levels of mental stress, the definitions that are easily confused with psychological stress, such as mental effort, cognitive engagement, and cognitive workload, are worth distinguishing. They are interdependent and mutually motivate.
2.4
Mechanisms for decision making
Decision-making performance is related to the decision-makers’ mental stress. Decision making is a process in which the stressor activates the individual cognitive system and cre-ates the emotions, behaviors, and stress. Decision making will help to make more deliber-ate, thoughtful decisions by organizing relevant information and evaluating performances.
Stress-related concepts include mental stress, workload, cognitive workload, mental effort, attention, and cognitive engagement. Based on the performance-stress model, we try to draw this diagram to figure out the decision-making process.
Figure 2: A mechanism for decision making in rational states
Mental stress generation in the mechanism for decision making will create these phe-nomena via the cognitive system. The mental stress can be determined in either a rational or the opposite situation. Figure 2 introduces the recursive cognitive process under mental stress in a rational situation. The white components indicate different cognition stages, which we consider as a cognitive system, including perception and engagement, under-standing, analysis, decision making, and action. In the beginning, stressor causes percep-tion and engagement. From this stage, it creates cognitive workload, as well as mental stress and behavior. This cognitive workload acts in the next stage. We can see that the cognitive workload updates and generates a new one in the next stage. In order to distin-guish them, we marked them as 1 and 2. As the process progresses, we repeatedly update the cognitive workload, the same as mental stress and behavior. It can be noticed that men-tal stress and behavior can also affect the individual neural system, which will participate in the cognitive process by generating a mental effort and can be used when using knowledge
and skills to figure out the mental workload. The whole process is recursive.
Figure 3: A mechanism for decision making in intuition states
The above cognitive processes are all in a rational situation. We can also encounter such a situation where people depend on conditional reflection or intuition to act. This cognitive process under mental stress is shown in Figure 3. After perception and engagement, people create actions directly. The difference between Figure 2 and Figure 3 is since individual knowledge and skills are different. In section 2.1, the stress- performance model defines the factors influencing mental stress. Moreover, mental effort creates mental stress by acting on the cognitive system.
The stress-performance model factors are related to the concepts, including mental stress, workload, cognitive workload, mental effort, attention, and cognitive engagement. Therefore, decision-makers such as skills, knowledge, and affect come from mental ca-pability. The mechanism for decision making can infer the casual connections between stress-related concepts.
Chapter 3
Heart rate variability (HRV)
HRV is the physiological phenomenon in which the time interval between consecutive heartbeats changes. This chapter describes the theoretical aspect of HRV and the supe-riority of HRV-based mental stress measurement by comparing it with other measurement methods.
3.1
The anatomy of the heart
The heart is a muscular pump with its rhythmic contractions and allows a constant flow of blood through all tissues ensuring a regular exchange of gasses, nutrients, and waste products. The heart is wrapped with a thin membrane called the pericardium. It is located in the central part of the chest above the diaphragm (muscle barrier which divides the abdomen from the chest). The heart’s size is about a closed fist; the weight varies from 300-350 grams for men and 250-300 grams for women. The heart consists of two atria and two ventricles. The atria (the right atrium and the left atrium) receive blood. Afterward, it transmits the blood into the two lower chambers called ventricles (the right ventricle and the left ventricle), as shown in Figure 4.
Figure 4: The anatomy of heart [4]
The atria and ventricles on two sides of the heart are separated by the wall called the septum, which prevents the mixing of the blood of the heart’s left and right side. The wall dividing the right and left atria is called the inter-atrial septum, while the part dividing right and left ventricular is called the inter-ventricular septum. The right atrium delivers the deoxygenated blood to the right ventricle, pushing the deoxygenated blood to the lungs. After releasing the carbon-dioxide and taking on oxygen, the oxygenated blood comes to the left atrium. The left ventricle takes the oxygenated blood from the left atrium and pushes it to the rest of the body.
The heart’s pulsation is a product of rhythmic contractions and relaxations of the heart muscle, which is called the myocardium. During the contraction phase, the wall of the atrium or ventricle contracts, increasing the pressure within the heart and ejecting blood out of the closed chamber. Subsequently, the atrial or ventricular wall relaxes and is ready to receive a new amount of blood.
The Autonomic Nervous System (ANS) controls the heart contractions. ANS is di-vided into the Sympathetic Nervous System (SNS) and the Parasympathetic Nervous Sys-tem (PNS). The SNS and PNS work antagonistically. The SNS prepares the human body to respond to stressful situations. That response is known as the fight or flight response [12].
Simultaneously, the PNS controls the human body’s free functions in a normal basal con-dition, popularly called rest and digest system [11, 12]. The ANS’s SNS part is activated in response to a stressful situation, while challenging physical activity, or when we feel angry or are frightened. The following [49] are the most common facts related to the SNS:
1) HR can increase from 70 to 150 bpm in 3 seconds. 2) The blood pressure can double in 10 seconds.
The heart can contract without outside innervation. However, the power of the heart contraction is controlled by the ANS. Under the effect of the SNS part, the HR and the power of the heart contraction are increased. While under the control of the PNS part of the ANS, HR and cardiac contractions are decreased.
3.2
The electrical activity of the heart
Since the first human Electrocardiogram (ECG) recording was published in 1887 by Au-gustus Waller[91], the ECG signal has been used widely in many fields. Researchers detect and quantify human activities and responses by monitoring the electrical activity of heart rate.
It is expected that all heart activities have electrical impulses. The electrical impulse causes the heart muscle contraction. The formation and transmission of electrical impulses depend on the characteristics of the heart’s cells.
Bio-electricity represents the ability of biological tissues to generate electricity without external excitation. The first research regarding bio-electricity was published by Luigi Galvani [30]. He discovered that the muscles of dead frogs’ legs twitched when struck by an electrical spark.
The electrical charges in the tissue originate from the ions. Therefore, in cells, there are two kinds of electrical potentials: static potential and action potential.
The cell membrane changes from the static potential to the action potential. Stimu-lation can change the cell electrical potential, open the sodium ion (N a+) channel, and allow manyN a+ to enter the cell. This process is called polarization. When the excita-tion is higher than the threshold, it opens the ionic channel, and the positive N a+ come into the heart cell, causing the change of the electrical potential. This process is called depolarization. The repolarization is the descending process towards the static potential. It represents the change of the difference of the electrical potential inside the cell. Potassium ions (K+) begin to fall along the electrochemical gradient. With the removal of potas-sium from the cell, its potential decreases and approaches its resting potential again. The sodium-potassium pump has been working continuously during this process. At the peak action potential, K+ channels open, and the cell becomes hyperpolarized. The K+ are maintained at high concentrations within the cell. At the same time,N a+ are maintained at high concentrations outside of the cell in neurons.
In general, the repolarization and depolarization represent the foundation of the heart’s electrical activity, which allows the heart to work. The activity of action potential in the heart can be recorded to generate an ECG.
Figure 5: The conduction system of heart [50]
As shown in Figure 5 above, the cardiac conduction system consists of the following five components:
• The Sinoatrial (SA) node: This cell is found within the right atrium of the heart. • Atrioventricular node: This cell can be found within the border of the right atrium
and the right ventricle.
• Atrioventricular (AV) bundle: This cell is found within the right atrium of the heart. • Right and left bundle branches: Both of which are located along the interventricular
septum, the left bundle branch is further divided into the left anterior fascicles and the left posterior fascicles.
• Purkinje fibers: These fibers can be found in the inner ventricular walls of the heart. They receive conductive signals originating at the AV node and simultaneously acti-vate the left and right ventricles by directly stimulating the ventricular myocardium.
All components show different inherent rates in the cardiac conduction system, as il-lustrated in Table 1 below.
Table 1: Components’ inherent rates in the cardiac conduction system [37] Component Inherent rate (BPM)
SA node 60-100
AV node 40-60
Bundle of His 40-60
Right and left bundle branches 20-40
Purkinje fibers 20-40
It is essential to know that the ECG records the heart’s electrical activity, in which each heartbeat is displayed as repeatedly multiple waveforms characterized by peaks and valleys.
Generally speaking, the frequency range of the ECG signal is from 0.05Hzto 100Hz, and the dynamic range is from 1mV to 10mV. The ECG signal is characterized by five peaks and valleys, Einthoven [26] identified the five deflections, which can be marked with the letters P, Q, R, S, T, respectively [69]. ECG also includes a U wave; however, the typical normal ECG may not show it. The normal ECG waveform is shown in Figure 6 below. This figure shows the electrical activity of the heart rate during a heart rate cycle. An ECG signal is a composite recording of all the action potential produced by myocardial nodes and cells. Each wave of the ECG corresponds to the cardiac electrical cycle event, as shown in Figure 6.
Figure 6: A typical normal ECG waveform [59]
In the ECG system, the P wave, T wave, and the QRS complex should be concerned. The P wave represents the activation of the upper chamber of the heart and the atrium, while the QRS complex wave and T wave represent the excitation of the ventricle or the lower chamber of the heart. The T wave reflects the repolarization of the ventricles. The QRS complex represents the ventricular contraction. The detection of the QRS complex is one of the most critical tasks in ECG signal analysis. Once the QRS complex is identified, more detailed information such as Heart Rate (HR), and HRV can be obtained [54, 76].
The RR interval, which is often used to monitor mental health, is the time between QRS complexes. The instantaneous heart rate can be calculated from the time between every two QRS complexes. The RR interval shows the connection between the power of HRV and the nervous system. It is different from the heart rate, which averages the number of beats per minute.
3.3
The relation between HRV and mental stress
HRV signal is a non-stationary signal, which describes the variations between consecutive heartbeats. Its changes can be interpreted as a current or upcoming disease and psycholog-ical activity.
The ANS can generate significant components of the stress responses in the physiologi-cal model. The ANS will create physiologiphysiologi-cal responses such as HR, HRV, blood pressure, eye tracking, and skin conductance.
HRV is an objective measurement method that can be used to measure psychological stress. As shown in Figure 6, HRV is a fluctuation in the heartbeat interval controlled by the original part of the ANS. It can regulate our heart rate, blood pressure, breathing, and digestion.
HRV related researches commonly use features to measure. These features are ex-tracted from the time domain and the frequency domain. HRV analysis for mental stress measurement is usually classified into two domains: time domain and frequency domain. Time-domain measurement can measure RR intervals directly or measure from the differ-ences between RR intervals [25]. Researches about HRV experiments commonly use these metrics to measure: mean of the interval between successive RRs (RR), SDRR, the mean and standard deviation of HR.
In comparison, the frequency domain uses Power Spectral Density (PSD) to estimate the HRV signal. In the frequency domain, features can discriminate between the sympa-thetic and parasympasympa-thetic contents of the HRV signal. Commonly, the HF, LF, and VLF bands and the ratio of LF and HF bands power spectral density (LF/HF) are used as the frequency domain features of the RR interval signal [15]. In this thesis, several standard features of HRV in both time domain and frequency domain are shown in Table 2 and Table 3, respectively.
Table 2: Time domain features [80]
Parameter Description
SDNN Standard deviation of normal RR intervals SDRR Standard deviation of RR intervals
pNN50 Percentage of successive RR intervals that differ by more than 50 ms RMSSD Root mean square of successive RR interval differences
As shown in Table 2 above, SDNN and SDRR can measure RR intervals directly, while pNN50 and RMSSD measure the differences between RR intervals [25, 62]. These features can be calculated as SDN N = v u u t 1 N −1 X i (RRi −RRm)2 (2) pN N50 = PN i=1(|Ri−Ri+1|>50ms) N −1 (3) RM SSD= v u u t 1 N −1 N−1 X i=1 (RRi+1−RRi)2 (4)
RRi represents the i-th RR interval, where N means the total number of heartbeats, and
RRm represents the mean of the RR intervals. Like SDNN, SDRR can also measure how
Table 3: Frequency domain features [80]
Parameter Description
ULF power Absolute power of the ultra-low-frequency band (0.003 Hz) VLF power Absolute power of the very-low-frequency band (0.0033–0.04 Hz)
LF peak Peak frequency of the low-frequency band (0.04–0.15 Hz) LF power Absolute power of the low-frequency band (0.04–0.15 Hz) HF peak Peak frequency of the high-frequency band (0.15–0.4 Hz) HF power Absolute power of the high-frequency band (0.15–0.4 Hz)
LF/HF Ratio of LF-to-HF power
It is well known that the spectral power in HF of the RR interval reflects the activity of the cardiac vagus nerve. On the other hand, the LF frequency band is related to both vagal and sympathetic systems [65]. Some researchers found that heightened mental stress was associated with lowered HRV, specifically with reduced parasympathetic activation. Reduced parasympathetic activation was seen as a decrease in RMSSD and HF power and an increase in the LF/HF ratio. Some previous studies also indicated that the activity di-aries, in conjunction with HRV data, could analyze and isolate important individual events: sleep, exam, physical activity, and caffeine [15, 72, 87].
3.4
The physiological and cognitive responses to
stress-related phenomena
This section shows that the physiological phenomena are mapped into the decision-making process perspicuously. It is widely known that the mental stress reflected on many factors and various systems of the body. Researches over the past years have clarified that the entire brain is involved in responding to stressors. Researches over the past years have
clarified that the entire brain is involved in responding to stressors. With brain imaging technology development in mammals and the remarkable progress in genetic studies, a new understanding of stress networks has been gained in recent years. Stress networks are a set of highly connected brain structures activated when the animals perceive from their surroundings or are exposed to various stressful life events [30].
The stress-related performances contain mental stress, workload, cognitive workload, mental effort, attention, and cognitive engagement during decision-making activities. It is all known that the phycological and cognitive responses will change and reflect the stress-related phenomena. As mentioned in section 2.2.4, several physiological and cognitive responses can be used as measurement metrics for mental stress.
The major components of the stress responses in the physiological model can be gener-ated by the ANS, Hypothalamic–Pituitary–Adrenal (HPA) axis, and brain network. Mean-while, different stress types, including acute stress and chronic stress, have different effects on cognition, decision-making, memory, and health [10]. The body and nervous system’s organization and interactions reflect a high degree of complexity and multidirectional com-munication.
Mental stress and related phenomena can be monitored and measured from the physio-logical and cognitive responses. One clear neurobiophysio-logical indicator of the stress reaction is the significant activation of two stress response systems, rapidly acting SNS and the slower HPA axis, which results in a cascade of neuroendocrine changes [19]. Brain network is also activated by mental stress, as shown in Figure 7 below.
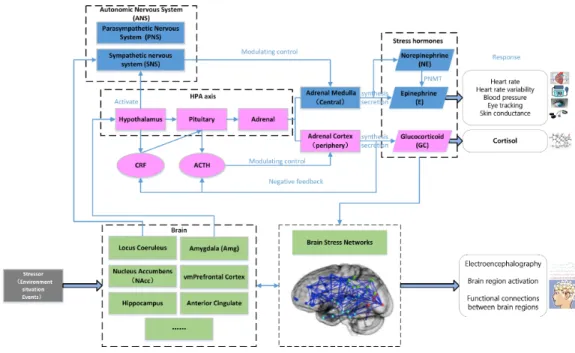
Figure 7: The physiological and cognitive responses to stress related phenomena
Figure 7 indicates the physiological and cognitive responses to stress-related phenom-ena. Based on the response systems and organs, these stress-related responses can be cre-ated from three approaches: the ANS, the HPA axis, and the brain network. As we men-tioned in section 3.3, ANS includes SNS and PNS. Stressor stimulates SNS and modulates control on the Adrenal medulla. It creates the synthesis and secretion of norepinephrine and epinephrine. The blue components show that the ANS will create physiological re-sponses such as heart rate, heart rate variability, blood pressure, eye tracking, and skin conductance. HRV analysis has been established as a quantitative measure of ANS activity related to mental stress [2].
Stress can also cause an increased cortisol output via the HPA axis activation, as shown in the pink component. When stressor reflects on the HPA axis, the hypothalamus creates CRF, which will stimulate the pituitary. Then the pituitary secretes ACTH, which will stimulate on Adrenal. The adrenal cortex is stimulated and secretes Glucocorticoid (GC), which gives negative feedback on previous parts. Cortisol is the most critical human GC,
which is known as the stress hormone. It increases blood sugar levels, enhances the brain’s use of glucose under stress conditions. Besides, the green components show that the brain network will create EEG and brain region activation under mental stress.
It is well known that mental stress can be quantified from human bio-signals. Figure 7 links physiological and cognitive responses to stress-related phenomena. This figure validates the reliability of mental stress quantification based on physiological responses.
3.5
Different measuring methods for mental stress
In addition to HRV, many other modalities can be used for mental stress measurements such as EEG, cortisol, and NASA Task Load Index (NASA-TLX). Several measurement methods can be listed from subjective, biochemical, and psycho-physiological parameters separately.
These typical quantitative evaluations and acute mental stress techniques are introduced below, including the development, calculation methods, characteristics, and applicable scopes.
• EEG
EEG signals exhibit various characteristics in different brain waves. Some qualitative studies in the literature described how mental stress could be quantified from EEG signals. The Electroencephalogram (EEG) signal is a non-stationary signal with different fre-quency elements at different time intervals. Recent research found that EEG reflects brain activity, and it is widely used in many fields, especially in mental stress [20, 39, 88]. All EEG channels are offline-referenced to the average of electrodes [3].
Based on frequency ranges, EEG signals can be classified into four bands: delta (1-4 Hz), theta (4-8 Hz), alpha (8-13 Hz), and beta (13-30 Hz). Each band represents a different function, as described in Table 4.
Table 4: Functions of brain waves [57]
Brain waves Characteristics
Delta (1-4Hz) Dominant when sleeping
Theta (4-8Hz) When temporal and occipital lobes are relaxed, awaking state
Alpha (8-3Hz) Mainly occipital and parietal lobes are relaxed, awaking state with eye closed Beta (13-30Hz) Dominant in frontal region during mental activity
By using the valence models of hemispheric specialization of emotion, Davidson et al. [20] stated that the left hemisphere is more involved in handling positive emotions and approaching-related behaviors. In contrast, the right hemisphere is more involved in han-dling negative emotions and withdrawal behaviors [88]. Recent research showed that EEG reflects brain activity and is widely used in many fields. R Khosrowabadi et al. [39] pro-posed a brain-computer interface for classifying EEG correlates of chronic mental stress.
• Cortisol
As a biochemical measurement, cortisol is one of the most common and popular bio-markers for quantifying stress in both animals and humans over the past several decades. It is widely believed that activation of the HPA axis during mental stress induces secretion of hormones, such as corticotrophin-releasing hormone and adrenal steroid hormones [35, 40].
However, there are many challenges and difficulties in measuring and quantified evalu-ating the level of stress using cortisol. First of all, not all types of acute negative stressors consistently activate HPA to trigger the cortisol changes [16, 51]. Second, even acute men-tal stressors trigger the adrenal cortex to release cortisol into the bloodstream by activating specific cognitive processes and their central nervous system. The cortisol levels can be influenced by numerous factors, such as gender, age, and caffeine [23, 41, 48].
• NASA-TLX
Numerous literature studies have confirmed that subjective measurement still plays an essential role in stress data collection. NASA-TLX, as a kind of subjective measurement, is widely used in stress measurement.
As a popular multidimensional metric, NASA-TLX is designed to obtain workload estimates immediately or after a task. Previous research on the subscale selection and weighted averaging methods has produced a tool that has proven to be reasonably easy to use and has reliable sensitivity to experimentally significant operations in recent decades [33].
Based on the principle of measuring self-reported stress, NASA-TLX calculates stress from six different dimensions: mental demands, physical demands, temporal demands, own performance, effort, and frustration. Through assessing the weight value of two factors out of six and evaluating the factor values, NASA-TLX can finally quantify the mental stress by calculating the total workload. NASA-TLX is more sensitive to low mental workloads [64].
Chapter 4
Random forest and other related
algorithms
This chapter introduces the theoretical aspect of random forest and other related algorithms, including support vector machine (SVM), decision tree, gradient boosting decision tree (GBDT), k-nearest neighbor algorithm (KNN), and deep neural networks (DNN).
4.1
The principle of random forest
The random forest learning method [10] is presented by Breiman in his article Random forests. The random forest, as a classification algorithm, is a tree-based classifier. Its theoretical background rests on the concept of bagging and decision trees. This includes developing multiple trees from the random sampling subspace of the input features, using a randomly selected subset of training samples. Then it combines the results by voting or the maximum posterior rule output. The random forest is an ensemble learning algorithm that constructs a set of individual classifiers, also referred to as base learners.
Random forest is composed of many independent decision trees. During the classifica-tion task, each decision tree in the forest will be judged and classified separately when the
new input sample is entered. Each decision tree will get its classification result. Therefore, the random forest will choose the result which has the most voted classification as the final result.
TRAINING SET
TEST SET
Out-of-bag
data Tree 2 Tree 3
…
Tree nR
andom forest
Predictive model validation
Tree 1 Tree 2 Tree 3
…
Tree nOut-of-bag data Out-of-bag data Out-of-bag data
Figure 8: The conceptual diagram of a random forest model [45]
Figure 8 indicates the conceptual diagram of a random forest model. Samples taken from the training set can generate different decision trees. Then, all decision trees are used to form a single prediction. The prediction can be validated using the testing set.
Random forest classifies observations according to most of these learners’ classifica-tion, which is often referred to as voting because observations are categorized based on decisions or votes made by most basic learners during classification [47].
4.2
Random forest algorithm
The construction of a random forest follows four steps:
1. If there areN samples for training, select N times from the N samples randomly with replacement. The selected N samples are used to train a decision tree as the samples at the root node of the decision tree.
2. When each sample hasM attributes, randomly selectm(m << M) attributes from these M attributes when each node of the decision tree needs to be split. Then select an attribute as the split attribute of the node from m attributes using some strategies. 3. During the decision tree generation, each node must be split according to step 2 until
it can no longer be split.
4. Random forest occurs by following steps 1 to 3.
The decision tree is a classic weak model. When it tries to label data, no matter the dis-tribution of the training data, it will always do better than accidentally [94]. In comparison, a random forest makes a massive development.
The random forest can judge the feature importance, determine the interaction between different features. Random forest is flexible and can increase the weak model (the decision tree) in terms of accuracy to a better extent. However, it may cost more massive computa-tional resources.
In this section, the construction and the pros and cons of the random forest have been described. It is one of the supervised learning methods that are being applied and compared in this thesis. The following section describes the fundamentals of the other supervised learning methods, the SVM, decision tree, GBDT, KNN, and DNN.
4.3
Other related algorithms
4.3.1
SVM
SVM is a supervised machine learning algorithm that can be used for classification or regression. However, it is mainly used for classification problems. In the SVM algorithm, each data item is drawn as a point in an n-dimensional space, where n is the number of features we have, and the value of each feature is the value of a specific coordinate [96]. Then, we classify by finding a hyperplane that can distinguish the two categories. SVM defines the linear classifier with the most considerable interval in the feature space. The learning strategy of SVM is to maximize the interval, which is shown in Figure 9.
Support vectors (class -1) Support vectors (class 1) Margin Hyperplane
Figure 9: The maximal margin hyperplane [6]
In the binary classification case, the training observation can be divided into two differ-ent classes, usually expressed as -1 and 1. The margin represdiffer-ents the area within the two
hyperplanes. The support vector represents the support vectors closer to the hyperplane and influences the position and orientation of the hyperplane.
Using the maximal margin classifier is generally a successful way to classify when it is possible to find a separating hyperplane, though, there might be problems with overfitting the data in some cases [31]. It is worth noting that, commonly, there does not exist a hyperplane that can separate the two classes strictly.
4.3.2
Decision tree
A decision tree is a decision support tool that uses a tree-like model of decisions and pos-sible consequences, including chance event outcomes, resource costs, and utility. It is one way to display an algorithm that only contains conditional control statements [74].
A decision tree contains nodes and directed edges, where the nodes can be classified into the root node, the internal node, and the leaf node [81]. Without a parent node, The root node represents the beginning node. The internal node represents a feature, while the leaf node represents a class. For example, the node of ’A > B’ in Figure 10 is the root node, the node of ’B > C’ in Figure 10 is the internal node, and the node of ’A > B > C’ in Figure 10 is the leaf node.
Figure 10: Sorting number using decision tree algorithm
A decision tree is a flowchart-like structure. Each internal node represents a judgment on an attribute in a decision tree, each branch represents an output of the judgment, and each leaf node represents a class label. The paths from the root to the leaf represent classification rules.
Figure 10 shows a straightforward application of the decision tree algorithm, which supposes that we want to sort three values, A, B, and C (A 6= B 6= C). To sort these values, firstly, this problem should be divided into smaller sub-problems. Then, try to figure out each sub-problem and repeat the classification step until getting the final result.
The decision tree algorithm is considered one of the best-supervised learning classifica-tion methods. The generaclassifica-tion of the decision tree can be mainly divided into the following two steps:
1. when the attribute of a node cannot be judged, divide this node intoN (N ∈Z, N ≥
2) child nodes.
The typical decision trees include Iterative Dichotomiser 3 (ID3), C4.5, and Classifica-tion and Regression Tree (CART).
ID3 uses the information gain to decide which feature goes into a decision node [70]. The information gain is expressed as:
g(D, A) = H(D)−H(D|A) (5)
whereH(D) represents the entropy of set D, the H(D|A)represents the conditional en-tropy of setDand featureA. Theg(D, A)represents the mutual information of setDand feature A. For a set of data, the smaller the entropy, the larger the information gain, the higher the impurity, the better the classification result will be. However, ID3 incurs some problems. As a smaller segmentation causes a smaller classification, ID3 may overfit the training data [24]. Moreover, the calculation of information gain depends on the size of the features.
In order to avoid this segmentation problem, C4.5 makes improvement based on ID3. C4.5 uses gain ratio to overcome the bias [70]. The gain ratio is express as :
GR(D, A) = g(D, A)
H(A) (6)
whereg(D, A)represents the mutual information of setDand featureA, theH(A) repre-sents the entropy of featureA.
By dynamically defining discrete attributes, C4.5 reduces the restriction that features must be categorical [71]. CART is similar to C4.5, but it supports numerical target variables [9]. CART is a binary tree, which only classifies the parent node into two child nodes. The Gini impurity is the lost function being used in the CART method [70].
In the analysis, decision trees and closely related influence diagrams are used as visual and analytical decision support tools, in which the expected value (or expected utility) of
competitive alternatives can be calculated.
4.3.3
GBDT
Another decision tree learning is GBDT, which has been very successfully applied to many fields such as smart city [79], and its significant advantage is the ability to find nonlinear interactions automatically through decision tree learning with the minimum error.
The GBDT using an additive model classifies or regresses the data by reducing the residuals, which are generated during the training process. Each iteration creates a weak classifier through multiple iterations, and each classifier is trained based on the residuals of the previous classifiers. In conclusion, the GBDT algorithm has four steps:
1. Each iteration generates a new decision tree.
2. Before starting each iteration, GBDT calculates the first derivative and second deriva-tive of the loss function at each training sample point.
3. GBDT generates a new decision tree through the greedy strategy and calculates the predicted value of each leaf node.
4. Add the new decision tree into the model.
The GBDT is generally regarded as one of the best out-of-the-box classifiers. It can generalize and can combine weak learners into a single strong learner. The GBDT has many nonlinear transformations and strong performances. There is no need to do complex feature engineering and feature transformation. However, the shortcoming of GBDT is still apparent. Since the boost is a serial process and is difficult to parallelize, GBDT has high computational complexity, and it is also not suitable for high-dimensional sparse features [46].
4.3.4
KNN
The KNN algorithm is one of the simplest classification algorithms and one of the most commonly used learning algorithms.
KNN is a nonparametric statistics method for classification and regression. The mech-anism of KNN can be explained as follows: given a test document to be classified, the al-gorithm searches for thek-nearest neighbors among the pre-classified training documents based on some similarity measure, and ranks thoseK neighbors based on their similarity scores, the categories of the k nearest neighbors are used to predict the category of the test document by using the ranked scores of each as the weight of the candidate categories, if more than one neighbor belongs to the same category then the sum of their scores is used as the weight of that category, the category with the highest score is assigned to the test document provided that it exceeds a predefined threshold, more than one category can be assigned to the test document [1, 18].
Figure 11: An example of KNN [83]
different classes of sample data. The white square represents data pending for classification. SupposeK = 3, the white square’s three nearest points are two white circles and one black circle. Based on statistical methods, this white square belongs to the class of white circles. However, supposeK= 5, the five points closest to the white square are two white circles and three black circles. Based on statistical methods, this white square belongs to the class of the black circles.
4.3.5
DNN
DNN is the basis of deep learning, which is part of a broader family of machine learning methods based on artificial neural networks with representation learning [92].
To understand DNN, firstly, it is essential to understand the DNN model. Figure 12 shows a general model of DNN with two hidden layers.
Input values Input layer Hidden layer 1 Hidden layer 2 Output layer
Figure 12: A general model of DNN with N hidden layers [66]
hidden layer, and the output layer. Usually, the first layer is the input layer, the final layer is the output layer, and the layers in the middle are all hidden layers [14]. A DNN consists of a succession of convolutional and max-pooling layers; the layers are fully connected. Each layer only receives connections from its previous layers.
More precisely, deep learning systems have a substantial credit assignment path (CAP) depth. The CAP is the chain of transformations from input to output. CAPs describe potentially causal connections between input and output [53].
Chapter 5
Statistical analysis and results
This chapter reviews the experimental design and setup of the SWELL-KW dataset. It then quantifies mental stress based on HRV features and selects significant features us-ing the random forest method. To validate the random forest algorithm’s performance, comparisons with other related algorithms, including SVM, GBDT, KNN, and DNN, are conducted. HRV data are imported into a Python-based program (see the source code of the program can be found in the Appendix).
5.1
SWELL-KW dataset
This section reviews the SWELL-KW related experimental design and setup. All the ex-periment data are provided by the SWELL-KW data set, which was collected within the SWELL project [43]. The collection of this data set was supported by researchers at the Institute for Computing and Information Sciences at Radboud University. It is an empirical study in the sense that it is based on real-world data.
In their experiment, they recorded many of the details regarding the data set. Therefore, the results regarding the actual meaning of the variables and classification were presented.
5.1.1
Participants
The collected data are from 25 subjects (seventeen males and eight females) with an aver-age aver-age of 25 [43]. All participants wrote their reports and presentations. They received a standard subject fee for experiment participation. To motivate the participants to do their best on the reports, they were told that the amount of the fee was dependent on their per-formance.
5.1.2
Design and tasks
In their experiment, Koldijk et al. [43] manipulated the following conditions under which the participants worked:
• Neutral ’No stress’: the participants can engage in tasks for an unlimited time. After a maximum of 45 minutes, the participant was asked to stop and informed that enough ’normal work’ data had been collected.
• Stressor ’Time pressure’: the time to complete all tasks is 2/3 of the time required by the participant in a neutral state (up to 30 minutes).
• Stressor ’Interruptions’: the participants received eight e-mails during the task. Some are related to a task, while others are irrelevant. Some e-mails require a reply, while others do not. For example, "Can you look up when Einstein was born?" or "I found many beautiful pictures for this website’s demonstration."
Participants are asked to write reports and make presentations on predefined topics. Six topics are prepared, including three opinion topics and three information topics. In the opinion topics, participants need to perform Experience and opinion about ’stress at work’, ’healthy living’, or ’privacy on the internet’. At the same time, three information topics include describing 5 Tourist attractions in Perth (West Australia), planning a coast to coast road trip in the USA, and writing about the life of Napoleon.
All participants worked under all three conditions. The neutral condition was always the first condition in order to collect an uninfluenced baseline of normal working. The order of the two stressor conditions was counterbalanced, see Figure 13. The within-subject design included relaxation breaks in starting each condition in a well-rested state.
Figure 13: The design process [43]
In Figure 13, The neutral condition represents no stress situation, which is considered as the baseline of normal working. 13 participants use order A, while 12 participants use order B. The orders of two stressor conditions are balanced.
This data set focuses on high task load stress in-terms of mental demand, frustration, and temporal demand in working professionals [42]. The raw and preprocessed signals are available in the SWELL-KW data set.
5.1.3
Procedure
In order to record the stress response of the experiment and reduce the influence of other factors on the experiment, they instructed the participants not to smoke or drink caffeine 3 hours before the experiment. Before the experiment started, the experiment and records were explained, and all participants signed a consent form to confirm that the recorded data can be used for research purposes. The experiment used body sensors. When the experimenter checked the records, the participants read the experiment description and fill in the questionnaire.
As shown in Figure 13, the experiment is divided into three different blocks for different mental stress conditions. Each block lasts approximately 1 hour. Before starting each block, there exist 8 minutes of relaxation. In each block, participants are provided with two of the six topics selected randomly from the list. The two topics include one opinion topic and one information topic. Participants are asked to write two reports for both topics and choose one topic to make a presentation. Participants are provided with different topics in each block. In both stress conditions, participants were provided with a countdown clock to show the remaining time.
After completing the task, the participants are asked to fill out a questionnaire about the current block. Repeat the relaxation, task execution, and questionnaire process for blocks 2 and 3, as shown in Figure 13. The subjects were given a short rest between these two conditions, and the entire experiment took about 3 hours. After the experiment, participants need to report it.
5.2
Preprocessing
In the SWELL-KW data set, HRV features were computed as follows [63]:
1. An Inter-beat Interval (IBI) signal is extracted from the peaks of the ECG of each subject.
2. Each HRV index is computed on a 5-minute IBI array.
3. A new IBI sample is appended to the IBI array, while the oldest IBI sample is deleted. The new IBI array is used to compute the next HRV index.
This process is repeated until the end of the entire IBI signal.
The inputs of the SWELL-KW dataset were R-R intervals. In this thesis, the provided data sets are preprocessed. The SWELL-KW data set provides both processed training data
![Figure 1: The relationship between performance and mental stress [58]](https://thumb-us.123doks.com/thumbv2/123dok_us/9226689.2807120/20.918.274.692.562.760/figure-relationship-performance-mental-stress.webp)


![Figure 4: The anatomy of heart [4]](https://thumb-us.123doks.com/thumbv2/123dok_us/9226689.2807120/28.918.342.628.123.377/figure-the-anatomy-of-heart.webp)
![Figure 5: The conduction system of heart [50]](https://thumb-us.123doks.com/thumbv2/123dok_us/9226689.2807120/31.918.358.617.128.506/figure-the-conduction-system-of-heart.webp)
![Table 1: Components’ inherent rates in the cardiac conduction system [37]](https://thumb-us.123doks.com/thumbv2/123dok_us/9226689.2807120/32.918.283.698.237.471/table-components-inherent-rates-cardiac-conduction.webp)
![Figure 6: A typical normal ECG waveform [59]](https://thumb-us.123doks.com/thumbv2/123dok_us/9226689.2807120/33.918.263.712.284.526/figure-a-typical-normal-ecg-waveform.webp)
![Table 2: Time domain features [80]](https://thumb-us.123doks.com/thumbv2/123dok_us/9226689.2807120/35.918.184.769.148.356/table-time-domain-features.webp)
![Table 3: Frequency domain features [80]](https://thumb-us.123doks.com/thumbv2/123dok_us/9226689.2807120/36.918.186.783.140.473/table-frequency-domain-features.webp)