Malware Function Estimation Using API in
Initial Behavior
著者
KAWAGUCHI Naoto, OMOTE Kazumasa
journal or
publication title
IEICE Transactions on Fundamentals of
Electronics, Communications and Computer
Sciences
volume
E100.A
number
1
page range
167-175
year
2017-01
権利
(C) 2017 The Institute of Electronics,
Information and Communication Engineers
URL
http://hdl.handle.net/2241/00145746
PAPER
Special Section on Cryptography and Information SecurityMalware Function Estimation Using API in Initial Behavior
∗
Naoto KAWAGUCHI†,Nonmember andKazumasa OMOTE††a),Member
SUMMARY Malware proliferation has become a serious threat to the Internet in recent years. Most current malware are subspecies of existing malware that have been automatically generated by illegal tools. To con-duct an efficient analysis of malware, estimating their functions in advance is effective when we give priority to analyze malware. However, estimating the malware functions has been difficult due to the increasing sophistication of malware. Actually, the previous researches do not estimate the functions of malware sufficiently. In this paper, we propose a new method which esti-mates the functions of unknown malware from APIs or categories observed by dynamic analysis on a host. We examine whether the proposed method can correctly estimate the malware functions by the supervised machine learning techniques. The results show that our new method can estimate the malware functions with the average accuracy of 83.4% using API in-formation.
key words: malware, function estimation, risk evaluation, supervised ma-chine learning, dynamic analysis
1. Introduction
Malware is rapidly increasing with the spread of the Inter-net, and the damage caused and the potential damage by malware has become a serious matter. For example, Sony Pictures Entertainment was hacked using multiple malware [1]. To prevent malware infection, installation of the an-tivirus software is essential. However, malware is gradu-ally increasing in sophistication not to be detected by an-tivirus software. Most malware use various techniques such as encryption or obfuscation in order to evade detection by antivirus software. Furthermore, sophisticated malware is generated in bulk by malware generating tools. As a result of sophistication and mass generation of malware, a previ-ous signature-based pattern matching technique, tradition-ally used to detect malware, has already reached its limit, and thus developing a statistically-meaningful method of de-tection is becoming necessary.
To overcome this challenge, recently, many researchers have conducted a large number of studies using malware analysis approaches. Malware analysis approaches can be separated into the static and dynamic analysis methods. The
Manuscript received March 22, 2016. Manuscript revised August 26, 2016.
†The author is with Japan Advanced Institute of Science and
Technology, Nomi-shi, 932-1292 Japan.
††The author is with the Faculty of Engineering,
Informa-tion and Systems, University of Tsukuba, Tsukuba-shi, 305-8573 Japan.
∗The preliminary version of this paper was presented at
AsiaJ-CIS’15[9].
a) E-mail: [email protected] DOI: 10.1587/transfun.E100.A.167
static analysis method analyzes the assembly code obtained by disassembling the malware executable file; its advantage is that we can investigate malware in detail. However, the code of most malware is increasingly becoming more ob-fuscated, so analysis requires expertness and a lot of time. On the other hand, the dynamic analysis method analyzes the behavior of malware executed in a closed environment. Its advantage is that we can observe the malware’s behav-ior without advanced expertise since dynamic analysts can use many analysis tools. However, we cannot estimate the amount of time required observing the behavior of malware in the dynamic analysis. Also, the malware may not work properly in the analysis environment.
Most current malware are subspecies of existing mal-ware that have been automatically generated by illegal tools.
To conduct an efficient analysis of malware, estimating their
functions in advance is effective when we give priority to
analyze malware. However, the previous researches do not estimate the functions of malware.
For an efficient analysis regarding time and the size of
log, the short time for analysis is required. It is desirable that the malware function can be estimated in the early stage of dynamic analysis even if all the behavior of malware is not analyzed. Although bot-type malware executes many malicious functions for the long term, it may be able to be estimated only in the early stage of dynamic analysis. Note that performance such as accuracy may worsen when only the information in the early stage is used.
Contribution. The purpose of our study is to esti-mate the functions of unknown malware. To the best of our
knowledge, there was only the one research[3]which
ap-propriately estimates the malware functions. However, it is
different from our method which tries to estimate the
func-tions only in the early stage of dynamic analysis. We use malware activity information such as API or category
ob-tained by dynamic analysis (i.e., FFRI Dataset 2015 [7]).
We estimate the malware functions by such API or cat-egory information using the supervised machine learning techniques. Such dataset includes the results of malware dy-namic analysis obtained within the first 90 or 120 seconds of malware execution on a host, and thus we use only the initial behavior of malware. It is our challenge that we try to estimate the functions only in the early stage of dynamic analysis. From the experimental results, we can see that our method is able to estimate the malware functions with the average accuracy of 83.4% using API information.
The rest of the paper is organized as follows: Section 2
168
IEICE TRANS. FUNDAMENTALS, VOL.E100–A, NO.1 JANUARY 2017
introduces related works. Section 3 describes the dataset, the supervised machine learning algorithms, and the mal-ware functions as preliminaries. Section 4 describes the proposed method, Sect. 5 shows our experiment and Sect. 6 discusses our results. Finally, we concludes this paper in Sect. 7.
2. Related Work
As the researches relevant to our method, we summarize the estimation methods of malware functions and the malware classification methods. Most of these studies used the static [3],[5],[10],[11],[13],[14],[17],[18],[21],[22], dynamic
[4], [19] or hybrid [6] analysis methods. Actually, static
analysis is becoming difficult because of the increasing
so-phistication of malware, and thus we focus on dynamic anal-ysis approach. Two kinds of methods are described in the following paragraphs.
2.1 Estimation Methods of Malware Functions
The estimation of malware functions is not sufficiently
stud-ied. Okubo et al. [13] proposed a function estimation
method for malware, but it evaluated only a small number of malware. Furthermore, a statistical result such as accu-racy, FPR and FNR is not derived in the paper.
Usui et al. [18] proposed the estimation methods of
malware functions using API information. APIs give a func-tion into the program, so observing their behavior can be used to identify the function of malware. They estimate malware functions by SVM using the API call frequency as a feature. However, this method has three drawbacks; (1) It classifies the malware function into one function by force. As a result, the malware function cannot be classified correctly if it has multiple functions since the label corre-sponds to a single function, (2) It does not evaluate FPR and
FNR, and (3) The number of samples may not be sufficient.
More specifically, this paper uses 50 malware samples as a training and 15 malware samples as a test. Therefore, this method has many drawbacks although it is the closest to our research.
Comparetti et al.[3]proposed a solution to determine
the capabilities (malicious functionality) of malware. This solution statically identifies dormant functionality (func-tionality that is not observed during dynamic analysis) in malicious programs. Most dynamic malware analysis has a problem that only a small subset of all possible malicious behaviors is observed within the short time. This method solves the above problem, but our method does not solve this. We dare to use only the initial behavior of malware and show that our method can estimate the malware functions in the early stage of dynamic analysis.
Kolbitsch et al. [10] presented a approach to extract
from a given malware binary the instructions that were re-sponsible for a certain activity of the malware sample. It isolates and extracts these instructions and generate a so-called gadget, i.e., a stand-alone component that
encapsu-lates a specific behavior. This method can extract gadget which constructs the group of some malware functions,
al-though it is different from our approach of the function
esti-mation of malware.
2.2 Classification Methods of Malware
Although the classification of malware is a little different
from our research, we explain it as a similar research. The
classification method of malware by Sami et al.[14]extracts
only the frequent API sequences from a large number of APIs used in their evaluation. These APIs are divided into the function categories defined by Microsoft Developer Net-work[12], thereby, feature vector is reduced from 44,605 to 95 dimensions. Furthermore, in order to improve the clas-sification accuracy of malware, they have chosen 4 dimen-sions by high Fisher score. However, the unpacking method
in this method[14]cannot deal with handmade packers and
the extracted APIs are numerous, so this method is unprac-tical.
As a method of classifying a malware family, Zhong
et al.[21]classified unknown malware into a known
mal-ware family. They use several features such as the cyclo-matic complexity used by software test, the number of func-tions that call a function, the number of funcfunc-tions that are called in a function, the number of instructions, the number of arguments, and the number of local variables. In addi-tion, they visualized this classification results. This work shows that (1) the same malware families with a high ratio of common functions are the same author and (2) malware in these families uses the same tool and compiler, or have a large number of the same functions. Their method can detect obfuscated APIs even if their Import Address Tables are destructed. However, the classification accuracy of their method is only 61.6%.
Kong et al.[11]presented a framework that can
clas-sify malware variants into their corresponding families. It extracts the function call graph from each malware program, and collects various types of features at the function level,
such as opcode, memory, register, I/O, Flag and API. It
fur-ther learns discriminant malware distance metrics that eval-uate the similarity between the function call graphs of two malware programs. Experimental results show that the av-erage F-1 measures is over 94.80% when distance learning is performed by SVM.
Park et al. [8]proposed a method to derive the
com-mon execution behavior of a family of malware instances. For each instance, a graph is constructed that represents ker-nel objects and their attributes, based on system call traces,
i.e., a kernel object behavioral graph. Hu et al.[6]proposed
a system by exploiting the complementary nature of static and dynamic clustering algorithms to partition malware into families. It compares the performance in terms of cluster-ing precision, recall and coverage with individual static and dynamic clustering component.
Tian et al.[17]learned a string set from extracted
classified malware samples into 11 families. The classifi-cation accuracy is claimed to be 97%. However, according
to experiments conducted by[21], the accuracy was found
to be only 21.2%. Therefore, this method may not be able to support the recent sophisticated malware, or may use the inadequate dataset.
Higashi et al.[5]focused on each functions in malware
code, and classified malware by calculating the similarity among each malware’s function codes. However, the cal-culation cost may become large since the similarity calcu-lation depends on the file size. Furthermore, this method has to calculate the similarity against all functions by brute force. In addition, unpacking will be necessary if malware is packed, but this research has a strong assumption that mal-ware is already unpacked.
2.3 Detection Methods Using System Call Sequences
Xiao et al. [20] proposed a supervised Topic Transition
Model in which Markovian dependence is integrated to model the sequential nature of the system call data. Any system call sequence can be characterized by a set of latent topics. It can predict class labels of unseen system call
se-quences. Canali et al.[2]presented a systematic approach
to measure how the choice of behavioral models influences the quality of a malware detector. It focus on using system calls, with and without parameters, as the atomic operations that models can use to characterize program behavior. It evaluates system call sequences for malware detection us-ing n-grams, tuples and bags.
3. Preliminaries
3.1 FFRI Dataset 2015
FFRI Dataset 2015 is one of the research datasets contained
in MWS Datasets 2015 [7], in which FFRI, Inc.†
col-lected the dynamic analysis logs of malware samples. FFRI Dataset 2015 includes previous datasets, FFRI Dataset 2013 and FFRI Dataset 2014. These logs are operated for 90 seconds in 2013 and 2014 and 120 seconds in 2015 per malware sample. FFRI Dataset 2015 provides 3,000 json-formatted malware samples collected from Jan. 2015 to Apr. 2015. FFRI Dataset 2014 provides 3,000 json-formatted malware samples collected from Jan. 2014 to Apr. 2014. FFRI Dataset 2013 provides 2,644 JSON-formatted mal-ware samples, which includes 2,641 malmal-ware samples and remote access malware, SpyEye malware, and MBR de-struction malware collected from Sep. 2012 to Mar. 2013. These datasets are dynamic analysis logs of malware
sam-ples collected by Cuckoo Sandbox††, which is a malware
analysis tool. This analysis log includes “api” and “cate-gory” names used by malware on Cuckoo Sandbox. In ad-dition, FFRI Dataset 2014 provides analysis logs collected
†http://www.ffri.jp/
††http://www.cuckoosandbox.org/
by FFR yarai analyzer Professional†††.
3.2 API and Category
API (Application Programming Interface) gives a function to program such as file manipulation, registry manipulation, and system manipulation. On the other hand, the category we use in this paper can roughly aggregates the APIs. From the analysis log collected by Cuckoo Sandbox, API calls can be map to the categories. For example, the API named “LdrloadDll” has the function of system manipulation, so the category of this API can be “system”.
3.3 Machine Learning Algorithms
Machine learning is largely divided into the supervised and unsupervised learning. The supervised learning uses the correct input-output pairs as training data. The purpose of supervised learning is to obtain a correct output against the input data. On the other hand, the purpose of unsupervised learning is to find the regularity from input data. Our re-search has a classification advantage that the answer exists, so we use the supervised learning algorithms. In the fol-lowing section, we explain about the five machine learning algorithms to be used in this study.
3.3.1 Support Vector Machine (SVM)
This method looks for the hyperplane of maximization of margin from training data. The closest distance data from the hyperplane is called a support vector. Keeping the max-imum margin between a support vector and hyperplane, we can minimize the generalization error. SVM has the one-vs-one SVM and the one-vs-all SVM. Although SVM is a binary class classifier, the binary class problem can be corresponded to the multiclass one called to the one-vs-all SVM. The binary class problem is extended to multiclass one called to the one-vs-one SVM. Our research uses Lin-earSVC which is the one-vs-all SVM.
3.3.2 C4.5
This classifier is extension of ID3, which is one of the deci-sion tree algorithms. C4.5 classifies data using the ratio of information gain based on entropy. Due to the large variance of results, the tree structure could vary largely depending on data selection.
3.3.3 Random Forest
This is an ensemble learning algorithm, in which the mul-tiple decision trees of weak classifier are combined to one classifier. In each nodes of the decision tree, we randomly select only predetermined number of predictor variables to suppress the overfitting.
170
IEICE TRANS. FUNDAMENTALS, VOL.E100–A, NO.1 JANUARY 2017
3.3.4 Naive Bayes
This classifier is based on Bayes’ theorem and assumes the independence of events. The probability that an observed
dataxbelongs to the classCiis calculated by evaluating the
following likelihoodP(x|Ci).
P(x|Ci)=
∏
j
P(xj|Ci) (1)
To classify the observed data into the optimal class, we find
the classCi that likelihood is maximum, i.e., we calculate
the following formula. arg max
i
P(Ci|x) (2)
Naive Bayes has three kinds of algorithms such as Gaussian Naive Bayes whose feature amount is assumed to follow Gaussian distribution, Bernoulli Naive Bayes whose fea-ture amount has binary value whether the event occurs or not, and Multinomial Naive Bayes whose feature amount is the frequency of events. Our research uses Bernoulli Naive Bayes since the label has binary value.
3.3.5 k-Nearest Neighbor
The principle behind the classifier is to find a predefined number of training samples closest in distance to the new point, and predict the label from these. The distance gener-ally uses the Euclidean distance.
3.3.6 N-gram
N-gram is known as one of the natural language processing
methods. N-gram is a contiguous sequence ofnitems from
a given sequence of text or speech. We use the word unit
N-gram. For example, in the case of 2-gram,{Hack the Planet}
becomes{Hackthe, thePlanet}.
3.4 Malware Function
Malware function indicates the function such as “remote control” or “copy itself”. It is necessary to investigate the malware functions for labels of supervised machine learning techniques. So we investigate the malware functions using
Symantec Security Response (SSR) information [16]. To
strictly refer to SSR information, we use only functions de-scribed in the SSR information. For example, even if the main function of malware is to enlarge the infection range such as worm, we do not use the “copy itself” function if SSR information does not describe “copy itself”. Scareware is a form of malicious software that uses social engineering to cause shock, anxiety, or the perception of a threat in or-der to manipulate users into buying unwanted software. We estimate the function of this malware to “display ad” since the purpose of this makes a user purchase the product.
4. Our Method
We propose a new method which estimates the functions of unknown malware from APIs or categories observed by dynamic analysis on a host. Our method is divided into two phases; the learning phase and the estimation phase. The feature extraction, as a preprocessing step in the above both phases, is necessary, where we extract API or category strings from the output of malware dynamic analysis. In the learning phase, we generate feature vectors and labels to construct the estimation model. In order to generate labels, we investigate the malware functions from the authorized website of malware information such as Symantec Security Response (SSR). In the estimation phase, we estimate mal-ware functions using our estimation model generated in the learning phase. In the following, we describe the detail of each phase.
4.1 Preprocessing (Feature Extraction)
The feature extraction is a preprocessing step in both learn-ing phase and estimation phase. We extract “API strlearn-ing” or “category string” used by malware from dataset as a fea-ture. Subsequently, we preserve the extracted APIs or
cat-egories from all malware into a database (named f eatDB).
We store APIs or categories used by all malware samples on
f eatDBand also store APIs or categories used by each
mal-ware sample on f eatArray. Note that f eatArrayhas
two-dimensional array. These databases are used to generate fea-ture vectors in both phases. Algorithm 1 shows the feafea-ture
extraction algorithm which outputs f eatDBand f eatArray
from dataset. We use the following variables; dataset:
JSON format files of analysis logs, f eatDB: a database of
all APIs/categories used in dataset, f eatArray: an array of
the APIs/categories used by each malware sample,curMal:
JSON format file of each malware, and exFeat: the
ex-tracted APIs/categories.
4.2 Learning Phase
We generate feature vectors and labels in this phase. In
the example of feature vectors shown in Table 1, MalBhas
Feat2andFeat3, whereℓis the number of malware species
and m is the number of variety of features in the feature
vectors. “1” shows that malware has a corresponding fea-ture but “0” shows that malware does not have it. Note that
Featmcorresponds tom-th API or category string.
Further-more, in order to aim at improving performance, we gen-erate the detailed feature vectors of frequency in the use of
APIs/categories such as Table 2. The frequency approach
can have much amount of information rather than the exis-tence approach. We can easily count the number of
func-tions stored in f eatArray.
We create a label as a supervisor against the malware
functions. In the example of labels shown in Table 3,MalC
Table 1 Example of feature vectors (existence). Feat1 Feat2 Feat3 ... Featm
MalA 1 0 0 ... 1
MalB 0 1 1 ... 0
MalC 0 1 1 ... 0
... ... ... ... ... ...
Malℓ 0 1 1 ... 1
Table 2 Example of feature vectors (frequency). Feat1 Feat2 Feat3 ... Featm
MalA 5 0 0 ... 2
MalB 0 12 1 ... 0
MalC 0 8 2 ... 0
... ... ... ... ... ...
Malℓ 0 3 3 ... 2
Table 3 Example of labels.
Func1 Func2 Func3 ... Funcn
MalA 0 1 0 ... 0
MalB 1 1 1 ... 0
MalC 0 1 1 ... 0
... ... ... ... ... ...
Malℓ 0 1 0 ... 1
Algorithm 1Feature extraction (existence)
Input:dataset
Output: f eatDB,f eatArray 1: f eatDB=()
2: for eachcurMal∈datasetdo
3: ifcurMal.Symantec detected==T ruethen
4: f eatArray.curMal=() 5: for allexFeat∈curMaldo
6: ifthis feature is not exists inf eatArraythen
7: f eatArray.curMal+=exFeat
8: ifthis feature is not exists inf eatDBthen
9: f eatDB+=exFeat 10: end if 11: end if 12: end for 13: end if 14: end for
malware functions in the labels. Note that Funcn
corre-sponds ton-th malware function such as “copy itself”. This
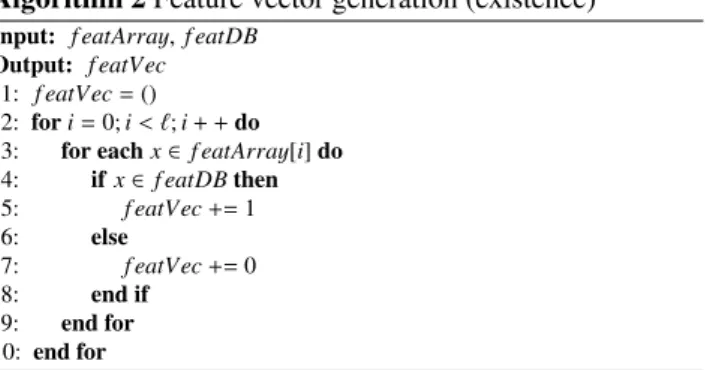
should be correct output data corresponding to input data since it is the answer (supervisor) of malware function. We use the supervised machine learning techniques to generate the estimation model. Algorithm 2 shows the algorithm of
feature vector generation, which outputs f eatVec: the
fea-ture vector of malware.
We investigate the functions about extracted malware in order to generate the label. We refer to malware name from “result” key in the JSON file of dataset, and we iden-tify the malware functions from the authorized website of malware information.
4.3 Estimation Phase
We estimate the malware functions based on our estimation
Algorithm 2Feature vector generation (existence)
Input: f eatArray,f eatDB
Output: f eatVec 1: f eatVec=()
2: fori=0;i< ℓ;i+ +do
3: for eachx∈ f eatArray[i]do
4: ifx∈f eatDBthen 5: f eatVec+=1 6: else 7: f eatVec+=0 8: end if 9: end for 10: end for
model generated in the learning phase. The input is new fea-ture vector of unknown malware and the estimation model, and the output is “1” or “0”, where “1” shows that unknown malware has a corresponding function but “0” shows that unknown malware does not have it. This means that new feature vector is evaluated by the estimation model. Thus, this model stochastically identifies whether unknown mal-ware has a certain function or not.
5. Experiment
In order to evaluate the effectiveness of estimation of
mal-ware functions using machine learning algorithms, our method uses only API or category information from dy-namic analysis logs of FFRI Dataset 2013, 2014 and 2015. While FFRI Dataset 2013 and 2015 provide with analysis results by Cuckoo Sandbox, FFRI Dataset 2014 provides with analysis results by Cuckoo Sandbox and FFR yarai an-alyzer Professional. Our research uses analysis the results by Cuckoo Sandbox in 2013, 2014 and 2015.
The problem of malware dynamic analysis is the mal-ware operating time for analysis. The experiment shows that our method can estimate the malware functions in short time
for 90/120 seconds per malware sample.
5.1 Experimental Procedure
We evaluate our estimation of malware functions using our method described in Sect. 4. In the following, we explain the experimental procedures of the feature extraction, learning and estimation.
5.1.1 Feature Extraction
We extract only the APIs/categories of malware detected by
Symantec Antivirus Software on FFRI dataset. More
specif-ically, we extract only the APIs/categories in malware’s
ac-tivity logs of such dataset, in which API or category infor-mation can be extracted from “API” key or “category” key. Furthermore, we focus on malware only that the value of “detected” key in the “Symantec” key is “True”. Note that
we extracted APIs/categories from FFRI dataset using the
regular expression. As a result, we extracted 155 APIs and 15 category types in total.
172
IEICE TRANS. FUNDAMENTALS, VOL.E100–A, NO.1 JANUARY 2017
Table 4 Detail of extracted malware in our experiment.
Type Number Type Number
Adware 12 PasswordRevealer 1 Backdoor 151 PremiumSMSScam 28 BackOrifice 1 PWS 1 Dialer 3 SecShieldFraud 63 Downloader 164 SecurityRisk 2 Gamevance 42 SecurityToolFraud 1 Infostealer 100 Spyware 4
IRC Trojan 1 Trojan 291
OptimumInstaller 4 W32 988
Total 1857
Table 5 Malware functions. Function name Explanation
remote control remotely control the infected PC
send spam send an email spam using the stored address list on the infected PC
display ad display advertisement on its desktop
copy itself replicate itself in order to spread to other computers keylogger record the keys struck on a keyboard
send info send information on the infected PC to the outside backdoor open the backdoor
downloader download files such as malware
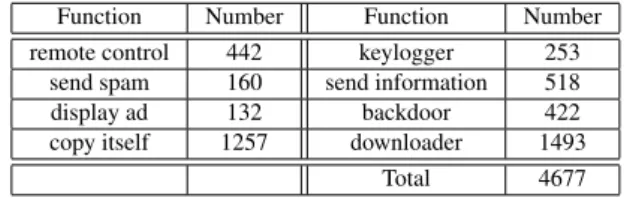
Table 6 The number of functions of extracted malware in our experi-ment.
Function Number Function Number remote control 442 keylogger 253
send spam 160 send information 518
display ad 132 backdoor 422
copy itself 1257 downloader 1493
Total 4677
We randomly extract malware from dataset 2013, 2014 and 2015. As a result, we obtained 1857 malware sam-ples shown in Table 4. The number of types of malware extracted from these samples is 99. In these samples, we gave type name of malware until before the first “.” in nam-ing convention of malware by Symantec. For example, if malware name is “Backdoor.Graybird”, this type name is “Backdoor”.
5.1.2 Learning
We generate the feature vector and the label of malware such
as the example of Tables 1, 2 and 3. The numbermof
fea-tures is 155 (API) or 15 (category), and the numberℓof
ex-tracted malware is 1857. In this experiment, we used eight
basic functions of malware (n =8) as described in Table 5.
In order to generate labels, we carefully investigate the mal-ware functions using SSR information. Table 6 shows the number of functions extracted malware samples in our ex-periment. Note that we chose eight basic functions which can be extracted from SSR information.
We refer to malware name in Symantec from “result” key in the JSON file of FFRI dataset. We identify the mal-ware functions from SSR information Note that the malmal-ware
function is not described in SSR. We examined the detail of SSR information carefully to identify malware functions for each extracted malware.
Note that we eliminated the following malware; (1) malware whose information is not described in SSR infor-mation, (2) malware whose function is not identified by SSR information, and (3) malware detected by heuristic method such as Bloodhound.
5.1.3 Estimation
We estimate the malware functions using feature vectors as an input. We use five kinds of the basic supervised machine learning algorithms, i.e., LinearSVC (LSVC), C4.5, Ran-dom Forest (RF), Naive Bayes (NB), and k-Nearest Neigh-bor (kNN) in order to compare with each method about which classifier is the best. These are implemented in
de-fault settings using scikit-learn[15]of machine learning
li-brary of Python. We conduct the 5-fold cross validation to evaluate our estimation.
We calculate the accuracy, FPR and FNR as the evalu-ation index. The accuracy shows how much our method can be estimated correctly, FPR shows the conditional probabil-ity of a positive test result given an absent event, and FNR shows the conditional probability of a negative test result given that the event being looked for has taken place. We show the three equations as follows.
Accuracy=# of malware of correctly classified
The total number of test data (3)
FPR= # of malware that misclassified to True
# of malware that do not have a function (4)
FNR=# of malware that misclassified to False
# of malware that have a function (5)
The value of the label is converted from a binary string to an integer. More precisely, the label is 1, 2, 4, . . ., 2n−1 corresponding to the order from the rightmost element,
re-spectively. For example, if the label of Malx is [0,1,0,1]
where the length of label is 4,MalxhasFunc2andFunc4.
If the integer value of Malx’s label is 5, Malx is correctly
estimated.
5.2 Results
While Tables 7–9 show Accuracy, FPR and FNR in case of using API frequency, Tables 10–12 show Accuracy, FPR and FNR in case of using category frequency. These results show the average of 5-fold cross validation. Here we only show the result of using only frequency since the result of using frequency is better than using existence in our prelim-inary experiment.
The accuracy values are 83.4% (API) and 83.6% (cat-egory) on average from Tables 7 and 10. We found that the accuracy was overall high. Especially, the highest accuracy values are 89.6% (API) and 89.1% (category) by Random Forest, and the lowest ones are 72.8% (API) and 81.8% (cat-egory) by Naive Bayes. The accuracy of “display ad” has
Table 7 Accuracy (API frequency).
remote control send spam display ad copy itself keylogger send information backdoor downloader Avg.
LSVC 0.759 0.836 0.905 0.785 0.790 0.763 0.779 0.822 0.805 C4.5 0.838 0.915 0.967 0.833 0.872 0.845 0.837 0.841 0.869 RF 0.869 0.927 0.981 0.870 0.887 0.876 0.869 0.886 0.896 NB 0.715 0.750 0.949 0.706 0.658 0.689 0.708 0.649 0.728 kNN 0.829 0.920 0.978 0.827 0.871 0.835 0.830 0.868 0.870 Avg. 0.802 0.870 0.956 0.804 0.816 0.802 0.805 0.813 0.834
Table 8 FPR (API frequency).
remote control send spam display ad copy itself keylogger send information backdoor downloader Avg.
LSVC 0.200 0.123 0.087 0.356 0.147 0.173 0.172 0.610 0.234 C4.5 0.102 0.046 0.018 0.269 0.077 0.095 0.108 0.348 0.133 RF 0.061 0.015 0.006 0.184 0.032 0.076 0.063 0.344 0.098 NB 0.325 0.234 0.026 0.179 0.357 0.365 0.340 0.276 0.263 kNN 0.108 0.010 0.010 0.300 0.045 0.108 0.092 0.402 0.134 Avg. 0.159 0.086 0.029 0.258 0.132 0.163 0.155 0.396 0.172
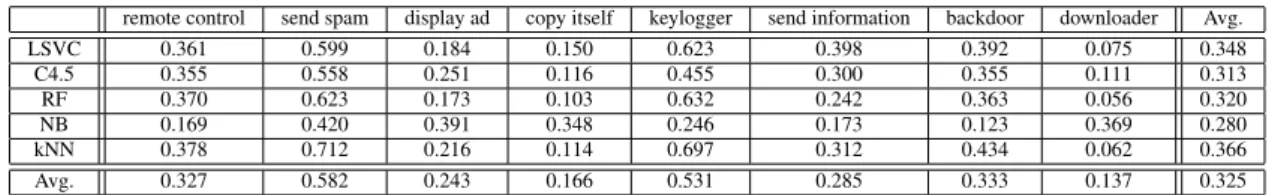
Table 9 FNR (API frequency).
remote control send spam display ad copy itself keylogger send information backdoor downloader Avg.
LSVC 0.361 0.599 0.184 0.150 0.623 0.398 0.392 0.075 0.348 C4.5 0.355 0.558 0.251 0.116 0.455 0.300 0.355 0.111 0.313 RF 0.370 0.623 0.173 0.103 0.632 0.242 0.363 0.056 0.320 NB 0.169 0.420 0.391 0.348 0.246 0.173 0.123 0.369 0.280 kNN 0.378 0.712 0.216 0.114 0.697 0.312 0.434 0.062 0.366 Avg. 0.327 0.582 0.243 0.166 0.531 0.285 0.333 0.137 0.325
the highest value (i.e., 95.6% (API) and 94.2% (category)). We found that the accuracy of tree-based algorithms such as C4.5 and Random Forest became comparatively high.
The average values of FPR are 17.2% (API) and 16.9% (category) and the average values of FNR are 32.5% (API) and 40.8% (category). We found that FNR is compara-tively higher than FPR, although in general a low FNR is more important than a low FPR. Especially, FNR values of “send spam” and “keylogger” were pretty higher. More precisely, FNR values of “send spam” are 58.2% (API) and 73.6% (category), and FNR values of “keylogger” are 53.1% (API) and 69.0% (category). This means that mal-ware with “send spam” or “keylogger” are wrongly judged as “not send spam” or “not keylogger”, respectively.
6. Discussion
6.1 Accuracy, FPR and FNR
The accuracy of tree-based algorithms such as C4.5 and RF becomes comparatively high. NB has a smooth and con-tinuous boundary for discrimination, but the tree-based al-gorithms do not have such a smooth boundary. A smooth boundary has a disadvantage; NB with a smooth boundary may cause false classification near a boundary if feature vec-tors have a distinct border. In this case, the tree-based al-gorithms are generally better suited for our feature vectors. Therefore, we guess that our method is suitable for the tree-based algorithms.
6.2 API vs Category
The purpose of using category is dimension reduction. As
for the accuracy, the results using categories are almost the same as ones using APIs. However, we found that FNR of category became considerably worse in some functions. More precisely, FNR of category decreases by 38% (display ad), 23% (keylogger) and 20% (send spam). Therefore, us-ing categories may not be suitable for our method to esti-mate some functions.
6.3 Malware Functions
The accuracy of malware with the function of “display ad” is very high. We consider that little malware has both “display ad” and the other functions as described in Table 13. In our examination, the number of “display ad” function is 132 but the number of the other functions with “display ad” is less than 8. The accuracy may become high since there is a
difference between “display ad” and the other functions, and
thus most malware with the function of “display ad” would
have unique APIs/categories.
We found that FNR values of “send spam” and “key-logger” were pretty high, that is, more than 50%. Although we do not find a great tendency in particular from our exam-ination, the results show that APIs used in “send spam” or “keylogger” are also used in other functions of malware.
Restriction. Malware functions are referred to infor-mation by Symantec. If SSR inforinfor-mation is wrong or
insuf-ficient, it may affect the accuracy, FPR and FNR. Actually,
even the worm do not describe the function of “copy itself” in our survey. Although the label of malware functions in
this experiment may be different from the actual malware
174
IEICE TRANS. FUNDAMENTALS, VOL.E100–A, NO.1 JANUARY 2017
Table 10 Accuracy (category frequency).
remote control send spam display ad copy itself keylogger send information backdoor downloader Avg.
LSVC 0.710 0.805 0.839 0.732 0.795 0.638 0.727 0.664 0.739 C4.5 0.844 0.901 0.967 0.830 0.871 0.841 0.830 0.870 0.869 RF 0.865 0.935 0.980 0.847 0.902 0.861 0.863 0.874 0.891 NB 0.794 0.912 0.953 0.670 0.835 0.792 0.792 0.792 0.818 kNN 0.825 0.917 0.969 0.824 0.875 0.805 0.835 0.868 0.865 Avg. 0.808 0.894 0.942 0.781 0.856 0.787 0.809 0.814 0.836
Table 11 FPR (category frequency).
remote control send spam display ad copy itself keylogger send information backdoor downloader Avg.
LSVC 0.264 0.138 0.121 0.543 0.103 0.331 0.218 0.651 0.296 C4.5 0.091 0.054 0.022 0.256 0.068 0.107 0.110 0.291 0.125 RF 0.052 0.006 0.003 0.211 0.020 0.081 0.059 0.389 0.103 NB 0.156 0.025 0.017 0.349 0.066 0.137 0.145 0.594 0.186 kNN 0.101 0.014 0.009 0.270 0.037 0.129 0.094 0.440 0.137 Avg. 0.133 0.047 0.034 0.326 0.059 0.157 0.125 0.473 0.169
Table 12 FNR (category frequency).
remote control send spam display ad copy itself keylogger send information backdoor downloader Avg.
LSVC 0.363 0.833 0.704 0.144 0.886 0.444 0.477 0.261 0.514 C4.5 0.372 0.551 0.198 0.128 0.500 0.282 0.372 0.094 0.312 RF 0.411 0.671 0.243 0.126 0.607 0.292 0.389 0.066 0.351 NB 0.370 0.885 0.480 0.320 0.784 0.395 0.420 0.115 0.471 kNN 0.399 0.742 0.333 0.128 0.674 0.365 0.424 0.061 0.391 Avg. 0.383 0.736 0.392 0.169 0.690 0.356 0.416 0.119 0.408
Table 13 The total number of functions about malware with “display ad”.
remote control send spam display ad copy itself keylogger send information backdoor downloader
0 0 132 5 0 4 1 7
Table 14 Results using 1-gram and 2-gram on average.
API Category
Accuracy FPR FNR Accuracy FPR FNR 1-gram 0.842 0.163 0.316 0.840 0.168 0.432 2-gram 0.849 0.148 0.293 0.835 0.169 0.331
6.4 Experiment Using 2-gram
Most malware use plural APIs when it executes on a host. In this experiment, we use two consecutive APIs for 2-gram
evaluation. For example, if malware X uses API1, API2
and API3in order, 2-gram evaluation uses (API1, API2) and
(API2, API3). Note that 1-gram evaluation uses API1, API2
and API3separately. This evaluation considers the relation
between two consecutive APIs.
We show the experimental results using 2-gram as one of the improvement approach of accuracy. Table 14 shows the average values of results using 1-gram and 2-gram. Ac-cordingly, the number of feature value increases, i.e., the number of APIs is 4164 and the number of categories is 194. We found that the results of 2-gram was basically superior to 1-gram. Especially, the FNR of category is improved sig-nificantly, i.e., FNR values are improved by 7.0% (API) and 23% (category).
Table 15 Comparison of related works.
Accuracy FPR FNR Target
Our method 89.6% 9.80% 32.0% Estimation of USTM11[18] 66.7% N/A N/A malware functions ZYYT13[21] 61.6% about 25% N/A Classification of TBIV09[17] 21.2% N/A N/A malware family
6.5 Comparison of Related Works
To the best of our knowledge, there was only the one
re-search[3]which appropriately estimates the malware
func-tions. However, it is different from our method which tries
to estimate the functions only in the early stage of dynamic
analysis. Also, [18] has many problems as described in
Sect. 2 although it is the closest to our research.
Table 15 shows the comparison with related works about the accuracy, FPR and FNR. Especially, we compare
the previous researches [17], [18], [21] with our method.
However, in all of three methods, both FPR and FNR are
not listed. Note that in[21]we estimate the approximately
25% FPR in the 61.6% accuracy from the graph since they describe the graph of FPR corresponding to the accuracy.
The accuracy of [17] is the latest experimental results by
[21], i.e., 21.2%. Our method shows the average of the re-sults of Random Forest, i.e., the accuracy is 89.6%, FPR is 9.80% and FNR is 32.0%.
Note. Each previous work in Table 15 uses different dataset. Since the performance of methods depends on the
dataset, we should not compare our method with the previ-ous works by the performance described in the paper. As reference, however, we just list up the performance values described in each paper in Table 15. Also, we do not
com-pare with the previous researches[3],[8],[11]since the
ac-curacy, FPR and FNR are not described in these papers.
7. Conclusion
This paper proposes how to estimate the malware functions by machine learning techniques against activity logs
includ-ing malware APIs/categories for the initial 90/120 seconds
per malware sample. Our method estimates the malware functions based on eight basic malware functions by five classifiers. The results show that our method can achieve an accuracy of 83.4% (API) and 83.6% (category) on average in our experiment. Especially, the accuracy values by Ran-dom Forest are 89.6% (API) and 89.1% (category). From our experimental results, we showed that our method was
effective in the estimation of malware functions.
Acknowledgements
This study is partly supported by the Okawa Foundation for Information and Telecommunications.
References
[1] K. Baumgartner, “Sony/Destover: Mystery North Korean actor’s destructive and past network activity,” https://securelist.com/blog/ research/67985/destover/
[2] D. Canali, A. Lanzi, D. Balzarotti, C. Kruegel, M. Christodorescu, and E. Kirda, “A quantitative study of accuracy in system call-based malware detection,” Proc. 2012 International Symposium on Soft-ware Testing and Analysis, ISSTA 2012, pp.122–1132, 2012. [3] P.M. Comparetti, G. Salvaneschi, E. Kirda, C. Kolbitsch, C. Kruegel,
and S. Zanero, “Identifying dormant functionality in malware pro-grams,” 2010 IEEE Symposium on Security and Privacy, pp.61–76, 2010.
[4] T. Hayashi, Y. Yamaguchi, H. Shimada, and H. Takakura, “Network behavior-based malware classification method based on sequence pattern of traffic flow,” CSS’14, 2014 (in Japanese).
[5] Y. Higashi, Studies on malware classification by the function based on the malware’s code, Master’s Thesis, Nara Institute of Science and Technology, 2011 (in Japanese).
[6] X. Hu and K.G. Shin, “DUET: Integration of dynamic and static analyses for malware clustering with cluster ensembles,” Proc. 29th Annual Computer Security Applications Conference, ACSAC’13, pp.79–88, 2013.
[7] M. Kamizono, M. Akiyama, T. Kasama, J. Murakami, M. Hatada, and M. Terada, “Datasets for anti-malware research∼MWS datasets 2015∼,” IPSJ SIG Technical Report vol.2015-CSEC-70, no.6, 2015 (in Japanese).
[8] Y. Park and D. Reeves, “Deriving common malware behavior through graph clustering,” Proc. 6th ACM Symposium on Infor-mation, Computer and Communications Security, ASIACCS’11, pp.497–502, 2011.
[9] N. Kawaguchi and K. Omote, “Malware function classification us-ing APIs in initial behavior,” 2015 10th Asia Joint Conference on Information Security, pp.138–144, 2015.
[10] C. Kolbitsch, T. Holz, C. Kruegel, and E. Kirda, “Inspector gad-get: Automated extraction of proprietary gadgets from malware bi-naries,” 2010 IEEE Symposium on Security and Privacy, pp.29–44,
2010.
[11] D. Kong and G. Yan, “Discriminant malware distance learning on structural information for automated malware classification,” Proc. 19th ACM SIGKDD International Conference on Knowledge Dis-covery and Data Mining, KDD’13, pp.1357–1365, 2013.
[12] Microsoft Developer Network, http://msdn.microsoft.com/en-us/ library/aa383686
[13] R. Okubo, M. Morii, R. Isawa, D. Inoue, and K. Nakao, “Func-tion estima“Func-tion method for malwares based on part of binary code,” CSS’12, 2012 (in Japanese).
[14] A. Sami, B. Yadegari, N. Peiravian, S. Hashemi, and A. Hamze, “Malware detection based on mining API calls,” Proc. 2010 ACM Symposium on Applied Computing, SAC’10, pp.1020–1025, 2010. [15] scikit-learn, http://scikit-learn.org/stable/index.html
[16] Symantec, http://www.symantec.com/ja/jp/security response/ [17] R. Tian, L. Batten, R. Islam, and S. Versteeg, “An automated
clas-sification system based on the strings of Trojan and virus families,” 2009 4th International Conference on Malicious and Unwanted Soft-ware (MALWARE), pp.23–30, 2009.
[18] T. Usui, K. Shigematsu, K. Takeda, and J. Murai, “Malware classifi-cation based on SVM and labeling by API’s tendency,” MWS 2011, 2011 (in Japanese).
[19] V.P. Nair, H. Jain, Y.K. Golecha, M.S. Gaur, and V. Laxmi, “MEDUSA: MEtamorphic malware dynamic analysis usingsigna-ture from API,” Proc. 3rd International Conference on Security of Information and Networks, SIN’10, pp.263–269, 2010.
[20] H. Xiao and T. Stibor, “A supervised topic transition model for detecting malicious system call sequences,” Proc. 2011 Workshop on Knowledge Discovery, Modeling and Simulation, KDMS’11, pp.23–30, 2011.
[21] Y. Zhong, H. Yamaki, Y. Yamaguchi, and H. Takakura, “ARIGUMA code analyzer: Efficient variant detection by identifying common instruction sequences in malware families,” 2013 IEEE 37th Annual Computer Software and Applications Conference, pp.11–20, 2013. [22] Y. Zhong, H. Yamaki, and H. Takakura, “A malware classification
method based on similarity of function structure,” 2012 IEEE/IPSJ 12th International Symposium on Applications and the Internet, pp.256–261, 2012.
Naoto Kawaguchi received his M.S. degree in information science from Japan Advanced In-stitute of Science and Technology (JAIST) in 2015.
Kazumasa Omote received his Ph.D. de-grees in information science from JAIST in 2002. He worked at Fujitsu Laboratories, LTD in 2002–2008, and was engaged in research and development for network security. He was a research assistant professor at JAIST in 2008– 2011, and was an associate professor at JAIST in 2011–2016. He has been an associate pro-fessor at University of Tsukuba since 2016. His research interests include applied cryptography and network security. He is a member of IEICE and IPSJ.