저작자표시-비영리-변경금지 2.0 대한민국 이용자는 아래의 조건을 따르는 경우에 한하여 자유롭게 l 이 저작물을 복제, 배포, 전송, 전시, 공연 및 방송할 수 있습니다. 다음과 같은 조건을 따라야 합니다: l 귀하는, 이 저작물의 재이용이나 배포의 경우, 이 저작물에 적용된 이용허락조건 을 명확하게 나타내어야 합니다. l 저작권자로부터 별도의 허가를 받으면 이러한 조건들은 적용되지 않습니다. 저작권법에 따른 이용자의 권리는 위의 내용에 의하여 영향을 받지 않습니다. 이것은 이용허락규약(Legal Code)을 이해하기 쉽게 요약한 것입니다. Disclaimer 저작자표시. 귀하는 원저작자를 표시하여야 합니다. 비영리. 귀하는 이 저작물을 영리 목적으로 이용할 수 없습니다. 변경금지. 귀하는 이 저작물을 개작, 변형 또는 가공할 수 없습니다.
Value of Amide Proton Transfer
Imaging in Correlation with
Histopathological Grades of Adult
Diffuse Gliomas : Comparison and
Incremental Value with Dynamic
Susceptibility Contrast-Enhanced MRI
and Diffusion Weighted Imaging
Yoon Seong Choi
Department of Medicine
Value of Amide Proton Transfer
Imaging in Correlation with
Histopathological Grades of Adult
Diffuse Gliomas : Comparison and
Incremental Value with Dynamic
Susceptibility Contrast-Enhanced MRI
and Diffusion Weighted Imaging.
Directed by Professor Seung-Koo Lee
The Doctoral Dissertation
submitted to the Department of Medicine,
the Graduate School of Yonsei University
in partial fulfillment of the requirements for the degree
of Doctor of Philosophy
Yoon Seong Choi
This certifies that the Doctoral
Dissertation of Yoon Seong Choi is
approved.
---Thesis Supervisor : Seung-Koo Lee
---Thesis Committee Member#1 : Se Hoon Kim
---Thesis Committee Member#2 : Hyun Seok Choi
---Thesis Committee Member#3: Seok-Gu Kang
---Thesis Committee Member#4: Jong Hee Chang
The Graduate School
Yonsei University
ACKNOWLEDGEMENTS
Firstly, I would like to acknowledge my deep gratitude to Prof.
Seung-Koo Lee, who has been training me in neuroradiology
division, for the continuous support of my Ph.D. study and
related research.
Besides my advisor, I would like thank the rest of my thesis
committee : Prof. Se Hoon Kim, Prof. Hyun Seok Choi, Prof.
Seok-Gu Kang, and Prof. Jong Hee Chang, for their
insightful comments and encouragement.
Special thanks to Prof. Sung Soo Ahn, who has provided help
for study design and financial support.
<TABLE OF CONTENTS>
ABSTRACT
···1
I. INTRODUCTION
···3
II. MATERIALS AND METHODS
···4
1.
Protocol optimization with phantom experiments ···4
2.
Patients···6
3.
Image acquisition···6
4.
Image postprocessing analysis ···7
5.
Pathologic evaluation ···8
6.
Statistical analysis ···8
III. RESULTS
···10
1.
Protocol optimization with phantom experiments ···10
2.
Patients···14
3.
Difference of APT SI according to glioma grades ···15
4.
Comparison of diagnostic value between APT, ADC and
rCBV for glioma grading···16
5.
Incremental diagnostic value of APT over ADC and rCBV
for glioma grading ···20
6.
Correlation between APT SI and Ki-67 ···21
IV. DISCUSSION
···22
V. CONCLUSION
···26
REFERENCES
···27
LIST OF FIGURES
Figure 1. A phantom with variable BSA concentration and pH
for protocol optimization ··· 5
Figure 2. Result of experiment with phantoms with 0% and 4%
BSA at pH 7.4 and pH 6.5, and varied RF powers (0.5, 1, 2,
and 3µT) and RF durations (35, 70, and 105msec) ··· 10
Figure 3. Result of experiment with 3D GRASE (A-D) and FFE
(E-H) sequences, and a phantom with 2%, 4%, 8%, 16% BSA
at pH 7.4 and pH 6, pH 6.5, pH 7, and pH 7.4 at 16% BSA ··12
Figure 4. Difference of APT signal intensity according to glioma
grades ··· 16
Figure 5. Differences of APT, ADC and rCBV values between
low and high grade gliomas ··· 17
Figure 6. ROC curves of APT, ADC and rCBV for
discriminating high grade from low grade gliomas ··· 18
Figure 7. Images obtained in a 52-year-old male with low grade
glioma ··· 19
Figure 8. Images obtained in a 76-year-old male with high grade
glioma ··· 20
Figure 9. ROC curves of ADC alone and APT + ADC for
discriminating high grade from low grade gliomas ··· 21
Figure 10. Scatterplot of APT SI and Ki-67 labelling index ·· 22
LIST OF TABLES
Table 1. Histologic and molecular characteristics of the study
cohort (n=39)··· 15
Table 2. Differences in APT SI according to WHO grades (n=39)
···15
Table 3. Differences in APT, rCBV and ADC values between
high- and low-grade gliomas (n=34) ··· 17
Table 4. ROC analysis of APT, rCBV and ADC to discriminate
high- and low-grade gliomas (n=34) ··· 18
Table 5. Incremental diagnostic value of APT over ADC and
ABSTRACT
Value of Amide Proton Transfer Imaging in Correlation with
Histopathological Grades of Adult Diffuse Gliomas : Comparison and
Incremental Value with Dynamic Susceptibility Contrast-Enhanced MRI
and Diffusion Weighted Imaging
Yoon Seong Choi
Department of Medicine
The Graduate School, Yonsei University
(Directed by Professor Seung-Koo Lee)
Purpose: Amide proton transfer (APT), a subtype of chemical exchange
saturation transfer, is a novel technique to detect concentration of
endogenous peptide or protein without exogenous contrast agent
administration. We investigated the difference in APT values according
to histopathological grades, and compared the diagnostic value of APT
with relative cerebral blood volume (rCBV) from dynamic susceptibility
contrast-enhanced (DSC) MRI and apparent diffusion coefficient (ADC)
from diffusion weighted imaging (DWI) for histopathological grades in
adult diffuse gliomas. We also investigated the incremental value of APT
over ADC and rCBV for discriminating high grade and low grade
gliomas.
Material and Methods: The study cohort consisted of 39 adult patients
with histopathologically proven diffuse glioma who underwent
preoperative APT imaging, with 34 patients available for preoperative
DSC MRI and DWI. Regions of interest were obtained from circles
manually placed at the area with high signal in APT and rCBV map, and
low signal in ADC map. APT signal was compared according to WHO
grade or low vs high grade of glioma. Diagnostic ability to discriminate
high grade glioma from low grade glioma were compared between APT,
ADC, and rCBV by using Receiver operative characteristic (ROC)
analysis, and incremental diagnostic value of APT over ADC and rCBV
were assessed by using integrated discrimination index. Also, the
correlation between APT values and Ki-67 labeling index (LI) was
assessed by linear regression.
Results: The APT SI values were 0.82 ± 0.36% in grade II gliomas,
1.73 ± 0.86% in grade III, and 2.62 ± 0.78% in grade IV gliomas, which
showed significant difference between grade II and III (p=0.018), III and
IV (p = 0.010), as well as II and IV (p < 0.001). The diagnostic value to
discriminate between high and low grade glioma was not significantly
different between APT, ADC and rCBV, with area under the ROC curve
(AUC) of 0.890, 0.917, and 0.947, respectively. (p > 0.05 for each
comparison) Incremental diagnostic value of APT was significant over
ADC (p = 0.003), and not significant over rCBV (p=0.066). APT signals
were significantly correlated with Ki-67 LI. (p=0.001, R
2= 0.26)
Conclusion: APT imaging can be useful, and have incremental value over
ADC for predicting the histopathological grades of adult diffuse gliomas.
APT SI can be correlated with Ki-67 LI.
---Key words : Glioma, Grade, Magnetic resonance imaging, amide proton
transfer, chemical exchange saturation transfer
Value of Amide Proton Transfer Imaging in Correlation with
Histopathological Grades of Adult Diffuse Gliomas : Comparison and
Incremental Value with Dynamic Susceptibility Contrast-Enhanced MRI
and Diffusion Weighted Imaging
Yoon Seong Choi
Department of Medicine
The Graduate School, Yonsei University
(Directed by Professor Seung-Koo Lee)
I. INTRODUCTIONGlioma is the most common brain tumor and glioblastoma is the most malignant brain tumor in adults. 1,2Discrimination between high and low grade glioma is of clinical relevance, because prognosis and treatment strategies are substantially different according to glioma grades.3 Surgical resection followed by concurrent chemoradiation with temozolomide is standard treatment for high grade glioma,3and undergrading of high grade glioma as low grade glioma can lead to insufficient and less aggressive treatment.
The gold standard for glioma grades and molecular or genetic profiles is surgical sampling which takes invasive procedure and risk of sampling from suboptimal site and undergrading of tumor, considering intratumoral heterogeneity of high grade gliomas. Thus, advanced MR techniques such as dynamic susceptibility contrast-enhanced (DSC) MRI and diffusion weighted imaging (DWI) have been utilized as noninvasive imaging biomarker. Many previous studies investigated the relative cerebral blood volume (rCBV) from DSC MRI and apparent diffusion coefficient (ADC) from DWI in correlation with glioma grade, genetic profile or prognosis, however with some conflicting results.4–11
saturation transfer (CEST) imaging that reflects concentration of endogenous peptides or proteins without contrast agent administration. 12–14In APT imaging, a pulse with radiofrequency of amide (-NH) proton (3.5ppm) in peptides and proteins selectively saturates the signal from amide protons and these saturated amide protons exchange with protons from bulk water, consequently reducing the signal at 3.5ppm from bulk water. Thus, peptides and protein concentration can be indirectly assessed from calculating the asymmetric signal decrease from bulk water at 3.5ppm, although other factors such as pH or temperature can also affect the APT signal intensity (SI). 12–16Several previous studies investigated APT imaging in brain tumor. Previous studies reported that APT SI in brain tumor was mainly attributed to protein concentration, 17and APT SI was higher in brain tumor than normal tissue. 18Togao et al.19 obtained APT images from one dominant section of gliomas and reported that APT imaging can be useful for predicting histopathological grade of glioma. However, protocol of APT imaging needs to be optimized and validated in clinical setting and given that other advanced MR techniques such as DSC MRI or DWI is available in clinical setting, compatibility and incremental value of APT with ADC or rCBV for predicting glioma grades are of clinical importance, which has not been elucidated.
The purpose of this study was to investigate the diagnostic value of APT compared with those of ADC and rCBV, and incremental diagnostic value of APT over ADC and rCBV for predicting histopathological grade in diffuse gliomas in adults, with clinically optimized APT imaging protocols. We also investigated the correlation between APT SI and Ki-67 labeling index (LI).
II. MATERIALS AND METHODS
1. Protocol optimization with phantom experiment
Considering that protein concentration, pH, and radiofrequency (RF) saturation power and duration, RF saturation power was pivotal for APT imaging
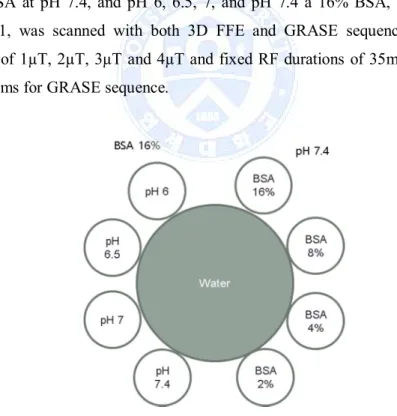
protocol optimization, which was optimized to visualize the signal difference according to various protein concentrations so that the signal differences between brain tumor and normal tissue are well visualized. Phantom experiment for protocol optimization was performed with two sequences : three dimensional fast field echo (3D FFE) and three dimensional gradient and spine echo (3D GRASE) as described elsewhere. 20–23 The first experiment was conducted with 3D FFE and 4 phantoms with 0% and 5% bovine serum albumin (BSA) at pH 6.5 and 7.4, respectively. Each phantom was scanned with varied RF powers of 0.5µT, 1 2µT, and 3µT with RF durations of 35msec, 70msec and 105 msec, thus 4 phantoms x 4 RF powers x 3 RF durations = 48 times of APT imaging were performed. In the second experiment, a phantom with more variable BSA concentration and pH, consisting of 2%, 4%, 8% and 16% BSA at pH 7.4, and pH 6, 6.5, 7, and pH 7.4 a 16% BSA, as shown in Figure 1, was scanned with both 3D FFE and GRASE sequences with RF powers of 1µT, 2µT, 3µT and 4µT and fixed RF durations of 35msec for FFE and 200ms for GRASE sequence.
Fig. 1. A phantom with variable BSA concentrations and pH for protocol optimization
2. Patients
The cohort of this study consisted of thirty-nine consecutive adult patients with histopathologically proven diffuse glioma who underwent preoperative MRI including APT imaging from Nov, 2014 to June, 2015, with thirty-four patients among them available for preoperative DWI and DSC MRI. The mean age of cohort was 47.2 ± 16.8 years old and male to female ratio was 21:18. The interval from APT imaging, DWI and DSC MRI to operation was 1.2 ± 0.4 days. 3. Image acquisition
MRI studies were performed using a 3T system (Achieva, Philips Healthcare, Netherland, Best) and 32 channel receive head coil with transmit body coil. APT-weighted imaging was acquired using three-dimensional (3D) gradient-and spin-echo (GRASE) approach, 23with the following parameters : voxel size, 2.2ⅹ2.2 mm; slice thickness, 4.4 mm; repetition time/echo time, 3000 msec/17 msec; TSE factor, 22; EPI factor, 7; and number of slices, 15 to cover entire tumor volume. By 4 repetitions at ±3.5 ppm with six saturation frequency offsets (±3.0, ±3.5 and ±4.0 ppm), sufficient signal-to-noise ratio(SNR) could be achieved within clinical time frame. APT imaging was conducted with RF saturation amplitude of 2 µT and total duration of 800ms consisting of four block pulsed saturation scheme. Water frequency shift due to field inhomogeneity was measured in a separate scan using the water saturation shift referencing method 24 with 21 offset frequencies ranging from -1.25 ppm to 1.25 ppm at a step of 0.125 ppm (16 Hz) with one reference scan without saturation RF pulse resulting in full Z-spectrum within the offset range. This scan was acquired with repetition time/echo time of 1250 msec/17 msec and RF saturation amplitude of 0.5 µT with total duration of 400 ms consisting two block pulsed saturation scheme and the same imaging parameters as used in APT imaging. Both the APT and water saturation shift referencing scans were performed prior to contrast-enhanced T1-weigthed scan. Total acquisition time
was 7 min 36 sec for both water saturation shift referencing and APT scans. Other conventional MR imaging sequences included T2-weighted turbo spin-echo imaging, FLAIR turbo spin-spin-echo imaging, and contrast-enhanced T1-weighted gradient-echo imaging. Transverse T2-T1-weighted turbo spin-echo images were obtained with the following parameters: repetition time /echo time, 4629 msec/80 msec; number of slices, 90; voxel size, 0.98ⅹ1.02; slice thickness, 2.0 mm; scan time, 4 minutes 19 seconds. Transverse fluid attenuated inversion recovery (FLAIR) turbo spin-echo images were obtained with the following parameters: repetition time /echo time /inversion time, 11000 msec/125 msec/2800 msec; number of slices, 100; voxel size, 0.98 ⅹ1.05; slice thickness, 2.0 mm, scan time, 8 minutes 48 seconds. Transverse gadolinium-enhanced T1-weighted gradient-echo images were acquired with the following parameters: repetition time/echo time, 2000 msec/1000 msec; number of slices, 90; voxel size, 0.98 x 0.79; slice thickness, 2.0 mm; scan time, 13 minutes 12 seconds.
4. Image postprocessing analysis.
After water frequency shift correction, magnetization transfer ratio asymmetry (MTRasym) values at ±3.5ppm with respect to the water frequency, so called APT-weighted SI values were calculated 15,16:
MTR (+3.5ppm) =S (−3.5ppm) − S (+3.5ppm)S0
where S0 and Ssat(∆ω) are MRI signal without and with saturation RF pulse at offset frequency of ∆ω at downfield (+∆ω) and upfield (-∆ω) from water center frequency. All postprocessing of APT images was performed with Matlab (MathWorks, Natick, MA). The full the water saturation shift referencing Z-spectrum was then fitted to a 12th order polynomial at each voxel, and the lowest signal in the fit after interpolation at higher spectral resolution (1Hz) was assumed to be an actual water resonance frequency resulting in a water
center frequency offset at a corresponding voxel. The acquired APT data were organized according to the offsets, and the saturation images with the same offsets were averaged. The data for offsets (+4, +3.5, +3 ppm) and (-3, -3.5, -4 ppm) for each voxel were interpolated to 385 points over a frequency offset range from +5 to+2 ppm and -2 to -5 ppm, respectively, and shifted using the fitted water saturation shift referencing central frequency offset at the same voxel. Based on the shift-corrected data, the parameter map of APT SI was calculated using an MTR asymmetry at ±3.5 ppm.
Single or multiple circular regions of interest (ROIs) were placed manually on the areas with high SI on APT and rCBV maps, and areas with low SI on ADC map, that corresponds to solid enhancing portion on T1-weighted images, in case of presence of enhancement, or non-enhancing solid portion avoiding cystic or necrotic portion on T2-weighted images in case of non-enhancing tumors. The mean values from the ROIs on APT, ADC, and rCBV maps were analyzed in statistical analysis, and rCBV values were normalized to the SI of contralateral normal appearing white matter. The size of an ROI at each lesion ranged from 180.5 mm2to 492.8 mm2.
5. Pathological evaluation
The pathological diagnosis with glioma grade, and Ki-67 labelling index (LI) were determined from specimen of surgical sampling. WHO grades of gliomas were determined histopathologically by an experienced neuropathologist. The Ki-67 LI was determined based on the fields with the highest number of Ki-67-labeled cells through a generalized survey, and the percentage of positive cells was counted among approximately 1000 tumor cells.
6. Statistical analysis
Statistical analyses were performed with using
R for Windows version 3.0.2
(R Foundation for Statistical Computing, Nashville, TN, USA)
. For 39patients from the entire cohort, APT SI was compared according to WHO grade (II, III or IV) by using one-way analysis of variance (ANOVA) and post hoc comparison with Bonferroni correction. For 34 patients who underwent preoperative DWI and DSC MRI, APT SI, ADC and rCBV values were compared between low (WHO grade II) and high grade (WHO grade III or IV) of glioma, using Student t-test according to result of Shapiro-Wilk test for normal distribution. Diagnostic ability of APT, ADC and rCBV values to discriminate high grade glioma from low grade glioma were assessed and compared by using Receiver operative characteristic (ROC) analysis and the method by DeLong. 25 Robustness of ROC analysis was confirmed by bootstrapping with 1000 replication and bias-corrected 95% confidential interval for area under the ROC curve (AUC). Incremental diagnostic value of APT over ADC and rCBV were assessed by calculating integrated discrimination improvement (IDI) index described by Pencina et al. 26 as follows : integrated discrimination improvement = (ISnew– ISold) – (IPnew– IPold), where “new” refers to a model containing a new diagnostic tool of interest as APT in our study, in addition to conventional risk predictors, “old” pertains to the model containing only the conventional predictors as ADC and rCBV in our study, and IS and IP are the integrals of sensitivity and (1 – specificity), respectively. For 39 patients from the entire cohort, the correlation between APT values and Ki-67 LI was assessed using simple linear regression. P value <0.05 was considered statistically significant.
III. RESULTS
1. Protocol optimization with phantom experiments
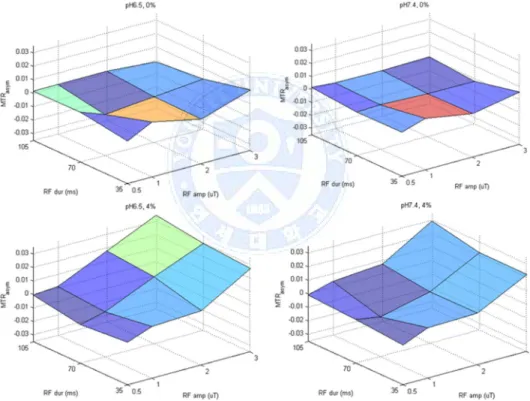
Figure 2 shows result of the first phantom experiment conducted with 4 phantoms each with 0% and 4% BSA at pH 7.4 and pH 6.5. APT SI of 4% BSA phantom increased along with increased RF power and duration, regardless of pH, whereas APT SI of 0% BSA phantom did not change according to RF power, implicating that APT SI is attributed to protein concentration. No significant difference was found in APT SI according to pH change.
Fig. 2.Results of experiments with phantoms with 0% and 4% BSA at pH 7.4 and pH 6.5, and varied RF powers (0.5, 1, 2, and 3µT) and RF durations (35, 70, and 105msec).
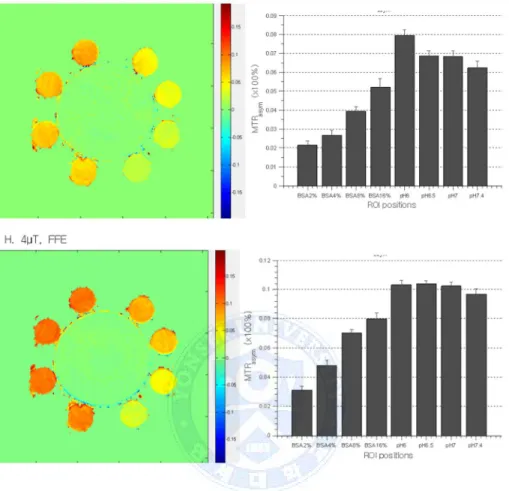
Figure 3 shows the result of the second experiment conducted with 3D FFE and GRASE, and a phantom with 2%, 4%, 8%, 16% BSA at pH 7.4 and pH 6, pH 6.5, pH 7, pH 7.4 at 16% BSA, as shown in Figure 1. In experiment with 3D GRASE sequence, APT SI obtained with 1µT RF power did not show the difference in BSA concentration, whereas APT SI obtained with 2µT, 3µT and 4µT RF power increased along with increased BSA concentration. In experiment with 3D FFE sequence, APT SI obtained with 1µT and 2µT RF power were not correlated with BSA concentration, and APT SI with 1 µT RF power showed unexpected negative values. APT SI obtained with 3µT and 4µT RF power increased along with increased BSA concentration. Considering clinical feasibility and other previous reports, 3D GRASE sequence with RF power of 2µT, the minimum RF power with which APT SI was correlated with BSA concentration, and with RF duration of 200msec was chosen for patient scan in clinical setting.
Fig. 3. Results of experiments with 3D GRASE (A-D) and FFE (E-H) sequences, and a phantom with 2%, 4%, 8%, 16% BSA at pH 7.4 and pH 6, pH 6.5, pH 7, and pH 7.4 at 416% BSA.
2. Patients
Patient histologic and genetic characteristics are summarized in Table 1. The 39 patients consisted of 12 patients with grade II, 9 patients with grade III, and 18 patients with grade IV gliomas. 34 out of 39 patients underwent preoperative DWI and DSC MRI in addition to APT imaging.
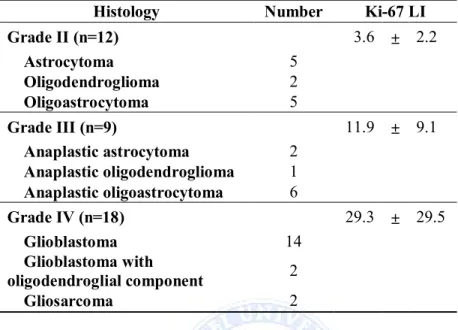
Table 1. Histologic and molecular characteristics of the study cohort (n=39)
Histology Number Ki-67 LI
Grade II (n=12) 3.6 ± 2.2 Astrocytoma 5 Oligodendroglioma 2 Oligoastrocytoma 5 Grade III (n=9) 11.9 ± 9.1 Anaplastic astrocytoma 2 Anaplastic oligodendroglioma 1 Anaplastic oligoastrocytoma 6 Grade IV (n=18) 29.3 ± 29.5 Glioblastoma 14 Glioblastoma with oligodendroglial component 2 Gliosarcoma 2
3. Difference of APT SI according to glioma grades
Difference of APT SI according to glioma grades are summarized in Table 2 and shown in Figure 3 . The APT SI values were higher in higher glioma grade, which were 0.82 ± 0.36 % in grade II gliomas, 1.73 ± 0.86 % in grade III, and 2.62 ± 0.78 % in grade IV gliomas, showing significant difference between grade II and III (p = 0.018), III and IV (p = 0.010), as well as II and IV (p < 0.001).
Table 2. Differences in APT SI according to WHO grades. (n=39).
APT SI P value a II 0.82 ± 0.37 -III 1.73 ± 0.86 -IV 2.63 ± 0.78 -II vs -III - 0.018 II vs IV - <0.001 III vs IV - 0.010
aposthoc pairwise comparision with bonferroni correction after ANOVA
Fig. 4.Difference of APT signal intensity according to glioma grades.
4. Comparison of diagnostic value between APT, ADC and rCBV for glioma grading
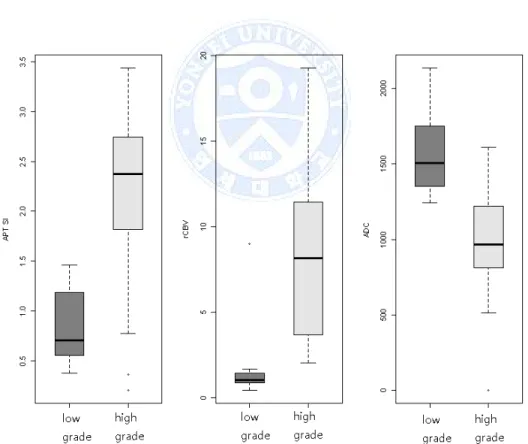
Difference of APT, ADC, and rCBV values between low and high grade gliomas are summarized in Table 3 and depicted in Figure 4. APT and rCBV values were higher and ADC values were lower in high grade glioma than in low grade glioma with staitistical significance. (p < 0.001 for all)
Results from ROC analysis for discriminating high grade from low grade glioma is summarized in Table 4 and depicted in Figure 5. In ROC analysis, APT, ADC and rCBV values showed excellent diagnostic performance with AUC of 0.890, 0.917, and 0.947, respectively. Although AUC of APT was lower than those of ADC and rCBV, no statistical significance was found among the diagnostic value of APT, ADC and rCBV, implicating compatibility of APT as a diagnostic tool for glioma grades. Representative images of APT SI,
ADC, and rCBV parameter maps from low and high grade gliomas are depicted in figure 6 and 7.
Table 3. Differences in APT, rCBV and ADC values between high- and low-grade giomas (n=34)
Low grade glioma High grade glioma P value a
APT (%) 0.82 ± 0.37 2.33 ± 0.90 <0.001
ADC
(10-6mm3/sec) 1580.3 ± 284.5 962.5 ± 353.6 <0.001
rCBV 1.7 ± 2.3 8.6 ± 4.9 <0.001
a calculated from Student t-test
Fig. 5.Differences of APT, ADC and rCBV values between low and high grade gliomas.
Table 4. ROC analysis of APT, rCBV and ADC to discriminate high- and low-grade gliomas. (n=34)
AUC (95% CIa) Cutoff SensitivitySpecificityAccuracy APT 0.890 ( 0.737 ~ 0.989 ) ≥ 1.53 86.4% 75.0% 82.4%
ADC 0.917 ( 0.786 ~ 0.984 ) < 1313.67 86.4% 75.0% 82.4%
rCBV 0.947 ( 0.810 ~ 1.000 ) ≥ 2.01 81.8% 91.7% 85.3% abias-corrected by bootstrapping with 1000 replications
Fig. 6.ROC curves of APT, ADC and rCBV for discriminating high grade from low grade gliomas.
Fig. 7. Images obtained in a 52-year-old male with low grade glioma. (A) Postcontrast T1-weightedi image (B) T2-weighted image (C) ADC map (D) rCBV map (E) APT map
Fig. 8. Images obtained in a 76-year-old male with high grade glioma. (A) Postcontrast T1-weightedi image (B) T2-weighted image (C) ADC map (D) rCBV map (E) APT map
5. Incremental diagnostic value of APT over ADC and rCBV for glioma grading
Incremental diagnostic value of APT over ADC and rCBV for glioma grading assessed by IDI are summarized in Table 5. Combination of APT and ADC values showed better diagnostic performance than ADC alone for glioma grading, with increased AUC from 0.917 to 0.955 and statistical significance. (p = 0.003) (Figure 8) In contrast to combination of APT and ADC, combination of APT and rCBV did not achieve significance improvement in glioma grading (p = 0.066), though accuracy was increased from 85.3% to 91.2%.
Table 5. Incremental diagnostic values of APT SI over ADC and rCBV to discriminate high- and low-grade gliomas. (n=34)
AUC (95%CI) SensitivitySpecificityAccuracy IDI Over ADCADC 0.917 (0.791 -0.977 ) 86.4% 75.0% 82.4% 0.177(P =
0.003)
ADC + APT 0.955 (0.842 -1.000 ) 90.9% 91.7% 91.2%
Over rCBVrCBV 0.947 (0.798 -1.000 ) 81.8% 91.7% 85.3% 0.096(P = 0.066)
rCBV + APT0.947 (0.833 -0.993 ) 90.9% 91.7% 91.2%
Fig. 9. ROC curves of ADC alone and APT + ADC for discriminating high grade from low grade gliomas.
6. Correlation between APT SI and Ki-67 LI
Figure 9 shows correlation between APT SI and Ki-67 LI. High grade gliomas had significantly higher Ki-LI than low grade gliomas (3.6± 2.2 vs 23.5 ± 25.7, p = 0.012) . In linear regression, APT SI showed significant positive correlation with Ki-67 LI. (p=0.001, R2= 0.26)
Fig. 10.Scatterplot of APT SI and Ki-67 LI.
IV. DISCUSSION
We investigated the correlation between APT SI and glioma grades, compared the diagnostic value of APT with ADC and rCBV, and incremental value of APT over ADC and rCBV for discriminating between high and low grade gliomas with optimized APT imaging protocol. APT showed diagnostic value compatible with ADC and rCBV and had incremental value over ADC and rCBV for glioma grading, with higher APT SI in high grade than low grade gliomas. Also, we found positive correlation between APT SI and Ki-67 LI. Advanced MRI techniques such as DWI or DSC MRI have been recently utilized as noninvasive biomarkers that correlated with histopathological grades and molecular or genectic profiles of glioma. 4–7,27APT imaging, a subtype of CEST, can indirectly provide information about peptide or protein concentration within the tissue and has been investigated as an imaging biomarker in previous studies.12–16 Wen et al.18analyzed 12 patients with high grade glioma, found that the average APT SI of the viable tumor cores and cystic cavities were significantly higher than those of peritumoral edema and
normal appearing white matter, and suggested that APT imaging at the protein and peptide level may enhance noninvasive identification of tissue heterogeneity in high grade brain tumors. Zhou et al 15 analyzed 6 rats with glioblastomas and radiation and suggested that viable glioma seen as hyperintense and and radiation necrosiss seen as hypointense to isointense could be clearly differentiated using APT MRI. Sagiyama et al 28 analyzed 9 mice with glioblastomas treated with temozolomide, found that the temozolomide-resistant recurrent tumor showed higher APT SI than temozolomide-sensitive tumor before treatment and suggested the potential of APT imaging as a biomarker for early detection of treatment response in mouse using 7T MRI. Togao et al. 19analyzed 37 human gliomas and found that the APT SI positively correlated with glioma grade, Ki-67 LI, and cell density with statistical significance. However, these previous studies have limited clinical feasibility, since APT imaging protocol was not optimized for clinical use, mouse models instead of human were scanned using experimental MRI with 4.7T or higher magnetic field, and human patients were scanned in only one representative slice of tumor. Herein, we optimized the APT imaging protocol using 3T MRI in clinic and validated APT imaging clinically in glioma patients.
In the phantom experiments for protocol optimization, APT SI values were higher in phantoms with higher BSA concentration and higher RF power and duration, whereas no significant difference was found in APT SI according to pH change. Since various factors including pH and asymmetric magnetization transfer from macromolecules, as well as protein concentration, can affect the APT SI, interpretation of APT SI of tumor is complicated. Lower APT SI values at 3.5ppm are theoretically expected in lower pH as proton exchange rate between amide and bulk water is slowed in lower pH, which is contrary to our results. However, previous studies that investigated the influence of pH on APT SI has found conflicting results. McVicar et al 29reported that APT SI decreased with decreasing pH, whereas Jones et al. 30reported that APT SI obtained from
3.3~3.7ppm showed fluctuated and various value with pH change. Interpretation of results from these previous and our studies needs caution due to heterogeneous sequence and RF power and duration of APT imaging protocol. Although signal from APT-weighted images mainly depended on protein concentration, not on pH, when using 3T MRI in clinic and GRASE sequence with RF frequency of 2 µT or above in our phantom experiments, underlying mechanism and exact contributors to APT SI still remains unclear.
ADC is considered as an index of cellularity and reflects tumor burden. Previous studies investigated the correlation of ADC with grade, molecular or genetic subclassification, or prognosis of glioma, but with conflicting results. 4,8,9,27,31 rCBV reflects perfusion in tumor microenvironment, and high rCBV values have been known to be associated with high grade glioma and prognosis. 5,7While ADC does not require normalization to contralateral normal appearing white matter (NAWM), the voxel values on rCBV map reflects relative but not absolute cerebral blood volume, as implicated its name, so that rCBV requires normalization to contralateral normal appearing white matter in postprocessing. Prah et al 32 found that interobserver reliability of rCBV depends on the normalization or standardization methods, and within-subject coefficient of variation range 24%-67% for rCBV that is normalized to contralateral NAWM as in our study. In this study, rCBV showed the highest performance of glioma grading among APT, ADC and rCBV, and rCBV in combination with APT did not show significant improvement in diagnostic value compared to rCBV alone, in contrast to ADC with which APT imaging has incremental diagnostic value for glioma grading. These results should be interpreted cautiously considering variability of rCBV. It is possible that APT can have significant incremental value over rCBV depending on normalization, considering that reclassification by APT over rCBV was of borderline significance (p=0.066), although only 95% CI but not AUC changed in our results. The opposite is also possible for ADC, considering interobserver variability of ADC that depends on ROI selection.
Although no normalization is required for ADC postprocessing, Ahn et al 33 found that interobserver variability of ADC changed according to ROI selection, and selection of multiple hot spot ROIs as in our study showed higher interoberver variability than selection of entire tumor for ROIs. Thus, further investigations using rCBV standardization and ROI selection with high interoberver reliability are necessary.
There were several limitations in our study, aside from retrospective manner. First, only small number of patients (n=39) were enrolled and 3 among them were unavailable for preoperative DWI and DSC MRI. Second, locus-specific correlations of APT SI to WHO grades and Ki-67 LI were not conducted. Glioma grade and Ki-67 LI may be heterogeneous considering previously reported ntratumoral heterogeneity, especially in high grade glioma, and the ROIs on APT-wegihted images may have different glioma grades and Ki-67 LI from those in the pathological report. Third, hot spot method placing several circular ROIs on the high APT and rCBV, and low ADC values were used instead of segmenting the entire enhancing tumor. Although Ahn et al. 33 suggested that hot spot method has higher interobserver variability than segmenting the entire tumor, Sakata et al.34 reported that no significant difference in glioma grading ability was found among variable ROI selections on APT images, including placing ROIs on a single representative slice and all slices of whole tumor, and with and without normalization to contralateral NAWM. We used several circular ROIs without normalization for APT SI based on the previous study by Sakata et al., and used the same ROI selection for ADC and rCBV to compare the diagnostic value for discriminating high grade from low grade gliomas. In our opinion, although a ROI selection with higher interoberver reliability, such as semiautomatic segmentation of the entire enhancing tumor, have been better for more accurate comparison between APT, ADC, and rCBV, the resolution of APT imaging needs to be improved for fair coresgitration with postcontrast T1-weighted images.
V. CONCLUSION
APT SI showed diagnostic value for glioma grading compatible for those of ADC and rCBV. APT imaging had significant incremental value over ADC, but not over rCBV for discriminating high grade from low grade gliomas. APT SI was positively correlated with Ki-67 index. Also, we experimentally confirmed that APT SI correlated more with protein concentration than pH. Our results suggests the potential of APT imaging as a useful noninvasive imaging biomarker of glioma, including decisions for surgical sampling sites and therapeutic strategy.
REFERENCES
1. Rousseau A, Mokhtari K, Duyckaerts C. The 2007 WHO classification of tumors of the central nervous system - what has changed? Curr Opin Neurol 2008;21:720-7.
2. Louis DN, Ohgaki H, Wiestler OD, Cavenee WK, Burger PC, Jouvet A, et al. The 2007 WHO classification of tumours of the central nervous system. Acta Neuropathol 2007;114:97-109.
3. Clarke J, Butowski N, Chang S. Recent advances in therapy for glioblastoma. Arch Neurol 2010;67:279-83.
4. Bulakbasi N, Guvenc I, Onguru O, Erdogan E, Tayfun C, Ucoz T. The added value of the apparent diffusion coefficient calculation to magnetic resonance imaging in the differentiation and grading of malignant brain tumors. J Comput Assist Tomogr 2004;28:735-46. 5. Sugahara T, Korogi Y, Kochi M, Ikushima I, Hirai T, Okuda T, et al.
Correlation of MR imaging-determined cerebral blood volume maps with histologic and angiographic determination of vascularity of gliomas. AJR Am J Roentgenol 1998;171:1479-86.
6. Shin JH, Lee HK, Kwun BD, Kim JS, Kang W, Choi CG, et al. Using relative cerebral blood flow and volume to evaluate the histopathologic grade of cerebral gliomas: preliminary results. AJR Am J Roentgenol 2002;179:783-9.
7. Aronen HJ, Gazit IE, Louis DN, Buchbinder BR, Pardo FS, Weisskoff RM, et al. Cerebral blood volume maps of gliomas: comparison with tumor grade and histologic findings. Radiology 1994;191:41-51.
8. Ahn SS, Shin NY, Chang JH, Kim SH, Kim EH, Kim DW, et al. Prediction of methylguanine methyltransferase promoter methylation in glioblastoma using dynamic contrast-enhanced magnetic resonance and diffusion tensor imaging. J Neurosurg 2014;121:367-73.
Correlation of apparent diffusion coefficient values measured by diffusion MRI and MGMT promoter methylation semiquantitatively analyzed with MS-MLPA in patients with glioblastoma multiforme. J Magn Reson Imaging 2013;37:351-8.
10. Pope WB, Lai A, Mehta R, Kim HJ, Qiao J, Young JR, et al. Apparent diffusion coefficient histogram analysis stratifies progression-free survival in newly diagnosed bevacizumab-treated glioblastoma. AJNR Am J Neuroradiol 2011;32:882-9.
11. Romano A, Calabria LF, Tavanti F, Minniti G, Rossi-Espagnet MC, Coppola V, et al. Apparent diffusion coefficient obtained by magnetic resonance imaging as a prognostic marker in glioblastomas: correlation with MGMT promoter methylation status. Eur Radiol 2013;23:513-20. 12. van Zijl PC, Yadav NN. Chemical exchange saturation transfer (CEST):
what is in a name and what isn't? Magn Reson Med 2011;65:927-48. 13. Woods M, Woessner DE, Sherry AD. Paramagnetic lanthanide
complexes as PARACEST agents for medical imaging. Chem Soc Rev 2006;35:500-11.
14. Ward KM, Aletras AH, Balaban RS. A new class of contrast agents for MRI based on proton chemical exchange dependent saturation transfer (CEST). Journal of magnetic resonance (San Diego, Calif. : 1997) 2000;143:79-87.
15. Zhou J, Lal B, Wilson DA, Laterra J, van Zijl PC. Amide proton transfer (APT) contrast for imaging of brain tumors. Magn Reson Med 2003;50:1120-6.
16. Zhou J, Payen JF, Wilson DA, Traystman RJ, van Zijl PC. Using the amide proton signals of intracellular proteins and peptides to detect pH effects in MRI. Nat Med 2003;9:1085-90.
17. Zhao X, Wen Z, Huang F, Lu S, Wang X, Hu S, et al. Saturation power dependence of amide proton transfer image contrasts in human brain
tumors and strokes at 3 T. Magn Reson Med 2011;66:1033-41.
18. Wen Z, Hu S, Huang F, Wang X, Guo L, Quan X, et al. MR imaging of high-grade brain tumors using endogenous protein and peptide-based contrast. Neuroimage 2010;51:616-22.
19. Togao O, Yoshiura T, Keupp J, Hiwatashi A, Yamashita K, Kikuchi K, et al. Amide proton transfer imaging of adult diffuse gliomas: correlation with histopathological grades. Neuro Oncol 2014;16:441-8. 20. Scheidegger R, Vinogradov E, Alsop DC. Amide proton transfer
imaging with improved robustness to magnetic field inhomogeneity and magnetization transfer asymmetry using saturation with frequency alternating RF irradiation. Magn Reson Med 2011;66:1275-85.
21. Kogan F, Hariharan H, Reddy R. Chemical Exchange Saturation Transfer (CEST) Imaging: Description of Technique and Potential Clinical Applications. Curr Radiol Rep 2013;1:102-14.
22. Zhou J, Zhu H, Lim M, Blair L, Quinones-Hinojosa A, Messina SA, et al. Three-dimensional amide proton transfer MR imaging of gliomas: Initial experience and comparison with gadolinium enhancement. J Magn Reson Imaging 2013;38:1119-28.
23. Zhu H, Jones CK, van Zijl PC, Barker PB, Zhou J. Fast 3D chemical exchange saturation transfer (CEST) imaging of the human brain. Magn Reson Med 2010;64:638-44.
24. Kim M, Gillen J, Landman BA, Zhou J, van Zijl PC. Water saturation shift referencing (WASSR) for chemical exchange saturation transfer (CEST) experiments. Magn Reson Med 2009;61:1441-50.
25. DeLong ER, DeLong DM, Clarke-Pearson DL. Comparing the areas under two or more correlated receiver operating characteristic curves: a nonparametric approach. Biometrics 1988;44:837-45.
26. Pencina MJ, D'Agostino RB, Sr., D'Agostino RB, Jr., Vasan RS. Evaluating the added predictive ability of a new marker: from area
under the ROC curve to reclassification and beyond. Stat Med 2008;27:157-72; discussion 207-12.
27. Lam WW, Poon WS, Metreweli C. Diffusion MR imaging in glioma: does it have any role in the pre-operation determination of grading of glioma? Clin Radiol 2002;57:219-25.
28. Sagiyama K, Mashimo T, Togao O, Vemireddy V, Hatanpaa KJ, Maher EA, et al. In vivo chemical exchange saturation transfer imaging allows early detection of a therapeutic response in glioblastoma. Proceedings of the National Academy of Sciences of the United States of America 2014;111:4542-7.
29. McVicar N, Li AX, Goncalves DF, Bellyou M, Meakin SO, Prado MA, et al. Quantitative tissue pH measurement during cerebral ischemia using amine and amide concentration-independent detection (AACID) with MRI. J Cereb Blood Flow Metab 2014;34:690-8.
30. Jones CK, Huang A, Xu J, Edden RA, Schar M, Hua J, et al. Nuclear Overhauser enhancement (NOE) imaging in the human brain at 7T. Neuroimage 2013;77:114-24.
31. Sugahara T, Korogi Y, Kochi M, Ikushima I, Shigematu Y, Hirai T, et al. Usefulness of diffusion-weighted MRI with echo-planar technique in the evaluation of cellularity in gliomas. J Magn Reson Imaging 1999;9:53-60.
32. Prah MA, Stufflebeam SM, Paulson ES, Kalpathy-Cramer J, Gerstner ER, Batchelor TT, et al. Repeatability of Standardized and Normalized Relative CBV in Patients with Newly Diagnosed Glioblastoma. AJNR Am J Neuroradiol 2015;36:1654-61.
33. Ahn SJ, Shin HJ, Chang JH, Lee SK. Differentiation between primary cerebral lymphoma and glioblastoma using the apparent diffusion coefficient: comparison of three different ROI methods. PLoS ONE 2014;9:e112948.
34. Sakata A, Okada T, Yamamoto A, Kanagaki M, Fushimi Y, Okada T, et al. Grading glial tumors with amide proton transfer MR imaging: different analytical approaches. J Neurooncol 2015;122:339-48.
ABSTRACT(IN KOREAN)
성인
Diffuse glioma
의 조직병리학적 등급 평가에 대한
Amide
proton transfer imaging
의 가치
: Dynamic susceptibility
contrast-enhanced MRI
및
Diffusion weighted imaging
과의 비교 및 이에
대한 추가적 가치
<
지도교수 이승구
>
연세대학교 대학원 의학과
최윤성
목적 : Amide proton transfer (APT) 은 chemical exchange saturation transfer
의 한 종류로서 조영제 주입 없이 peptide 및 protein 농도를
반영하는 새로운 기법이다. 이 연구에서는 APT value가 성인 diffuse
glioma의 조직병리학적 등급에 따라 어떻게 변하는지 알아보고,
더불어 조직병리학적 등급에 대한 APT value의 진단적 가치를
dynamic susceptibility contrast-enhanced (DSC) MRI의 relative cerebral blood volume (rCBV) 및 diffusion weighted imaging (DWI)의 apparent diffusion coefficient (ADC)의 그것과 비교하고, 더불어 rCBV 혹은 ADC에 더한
APT value의 추가적 진단적 가치를 고찰하였다.
재료 및 방법: 이 연구는 수술 전 APT weighted imaging 을 시행한
39명의 조직병리학적으로 확인된 diffuse glioma 환자를 대상으로
하였으며, 이중 23명은 수술 전 DSC MRI와 DWI를 시행하였다.
Regions of interest 는 APT, rCBV map 에서의 높은 signal 부위, 그리고 ADC map의 낮은 signal 부위에 수동으로 지정하였다. APT signal은 WHO grade 혹은 low vs high grade glioma 에 따라 비교하였다. Receiver
operative characteristic (ROC) analysis를 이용하여, APT value의 Low grade와 high grade를 구분하는 진단적 가치를 ADC 및 rCBV의 그것과
비교하였고, integrated discrimination index를 이용하여 ADC 혹은
rCBV에 더한 APT value의 추가적 진단적 가치를 분석하였다. 또한,
APT value와 Ki-67 labeling index (LI)와의 관계를 linear regression으로
분석하였다.
결과: APT SI는 grade II glioma는 0.82 ± 0.36%, grade III에서는 1.73 ± 0.86%, grade IV 에서는 2.62 ± 0.78% 로 각 grade 별로 유의미한 차이가 있었다. (p < 0.05 for all comparisons) Low grade 와 high grade
glioma를 구분하는 진단적 능력은 APT SI, ADC, rCBV사이에 유의미한
차이가 없었으며, area under ROC curve (AUC)값은 APT 는 0.890,
ADC는 0.917, rCBV는 0.947 이었다. APT 의 추가적 진단적 가치는
ADC에 더하였을 때 유의미하였으며 (p=0.033), rCBV에 대해서는
통계적으로 유의미하지 않았다(p=0.066). APT SI는 Ki-67과 유의미한
상관관계를 보였다 (p=0.001, R2= 0.26).
결론: APT imaging은 성인의 low grade glioma와 high grade glioma의
구분에 있어 유용하며, 기존의 ADC에 대해 추가적 진단적 가치를
가지고, 또한 APT SI는 Ki-67과 유의미한 상관관계를 가지는 것으로
사료된다.
---핵심되는 말 : 뇌교종, 등급, 자기공명영상, amide proton transfer,