LATENT VARIABLE ENRICHED MODE CHOICE MODEL FOR WORK
ACTIVITY IN MULTI MODAL CONDITION PREVALENT IN INDIA
Anu Plavara Alex1, Manju Vasudevan Saraswathy2, Kuncheria Palampoikayil Isaac3
1Assistant Professor, College of Engineering Trivandrum, India 2Associate Professor, College of Engineering Trivandrum, India
3 Vice Chancellor, APJ Abdul Kalam Technological University Kerala, India
Received 18 March 2016; accepted 10 June 2016
Abstract: Transportation network and modal availability play a significant role in trip generation. Mode choice models mainly use modal attributes and socioeconomic characteristics as explanatory variables. The choice of mode of transport also depends on unobservable/ latent variables in addition to the conventional variables. Latent variables are influenced by the attitude and behaviour of the individual. It can be noted from the literature that the latent variables affecting mode choice are location specific and hence they vary from place to place. Studies are not reported in cities where multi modal condition exists. Hence it is essential to study the influence of latent variables in developing countries, especially where a multi modal condition exists. The present study is aimed at incorporating the unobservable factors in activity based mode choice models in multi modal condition in a developing country. Latent variables incorporate the commuters behavioural, attitudinal, mode specific and life style attributes which influence in choosing a mode. The study concentrated on mode of commute before work activity. The modes considered in the study are walk/cycle, car, two wheeler, bus and train. In order to collect the travel behaviour, a self-descriptive questionnaire was prepared which consisted of questions on respondent’s attitude and behaviour and socio – demographic variables. The collected data were analyzed by conducting an Exploratory Factor Analysis (EFA) using principal component method. Confirmatory Factor Analysis (CFA) was carried out to confirm the factor structures identified by EFA. Structural Equation Models (SEM) were developed to correlate latent variables and socio demographic variables. Finally, two mode choice models were developed using Multi Nominal Logit (MNL) models. Case I considered the activity and travel characteristics and socio demographic variables, while case II considered activity and travel characteristics and latent variables. The socio demographic variables which affect the latent variables were replaced with latent variables in case II. It was found that the level of prediction of latent variable enriched mode choice model increased by 7.48% than that without latent variable.
Keywords: mode choice, latent variables, factor analysis, SEM.
1 Corresponding author: [email protected]
1. Introduction
Mode choice analysis is the third step in the conventional four-step transportation forecasting model, following trip generation
and trip distance. Efficient, accessible network along with modal availability and comfort are the prerequisites for better transport services. In order to plan a sustainable efficient transportation system, commuters’ attitude and behavioural trait have to be considered by the transportation planners for understanding their preference of mode. The choice of mode of transport is also dependent on unobservable/ latent variables in addition to the conventional variables. Latent variables are influenced by the attitude and behaviour of the individual. Researchers considered latent variables from different perspectives. Ben Akiva and Boccara (1995) extended discrete choice models by adding probabilistic representation of the various alternatives considered by the individual in a choice situation. The motivation was to incorporate the influence of attitudes and perceptions on the choice set generation process into a single framework modelling. Gopinath (1995) presented latent class model for mode choice behaviour and showed that different segments of population have different decision protocols for the choice process as well as different sensitivities for time and cost. Redmond (2000) identified and analysed travel related attitudinal, personality and lifestyle cluster in San Francisco Bay Area. Ashok et al. (2002) incorporated softer attributes such as attitudes and perceptions in discrete choice models. They presented several full information models that can accommodate latent variables. Morikawa et al. (2002) considered the latent variables of convenience and comfort in a mode choice model. They considered the choices between rail and auto for an intercity trip. The subjective ratings were used as indicators for latent attributes. Two latent variables, ride comfort and convenience, were identified through exploratory factor analysis.
Choo et al. (2004) used attitudes to explain vehicle type choice. They used several latent variables distilled from a number of attitudinal indicator variables as explanatory in a discrete vehicle type choice model. Vehicle types were related to latent factors like attitudes, personality, lifestyle, mobility and demographic variables individually using ANOVA and chi-squared test. Then a multi nominal logit model for vehicle type choice was estimated. Johansson et al. (2006) studied individual attitudes and personality traits about the variation of environmental consideration, safety, comfort, convenience and flexibility. Model of the vehicle was taken as the dependent variable and was classified into nine vehicle type categories: small, compact, mid-sized, large, luxury, sports, minivan/van, pickup, and sport utility vehicle. The explanatory variables used in the vehicle type choice model were travel-related attitudes, personality, lifestyle, mobility, travel liking, and demographic variables. They found that both attitude towards flexibility and comfort, influence the individuals’ choice of mode.
They experimented with discrete choice models and the sixteen personality factor questionnaire (16PF test) for estimating the psychological variables. It was found that anxiety while choosing a mode affects the choice of urban transportation mode. Tangphaisankun et al. (2011) conducted a study which hypothesized that the real travel intention is influenced by travellers’ personality and preference which are free from constraints. Car preference and two personality types- environmental concern and lifestyle, were selected as the important factors inf luencing travel intention of commuters especially in developing countries. Prato et al. (2012) collected attitudinal data by a web-based survey addressed to individuals who habitually drive from home to work. The study proposed a methodology to conduct factor analysis in the route choice context and described the preparation of an appropriate data set through measures of internal consistency and sampling adequacy. Atasoy et al. (2013) studied the attitudes of commuters towards mode choice in Switzerland. Attitudes of the individuals were integrated into a transport mode choice model through latent variable and latent class models. Psychometric indicators were used to measure these attitudes. Michel et al. (2012) presented an integrated choice and latent class model, where they identified two segments of individuals having deferent sensitivities to the attributes of the alternatives, resulting from their individual characteristics. Anwar et al. (2014) developed a Hybrid Random Parameter Logit (HRPL) model to explore the influence of latent variables. The latent variables considered for the study are comfort, convenience, safety, flexibility, reliability and satisfaction. A Traditional
modelling in multi modal condition by conducting exploratory and confirmatory factor analysis. The identified factors were incorporated in mode choice models by developing structural equation models and multi nominal logit models.
2. Methodology and Data Collection
T he a rea selec ted for t he st udy is Thiruvananthapuram City, which is the capital of Kerala State in India. Major means of transport in the city is road. The most common purposes of trips in the study area are work, school, personal business and recreational related. There are variations in travel behaviour and travel pattern among the commuters. In order to study the travel and mode choice behaviour, a self-descriptive questionnaire was prepared which consists of questions related to respondent’s attitude and behaviour, socio – demographic attributes and work activity and travel characteristics. Questions on attitude and behaviour are called as indicator variables which consisted of 33 questions based on eight latent variables viz:
1. Comfort and convenience of the mode, 2. Habit of the commuter,
3. Concern of the commuter about travel cost,
4. Concern about travel time, 5. Safety of the mode, 6. Cleanliness of the mode, 7. Life style of the commuter, 8. Reliability of the mode.
The responses of the indicator variables were evaluated on a five point scale to facilitate more accurate assessment of the commuter’s attitude towards a particular latent variable. The options given for each question varied over ‘strongly disagree’ to ‘strongly agree’
or ‘Not at all important’ to ‘Very important’. The 33 indicator variables were coded from VAR00001 to VAR00033. All the indicator variables and corresponding latent variables along with the codes are shown in Appendix A. S oc io – de mo g r aph ic pa r t of t he questionnaire consisted of questions on: 1. Household size,
2. Person is head of the household, 3. Number of males and females in the
family,
4. Number of children in the family, 5. Age group,
6. Gender, 7. Marital status, 8. Vehicle ownership, 9. Education,
10. Employment.
Activity and travel characteristics part of the questionnaire consisted of questions on: 1. Work duration,
2. Work start time, 3. Travel distance, 4. Travel time.
mode choice models were developed using Multi Nominal Logit (MNL) Models to study the effect of latent variables on mode choice.
3. Exploratory Factor Analysis
Exploratory factor analysis using principal component method was used to reduce a large set of items to a smaller number of dimensions and components. This technique is commonly used to see the relationship between the items in the questionnaire and underlying dimensions. It is also used in general to reduce a larger set of variables to a smaller set of variables that explain the important dimensions of variability. EFA was carried out for the response data of 33 indicator variables included in the questionnaire. The rotated component matrix revealed that there is an existence of five latent variables with
Eigen value greater than 1 (Brown, 2015). It also showed that out of the 33 indicator variables, only 20 variables have been identified. These variables are grouped under five latent variables based on the factor loadings and components. These indicator variables and five latent variables identified from EFA are highlighted in Appendix A with * notation.
Reliability analysis was carried out to check the reliability of the latent variables identified. The reliability of a data is determined by a value called Cronbach’s alpha. Variables with alpha value greater than 0.70 is considered as reliable (Johansson et al., 2006). The output is given in Table 1, which shows that Cronbach’s alpha value is greater than 0.7 for all the variables and hence all the five latent variables are reliable.
Table 1
Results of Reliability Analysis
Latent Variables Cronbach’s Alpha Value
Comfort and convenience of the mode Habit of the commuter
Safety of the mode
0.761 0.742 0.710
Life style of the commuter
Reliability of the mode 0.7510.763
4. Confirmatory Factor Analysis
Confirmatory factor analysis was done to develop a latent variable model. The latent variable model consisted of two parts; namely measurement model and structural equation model. Measurement model was developed in order to correlate indicator variables with latent variables. Structural equation model was developed with socio demographic factors as independent and latent variables as dependent variables. SPSS
AMOS 20 software was used to construct the latent variable model.
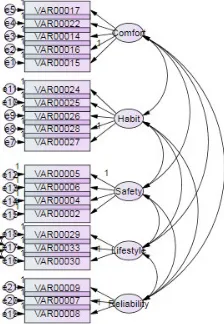
4.1. Measurement Model
five latent variables are connected to the corresponding indicator variables.
4.2. Structural Equation Model (SEM)
Structural equation model was developed between the five latent variables and different socio demographic factors listed in section 2. The path diagram between socio demographic variables, latent variables and indicator variables is shown in Fig 2, in which indicator variables are connected to the corresponding latent variables and
latent variables are connected to the socio demographic factors. Coefficients of the significant variables are shown in Table 2. It is seen that the following variables are found significant:
1. Age group, 2. Gender,
3. Vehicle ownership, 4. Education,
5. Marital status, 6. Employment, 7. Household size.
Fig.1.
Path Diagram of Measurement Model
Fig. 2.
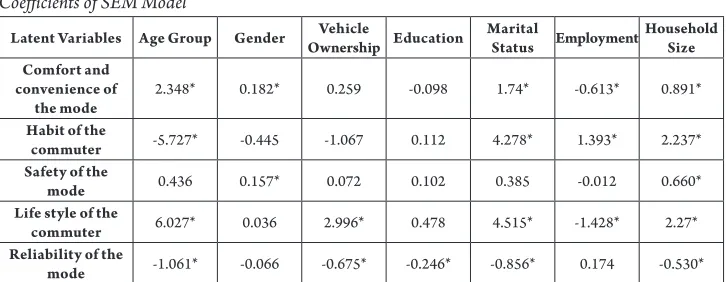
Table 2
Coefficients of SEM Model
Latent Variables Age Group Gender Ownership EducationVehicle Marital Status Employment Household Size Comfort and
convenience of
the mode 2.348* 0.182* 0.259 -0.098 1.74* -0.613* 0.891*
Habit of the
commuter -5.727* -0.445 -1.067 0.112 4.278* 1.393* 2.237*
Safety of the
mode 0.436 0.157* 0.072 0.102 0.385 -0.012 0.660*
Life style of the
commuter 6.027* 0.036 2.996* 0.478 4.515* -1.428* 2.27*
Reliability of the
mode -1.061* -0.066 -0.675* -0.246* -0.856* 0.174 -0.530*
*- Significant at 1% level of significance
Estimates of structural equation model shows that the significant socio demographic variables which affect the attitude of the commuter towards ‘comfort and convenience of the mode’ are age group, gender, marital status, employment and household size. It is observed that higher age group commuters, fema les, unmar r ied commuters and government employees give more importance to comfort and convenience. Significant socio demographic variables which affect the ‘habit of the commuter’ are age group, marital status, employment and household size. It is revealed that at lower age group commuters, self employed and unmarried commuters choose their mode based on their habit. Gender and household size are the significant variables which the affect the attitude of the commuter towards ‘safety of the mode’. It is found that females prefer safer modes.
Age group, vehicle ownership, marital status, employment and household size are the significant variables which affect the ‘lifestyle of the commuter’. It is observed that higher age group people, commuters having both car and TW or more than one car, unmarried people and government employees give more importance to their
lifestyle norms for choosing the mode. All the variables except gender and employment are found to be significant for attitude of the commuter towards ‘reliability of the mode’. Commuters with higher age group, who own vehicle and unmarried people gives less importance to ‘reliability of the mode. It is seen that household size is significant for all the latent variables. As the household size increases, concern about comfort, convenience and safety increases, but that towards reliability decreases.
5. Development of Mode Choice Model
variable ‘person is head of the household’ was considered in case II also, since it does not affect the latent variable. The choice of the four modes, namely two wheeler, car, bus and train were modelled by taking walk/ cycle as the base mode. Widely used N-logit software was used for developing the models.
5.1. Mode Choice Model – Case I
The decision taken by a working class commuter for choosing a particular mode
for commute before work was modelled using MNL by considering the socio demographic variables and activity and travel characteristics. The significant variables were found as vehicle ownership, gender, age group, marital status, employment, whether the person is head of the household, education, work duration and work start time. The estimates and t-statistics of all the significant variables are given in Table 3. -2 Log likelihood value of the model is -2387.094.
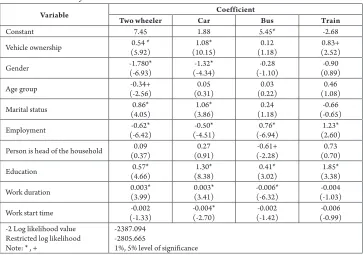
Table 3
Mode Choice Model before Work – Case I
Variable Coefficient
Two wheeler Car Bus Train
Constant 7.45 1.88 5.45* -2.68
Vehicle ownership (5.92)0.54 * (10.15)1.08* (1.18)0.12 (2.52)0.83+
Gender -1.780*(-6.93) (-4.34)-1.32* (-1.10)-0.28 (0.89)-0.90
Age group (-2.56)-0.34+ (0.31)0.05 (0.22)0.03 (1.08)0.46
Marital status (4.05)0.86* (3.86)1.06* (1.18)0.24 (-0.65)-0.66
Employment (-6.42)-0.62* (-4.51)-0.50* (-6.94)0.76* (2.60)1.23*
Person is head of the household (0.37)0.09 (0.91)0.27 (-2.28)-0.61+ (0.70)0.73
Education (4.66)0.57* (8.38)1.30* (3.02)0.41* (3.38)1.85*
Work duration 0.003*(3.99) 0.003*(3.41) -0.006*(-6.32) (-1.03)-0.004
Work start time (-1.33)-0.002 -0.004*(-2.70) (-1.42)-0.002 (-0.99)-0.006 -2 Log likelihood value
Restricted log likelihood Note: * , +
-2387.094 -2805.665
1%, 5% level of significance
This mode choice model shows that as vehicle ownership increases, the probability of using two wheeler and car increases. Males prefer two wheeler and car when compared with females. Younger persons prefer two wheeler and older people prefer car. Married persons prefer car and two wheeler than unmarried.
vehicles by head of the household for work trips. Education has a positive influence on the use of public and private vehicles. Self employed persons prefer bus and train than TW and car. As work duration increases, the use of train and bus decreases. This may be due to the fact that as work duration increases commuters choose their own vehicle and they prefer to stay near the working place.
5.2. Mode Choice Model – Case II
In this case, selection of a mode before work activity is modelled using MNL by considering the latent factors. Here, the socio demographic variables like age, gender, vehicle ownership, employment, education,
marital status and household size which affect latent variables are replaced with the five identified latent variables along with the variable ‘person is head of the household’. Apart from the latent variables, activity and travel characteristics listed in section 2 were also used as independent variables. All the variables except travel distance and travel time were found significant in the model. The estimates of the models are shown in Table 4. The -2 log likelihood value for the model is -2235.843. There is decrease in the -2 log likelihood value of the latent variable enriched mode choice model. The decrease in the -2 log likelihood value indicates the increase in the accuracy of the model with the inclusion of latent variables.
Table 4
Mode Choice Model before Work – Case II
Variable Two wheeler Car Coefficient Bus Train
Constant 6.02 -0.22 5.93* -5.61
Person is head of the household (3.50)0.72* (3.94)0.92* (-3.95)-0.87* (1.45)1.06
Work duration -0.003*(-3.73) -0.003*(-3.54) -0.006*(-6.55) (-1.18)-0.004
Work start time (-1.44)-0.002 -0.004*(-2.87) (-1.63)-0.002 (-1.14)-0.006 Comfort & convenience of the
mode 44.84*(9.56) 37.38*(6.92) 34.47*(6.71) 66.06*(3.20)
Habit of the commuter 22.36*(9.58) 18.59*(6.93) 16.76*(6.57) 32.21*(3.17)
Safety of the mode (0.05)0.01 (3.15)0.87* (-2.43)-0.64+ (-1.11)-0.86
Life Style of the commuter (6.95)1.52* (3.37)0.84* (3.37)0.80* (1.46)1.21
Reliability of the mode (-11.23)12.35* (-9.97)13.16* (-8.29)-9.97* -21.58*(-4.06) -2 Log likelihood value
Restricted log likelihood Note: * , +
-2235.843 -2805.665
1%, 5% level of significance
This model revealed that comfort and convenience of the mode, habit of the commuter, life style of the commuter and reliability of the mode have a positive influence on the choice of two wheeler and
has a positive influence on the choice of two wheeler and car, but negative influence on the choice of bus and train.
6. Validation of the Models
The two mode choice models developed with and without latent variables were applied
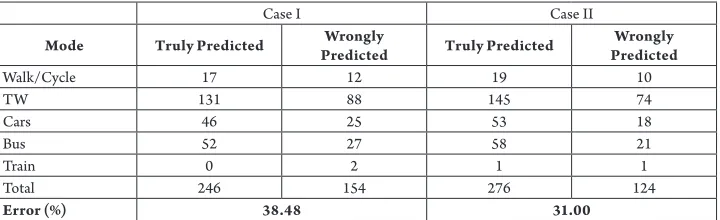
to 20 percent of the collected sample and validated. The results are shown in Table 5. The predicted and observed values are given in the table. The case I model has an average error of 38.48% and the case II model has an error of 31.00%. There is a decrease in error of 7.48% when the socio demographic variables of mode choice are replaced with latent variables.
Table 5
Results of Validation of Mode Choice Models
Case I Case II
Mode Truly Predicted PredictedWrongly Truly Predicted PredictedWrongly
Walk/Cycle 17 12 19 10
TW 131 88 145 74
Cars 46 25 53 18
Bus 52 27 58 21
Train 0 2 1 1
Total 246 154 276 124
Error (%) 38.48 31.00
This shows that the behaviour and attitude of a commuter, which varies with socio demographic factors, affect the mode choice behaviour more than the socio demographic variables.
7. Conclusion
Mode choice models are used to predict the commuters’ decision making process for choosing a particular mode. The choice of mode of transport depends on unobservable/ latent variables in addition to the conventional variables. Latent variables are influenced by the attitude and behaviour of an individual.Latent variables affecting mode choice are location specific and hence they vary from place to place. The present study was aimed to incorporate the unobservable variables called latent variables in mode choice models under
multi modal condition in a developing country. The study incorporated commuters’ behaviour, attitude, mode specific and life style attributes which influence in choosing a mode. The study also aimed to include latent variables in activity based mode choice modelling by considering the mode choice of commuter before work activity. The modes considered in the study were walk/cycle, car, two wheeler, bus and train.
model are age group, gender, vehicle ownership, education, marital status, employment and household size. Having identified these variables, two mode choice models were developed using multi nominal logit models to study the impact of latent variables on mode choice. Case I model was developed with activity and travel characteristics and socio demographic variables. Case II models considered activity and travel characteristics and five identified latent variables. Both models were compared and it was found that the -2 log likelihood value for case I mode choice model was -2387.094 and that for case II model was -2235.843. The decrease in the -2 log likelihood value indicates the increase in the accuracy of the model. Finally, through validating the model, it was found that the level of prediction of mode choice model is increased by 7.48% when latent variables are incorporated instead of socio demographic variables. This study proved that, where multi modal condition exists, latent variables enriched mode choice models are more accurate than models with socio demographic variables in predicting mode choice of a commuter. Behavioural aspect of a commuter in choosing a mode has been taken into account by latent variables in this study and it was proved that behaviour and attitude of a commuter affect more than socio demographic variables while choosing the mode for work commute.
Acknowledgements
The authors are grateful to Kerala State Council for Science, Technology and Environment (KSCSTE) for funding the project.
References
Anwar, A.M.; Tieu, K.; Gibson, P.; Berryman, M.J.; Win, K.T.; McCusker, A.; Perez, P. 2014. Temporal and Parametric Study of Traveller Preference Heterogeneity Using Random Parameter Logit Model, International Journal for Traffic and Transport Engineering, 4(4): 437 - 455.
Ashok, K.; Dillon, W.R.; Yuan, S. 2002. Extending Discrete Choice Models to Incorporate Attitudinal and other Latent Variables, Journal of Marketing Research, 39(1): 31-46.
Atasoy, B.; Glerum, A.; Bierlaire, M. 2013. Attitudes Towards Mode Choice in Switzerland, disP-The Planning Review, 49(2): 101-117.
Ben-Akiva, M.E; Boccara, B. 1995. Discrete Choice Models with Latent Choice Sets, International Journal of Research in Marketing, 12(1): 9–24.
Brown, T.A. 2015. Confirmatory Factor Analysis for Applied Research, The Guilford Press. New York. 461 p.
Choo, S.; Mokhtarian, P.L. 2004. What Type of Vehicle do People Drive? The Role of Attitude and Lifestyle in Influencing Vehicle Type Choice, Transportation Research Part A, 38(3): 201–222.
Gopinath, D. A. 1995. Modeling Heterogeneity in Discrete Choice Processes: Application to Travel Demand. PhD thesis, Massachusetts Institute of Technology, USA. 360 p.
Johansson, M.V; Heldt, T; Johansson, P. 2006. The Effects of Attitude and Personality Traits on Mode Choice, Transportation Research Part A, 40 (6): 507 - 525.
Prato C.G.; Bekhor, S., Pronello, C. 2012. Latent variables and route choice behaviour. Transportation, 39(2): 299-319.
Radam, I. F.; Mulyono, A.T., Setiadji, B.H. 2015. Influence of Service Factors in the Model of Public Transport Mode: A Banjarmasin – Banjarbaru Route Case Study, International Journal for Traffic and Transport Engineering, 5(2): 108 - 119.
Redmond, L. 2000. Identifying and Analyzing Travel-Related Attitudinal, Personality, and Lifestyle Clusters in the San Francisco Bay Area. Master Thesis, University of California, Davis, USA. 169 p.
Tangphaisankun, A; Osada, C; Okamura, T; Nakamura, F.; Wang , R. 2011. Influences of Commuters’ Personality and Preferences on Travel Intention in Developing Countries: A Case of Bangkok, Journal of the Eastern Asia Society for Transportation Studies, 9(2011): 370-381.
Temme, D.; Paulssen, M.; Dannewald, T. 2008. Incorporating Latent Variables into Discrete Choice Models - A Simultaneous Estimation Approach Using SEM Software, BuR - Business Research, 1(2): 220-237.
Appendix A
Indicator Variables and Corresponding Latent Variables
Latent Variables Indicator Variables with Variable Name
Comfort and Convenience of the Mode*
Sightseeing (VAR00017)*
Relaxing & stress relieving (VAR00022)* Calm environment (VAR00014)* Bags & luggage (VAR00016)* Vehicle space (VAR00015)*
Vehicles with Foldable and cushioned seats (VAR000012)
Habit of the commuter*
Listen to music (VAR00024)*
View e-mails and read newspapers (VAR00025) * Do not like to drive during peak hours (VAR00026)* Fear about driving (VAR00028)*
Like driving (VAR00027)* Dislike waiting for bus (VAR000011)
Safety of the mode*
Safer mode (VAR00005) * Seat belt and helmet (VAR00006)* Control on the speed (VAR00004)* Stops at enroute to work (VAR00002)*
Life style of the commuter*
Own vehicle (VAR00029) * Symbol of social status (VAR00033)* Level of status in the society (VAR00030)* Cannot travel in a congested bus (VAR000013)
Reliability of the mode*
Like reliable mode (VAR00009)* Punctual at work place (VAR00007)*
Do not like excessive waiting time (VAR00008)*
Dislike services that cause delay to destination (VAR000018) Concern about travel cost Fuel economy is important (VAR000031)Travel cost is important (VAR000032)
Prefer a mode with less travel cost (VAR00003)
Concern about travel time Travel time is important (VAR000019)Choose the fastest way to get to work (VAR000020) If time is saved, would change the mode (VAR000021)
Do not like to travel in a mode which takes more time (VAR00001) Cleanliness of the mode Public transport untidy (VAR000023)Cleanliness of the mode of transport is important(VAR000010)
Do not like to travel in untidy modes (VAR00001)