4708
A New Approach For Mining Fuzzified Dataset
Using Eclat And Apriori Algorithm
Puneet Matapurkar, Dr. Saurabh Shrivastava
Abstract: Data mining (DM), the technique of the study of vast sets of data, is based on understanding that well -informed decisions are better than uninformed ones. Association rule mining is most widely utilized approaches for Data Mining. The framework principle includes a combination of Éclat algorithms & fuzzification using various types of association rules (AR) and its extensions on big data sets such as weather analysis. This method is used for the evaluation of weather data in order to transform hidden patterns of information into useful information. The proposed methodology gives an exhaustive understanding of how to handle large datasets. Methodology is simple but requires good data mining knowledge. The experiment has done using the python platform. The simulation results show the generated rules with respect to time at various support and confid ence. The comparison illustrated that no. of rules generated through the Éclat algorithm has been increased and the time taken by this is much less.
Index Terms: SpatialDM, ARM, Weather Data, Eclat Algo, Fuzzification.
————————————————————
1
INTRODUCTION
Geospatial data (GD) is information concerning events, objects or phenomena located on the earth's surface. The location may be short-term static (e.g., road location, earthquake events, children who live in poverty) or dynamic (like thespread of mobile or pedestrian diseases). Geospatial data incorporates information on location (generally earth-coordinates), data on attributes (object characteristics events and phenomena) or time data (time or period of the time location, as well as attributes, exist) [1].Geographic or Geospatial Information Systems (GIS) have been the foundation of urban data frameworks. Eighty to 90% of all the urban data gathered and utilized is area related. It is hard to consider urban information the executives’ frameworks that don't utilize geospatial information [2]. For a significant number of users, most geospatial data will be of general interest. Like, roads, localities, water bodies & public services are valuable to no. of purposes as reference information. That is why large volumes of GD are accessible as open data, whether obtained by public or private entities. It can, therefore, is freely accessed by consumers &complete obtainable by open standards.Creation &usage of open standards in theGD has been greatly encouraged by a broad range of applications for geospatial data and due to large no. of agencies involved in collecting such data both globally & locally. Geospatial information has historically been obtained mainly from government departments with a no. of agencies in each jurisdiction. like, the department is liable for land bordercollection (cadastral), road or transport information, environmental data and health data, & so on in connection in its departmental portfolios.
The use of various formats, data models & semantics also made it difficult to incorporate data from different departments. Likewise, road-boundary department may have collected information on land reservations or road maintenance may have collected information on a path: materials, substrate or physical area of the road and data on road-bound wildlife crossings have been acquired by conservation departments. In any event, road means different things (with a few semantics), it should have a multitude of characteristics, data structures,& classification mechanisms. However, this situation was replicated in every jurisdiction and various departments used different formats, structures and somaticizes to preserve the similar type of information like land restrictions) for their own information in various jurisdictions. This caused problems in cases where information should be exchanged among jurisdictions. For instance in Australia, every state & territory utilized their individual system formats & configurations for every of various geospatial datasets and therefore it is most problematic to produce integrated data through national & regional boundaries. Across Europe, language differences have been added to present the same challenges. Like, Data on endangered sites, often need to be boundary as species ecosystems do not end at national boundaries, nonetheless every state retains its own data sets with multiple patterns as well as organizations within geospatial community, and these difficulties in data integration have led to accessible geospatial information being an important objective in recent years. A no. of standards are created by Open Geospatial Consortium (OGC) for open data sharing, including Web Features Service (WFS) requirements, that describe web service requests as well as retort format, allowing data providers to access their data. This standard as well as other OGC specification focus mainly on data format & do not deal with data model or data content semantics. Over current decade, semantic concerns have been seen as significant ineffective distribution of geospatial info through all efforts to incorporate geospatial data as well as provide open access. For that purpose, a no. of ontologies have been created of thematic concepts utilized for geospatial data, which are key areas of open data geospatial reasoning. A 2nd wide area of interest for geospatial thought is qualitative spatial cognitive where approaches are built to understand how geospatial objects are related in space. The meteorologist around the world has
————————————————
• PuneetMatapurkaris currently pursuing his Ph.D. DegreeinDept. of
Mathematical sciences and computer
applicationsfromBundelkhanduniversity, Jhansi (U.P.), India, E-mail: [email protected]
• Dr. SaurabhShrivastavaisworking as Associate professor in Dept. of
Mathematical sciences and computer applications in
Bundelkhanduniversity, Jhansi (U.P.), India, E-mail:
4709 always faced the challenge of the weather being the
unpredictable phenomenon in his forecast. Several methods are available to predict the weather based on collected atmospheric data. Rain prediction is a romanticizing, composite, energetic and snaps task. Researchers rely on the upgrading and integration of data mining techniques to forecast precipitation with the highest precision [3].
2
LITERATURE
SURVEY
For distributing higher orders of Voronoi diagrams we give efficient & effective sequential scan algos. We cover transformation distance algo to cover complicated primitive elements (point, line & area), Minkowski metrics, weights & obstacles to Voronoi diagrams in higher order. The implementation of the algorithm, as well as performance & error, were explained. Eventually, case research focused on commercial area modeling demonstrates the benefits of our proposed algorithms. [4] This paper defines MapX as spatial data infrastructure to encourage sustainable use by enhancing access to the best GD or monitoring technologies available in natural resources & environment. MapX is assisted in online platform offering authority for local national & global spatial data, a data integrity system with a scorecard for authentication & online tools for visualizing, analyzing & accessing geospatial information. MapX was originally developed for stakeholder’scomplex in the extraction sector & lately expanded to another area wherever spatial information could be used to inform dialog between stakeholders, to make investment priorities or track impact such as reduction of risks, chemical management, planning for biodiversity, renewable energy & environmental security [5]. This paper describes the project's contribution to parameterized models & methods for detecting as well as predicting significant meteorological phenomena, in specific fogs as well as low cloud cover, from Data Mining Mateo (DMM) project. Project is designed to cover approaches for incorporating meteorological information that is dispersed and are needed for operation of prediction models, training models & then DM so that even random phenomena can be effectively and quickly predicted We introduce methods as well as technologies used to integrate input data on servers of various vendors. [6] Rebollo&Balakrishnan [7] an original flight delay model was presented. The time, as well as spatial delay, is known as descriptive variables. Their strategy is for anestimated delay between 2 to 24 hours in the future. You usageRandom Forest algo for doing this. Though this model forecasts future flight conditions, the above period is too short as time is required for people to book flights. In this paper, we establish a geospatial DM system known as GDMS for the collection & analysis of geographically distributed textual information. There are 3 elements of system: data analysis, data visualization & data collection. First is the processing of a large volume of geospatial data from our mobile APP, which is utilized by local people. In the form of text descriptions with geographical locations, people may upload an unusual occurrence by means of APP. Storage and storing of all these events in a database[8] In this research, we suggest & establish a DM method that generates optimal routes, based on global space-time pattern knowledge and information on local scenes collected by dash-cameras from big and real-time images. Certain location-based information is generated with recognition. Time-weighted route mining models can be
utilized to generate optimal routes, creating transportation time distribution patterns. Experimental results have demonstrated the possibility to transform image data from positions of different types of road segments to geospatial information that is used to generate Spatio-temporal patterns used to generate spatial patterns[9]. When industrialization and development continue to grow steadily and continuously, agricultural lands are also becoming less every day, leading to an increase in the number of small landowners. In addition, the youth of the villages often migrate for work in large cities because of a continuously decreased production, which means that a decrease in the number of seedlings in the villages. Therefore, it is important to implement cost-effective farm mechanization in order for small farmers with limited agricultural land and less crop production to increase production rates.The entire land of 9 acres is divided into 18 equal parcels in this experimental study. The initial requirements were the combination of the method of preparing seeds and the use of fertilizers. The categories of fertilizers by volume, 50 kg, 35 kg and 65 kg per acre, are discussed earlier[10].
3 RESEARCH
METHODOLOGY
3.1 Problem Statement
ARM is utilized to detect & study the relationship between regimes discovered in time series climatic data from past years. A collection of weather data is used in this analysis. Meteorological DM is a method of DM that seeks to find hidden trends within meteorological data that is largely available to turn information gathered into useful knowledge. We try to extract useful information from collected daily historical data. When, with every record listing various atmosphere measurements, including wind direction, the speed, temperature, relative humidity & precipitation and the average level of the sea in given area, above-mentioned AR is used for studies on meteorological data, association rules can be found as R1: If moisture is normal, there is no rain in the same area. While rule R1 reflects some of weather elements, its role in predicting weather is insufficient, because users are often more concerned over the environment in time such as R2: When east wind is warm and the weather is warm, the next 24 hours will be cold. The foregoing information cannot, sadly, be contained within the context of conventional association rule traditional rules for associations are transactional as they only capture associations between objects in the same transactions, where the notion of a transaction may be purchased by the same user, simultaneous atmospheric events, etc. An inter-transactional relationship law, however, cannot reflect only connections of items in transactions, but the relation of items between various communications over definitesizeslike 6 hours, following day, etc. Following the inter-transactional Association rules proposal, we submitted Éclat algo fuse for the extraction from large data sets of inter-transactional ARs. To overcome these issues we opted forthe following methodology.
3.2 Association Rule Mining
4710 [11]. An additional formal description may be presented in [11]:
suppose I = {i1,i2, …, in} be a items set. Let D be a set of task-related data transactions wherever every transaction T is itemsset which T I. An exclusive TID is associated with every transaction. Let A be an item set. A transaction T is supposed to compriseA if & only if A T. AR is implication of method A B, wherever A I, B I, & A ∩ B = null. [12]. ARM is made to recognize ARs that comply with minimal predefined database support & confidence. The problem of seeking an AR is usually broken down into 2 sub problems [13].
1. Find all Repeated Item sets used Minimum Support. 2. Find A Rsby Repeated Item sets used Minimum
Confidence.
3.3 Fuzziness
In this research work, the dataset is first preprocessed, and for the pre-processing, the dataset is first Fuzzified. For fuzzification of the dataset; the rows with null values are removed and later the remaining values are normalized. For normalizing dataset, you can easily compare data from different locations if you normalize data, eliminate units of information measurement. Some of the most common methods of normalizing data are:
Transforming data using a score or t-score. T-and z-score. The standardization is usually known. In most cases, it may be possible to find data before it is identified as ' normalization, ' because a statistical textbook is speaking about normalizing knowledge.
Rescaling data to have values between 0 & 1. It is generally known as feature scaling. One probable formula to accomplish it is:
𝑥 = ( 𝑥 − 𝑥 𝑥 − 𝑥
) ∗ 100
Standardizing residuals. Regression analyzes can lead to a normal distribution of the residues.
Normalizing Moments. Formula Use μ/σ.
Normalizing vectors (in linear algebra) to norm of one. In this sense, normalization means transforming vector, which has a single length.
Rows with null values are removed in Dataset is first
Normalize the values For normal Find Min-max for every column
(x-min/max-min)*100
Now apply k means clustering by dividing the dataset into 4 equal clusters through this we will get values for cluster center along with measurement time for clustering. Because we have to find 4 fuzzy values for every attribute. Now find out membership value there we will get normalized values or 4 cluster centersor clusterex:cacb cd ce Membership value = right function, left func, triangular or trim function.Here we will get 4 valuesForfuzzyfing the dataset, the location of the attribute whose membership value is maximum among all 4 attributes will be chosen and will be used as an index value.
3.4 Éclat Algorithm
Find elements from bottom like depth-first search (DFS) of
Éclat Algo (EA). EA, which can easily find increasing item sets. This is a vertical-database algorithm. The vertical database cannot be used. If a horizontal database exists, we have to transform it into a vertical database. File does not have to be searched regularly. The server is searched only once by EA. In this algo, support is intended. Confidence in this algo is not determined. Eclat algorithm reduces access time. EAensures the prior principle, which states that: “If an itemset is frequent, then all of its subsets must be frequent.” [14]
This also wants to make2 basic stages that are:
1. Join. Self join bypriorrepeated Lk-1 itemset &produce novel candidate Ck+1 itemset.
2. Prune. filter bypresent candidate itemset whose subset is not repeated in the priorstage.
Working of Éclat Algorithm
1. When organized horizontally to vertical format, the server is scanned.
2. Obtain the TID list of each object, itemset support count is the length of the itemset TID.
3. For candidates (k+1)-itemsets, regular k-itemsets may be used.
4. This procedure repeats, every time by k, up to no common items or candidate items can be generated.
3.5 Proposed Methodology
The implementation methodology of the suggested scheme is split into four phases. In the first phase,theplan has done about the overall structure. Firstly, requirement specification will be prepared i.e. the representation of the appropriate weather data will be prepared in a specific domain.The next phase explore is used to preprocess the collected data and analyze it. Also, the data is stored in the required format. The third phase is the development phase. During this phase, fuzzified the analyzed data and comprises of selecting features based on spatial parameters and implementing fuzzy theory on spatial parameters by examining the classification of spatial datasets. These divide the fuzzified data into four equal parts on the basis of selected features.After that applying the generalization of association rules to spatial co-location patterns and focusing on outlier detection. To find strong association rules the whole procedure could be structured like determine and extract the repeated itemsets that are the largest part normally proficient by modifications/ variation of the apriori and other algorithms and the assessment of the rules with interestingness measures. Association rule mining is done using the Eclat algorithm. The final phase is the analyzing results. Result analysis from support and confidence. Support and confidence will be computed. It may lead to the generation of new expressions for support & confidence and search neighboring spatial objects to produce multi-Dimensional spatial association rule. Convert into outcome figure.
3.6 Proposed Algorithm
Step 1. Load Beach Weather Dataset.
Step 2. Preprocess the dataset
4711 Step 3. Apply the Apriory Algorithm
1. Generation of Frequent Itemset. Generate those all itemsets whose support value is equal or greater than to minsupp value.
2. Generation of Rule. Generates rules from each frequent itemset whose have high confidence value, where every rule is a binary partitioning of numerous itemset
Whereas,
Support= 0.1, 0.2, 0.3….. Confidence = 0.9
Step 4. Apply Eclat Algorithm 1. Count 2-itemsets
2. Partition L2 using 1-item prefixes. 3. Transform database to vertical layout 4. For each eЄ E2 in local L2
5. Compute_Frequent (E2) Step 5. Number of rules generated. Step 6. Comparison of the result.
4 RESULT
AND
DISCUSSIONS
The simulation platform is Python 3.6. In this research work, the previous algorithm used was Association rule mining using the Eclatalgorithm. The data set used previously was in the numerical form which is later converted into fuzzified. Fuzzification is to divide the continuous quantity in the fuzzy domain into several levels, according to the requirement; each level can be regarded as a fuzzy variable and corresponds to a fuzzy subset or a membership function.
4.1 Dataset
If sensors on beaches next to Michigan Lake, Chicago Park District conserves. Such sensors usually capture measurements listed hourly when sensors work in the summer. Data from sensors cannot be accessed through additional seasons and at certain additional times. For the same statistics on lake-water, please see https://data.cityofchicago.org/d/g3ip-u8rb.Sensorlocations are registeredat https://data.cityofchicago.org/d/g3ip-u8rb.
4.2 Results Visualization
1. Support - 0.1 Confidence – 0.9 2.
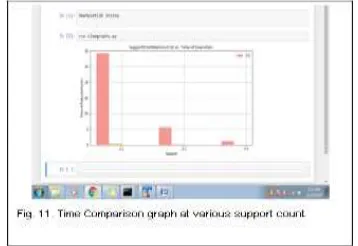
4712 Figure 11 shows the comparison graph of varying support and constant confidence value.
5 CONCLUSION
An increased availability of climate data in the last decades (observes, satellite & radar map, proxy data, etc.) makes it even more important that resources be developed to analyze & draw out hidden knowledge of these huge data in an efficient or accurate manner. Meteorological DM is a method of DM to locate hidden trends within generally available weather information so collected information can be translated into useful information. Useful knowledge may play a major role in understanding climate variability as well as climate prediction.
The proposed framework was designed to better understand how ARM may be used to find relevant trends in climate data and to create rules for creating a predictive model. The framework is being developed. The comparison showed that with the time span of EA, no. of rules produced has been increased.
6
REFERENCES
[1] Kristin Stock, Hans Guesgen” Geospatial Reasoning With Open Data” School of Engineering and Advanced Technology, Massey University, New Zealand (Albany, Auckland campus).
[2] T. Swarnalatha, T. Anuja, B. V. Ramana Reddy, Ch. Rami Reddy, “Spatial Data Warehousing for Integrated Urban Data Management”, International Journal of Recent Technology and Engineering (IJRTE) ISSN: 2277-3878, Volume-8 Issue-2, July 2019, pp. 5088-5093.
[3] Yogesh Kumar Jakhar, Nidhi Mishra, Rakesh Poonia, “Performance Analysis of Data Mining Algorithms in the Prediction of Rain Fall”, International Journal of Recent Technology and Engineering (IJRTE) ISSN: 2277-3878, Volume-8 Issue-2, July 2019, pp. 558-563.
[4] Lee, I., Torpelund-Bruin, C., & Lee, K. (2012). Map segmentation for geospatial data mining through generalized higher-order Voronoi diagrams with sequential scan algorithms. Expert Systems with Applications, 39(12), 11135–11138.
[5] Lacroix, P., Moser, F., Benvenuti, A., Piller, T., Jensen, D., Petersen, I., Ray, N. (2019). MapX: An open geospatial platform to manage, analyze and visualize data on natural resources and the environment. Softwares, 9, 77– 84. DOI:10.1016/j.softx.2019.01.002.
4713 46. DOI:10.1016/j.procs.2010.04.006.
[7] Rebollo JJ, Balakrishnan H. Characterization and prediction of air traffic delays. Transp Res, Part C, Emerg Technol 2014;44:231–41.
[8] Wang, M., Qiu, L., & Wang, X. (2019). GDMS: A Geospatial Data Mining System for Abnormal Event Detection and Visualization. 2019 20th IEEE International Conference on Mobile Data Management (MDM). DOI:10.1109/mdm.2019.00-34 “
[9] Wen, R., & Yan, W. (2018). Spatio-temporal Mining with Scene Data Integration for Urban Transportation Navigation. 2018 IEEE International Conference on Big Data (Big Data). DOI:10.1109/bigdata.2018.8622244 [10]Ankush D. Bhishnurkar and Ashok G. Matani, “Optimizing
Rotavator Design Towards Enhancing Agricultural Crop Productivity”, International Journal of Recent Technology and Engineering (IJRTE) ISSN: 2277-3878, Volume-8 Issue-2, July 2019.
[11]T. Karthikeyan and N. Ravikumar, “A Survey on Association Rule Mining”, International Journal of Advanced Research in Computer and Communication Engineering Vol. 3, Issue 1, January 2014, pp. 5223-5227. [12]Ila Chandrakar and A. Mari Kirthima, “A Survey On Association Rule Mining Algorithms”, In International Journal Of Mathematics and Computer Research, ISSN: 2320-7167, Vol 1, Issue 10, Page No. 270-272, November 2013.