Single-cell RNA expression profiling shows that ACE2, the
putative receptor of Wuhan 2019-nCoV, has significant
expression in the nasal, mouth, lung and colon tissues, and tends
to be co-expressed with HLA-DRB1 in the four tissues
Chao Wu* and Min Zheng*
State Key Laboratory for Diagnosis and Treatment of Infectious Diseases, National Clinical
Research Center for Infectious Diseases, Collaborative Innovation Center for Diagnosis and
Treatment of Infectious Diseases, The First Affiliated Hospital, College of Medicine, Zhejiang
University. Hangzhou, China.
*Correspondence to: [email protected] (Min Zheng) or [email protected] (Chao
Wu)
Abstract
A novel coronavirus (2019-nCoV) was first identified in Wuhan, Hubei Province, and then spreads to the other Provinces of China. 2019-nCoV was reported to share the same receptor, Angiotensin-converting enzyme 2 (ACE2), with SARS-CoV. Previous studies have found ACE2 is abundantly present in humans in the epithelia of the lung and small intestines, and they found ACE2 expression in the basal layer of the non-keratinizing squamous epithelium in nasal and oral mucosa and the nasopharynx. Here based on the public single-cell RNA-Seq datasets, we analyzed the ACE2 expression in the nasal, mouth, lung, and colon tissues. We find that the number of ACE2-expressing cells in the nasal tissue and mouth is comparable to the number of ACE2-expressing cells in the lung tissue and colon. We also find that ACE2 tends to be co-expressed with HLA-DRB1, which plays a central role in the immune system by presenting peptides derived from extracellular proteins, in the nasal, mouth, lung, and colon tissues at single-cell resolution. We hope this provides valuable information for virus-prevention strategy and therapeutic strategy development.
Introduction
Severe infection by 2019-nCoV could result in acute respiratory distress syndrome (ARDS) and sepsis, causing death in approximately 2% of infected individuals1
. Once contacted with the human airway, the spike proteins of 2019-nCoV can bind the surface receptors of
sensitive cells, and mediate the virus to enter into target cells. Recently, Xu et al. modeled the spike protein and indicated that Angiotensin-converting enzyme 2 (ACE2) could be the receptor for the 2019-nCoV2
. Zhou et al. showed that ACE2 is essential for 2019-nCoV to enter HeLa cells3
. These results indicated that ACE2 is likely to be the receptor for 2019-nCoV. Once the putative receptor of 2019-nCoV is identified, an urging work is to identify the potential host cells of 2019-nCoV in the human body comprehensively.
Previous studies have investigated the RNA expression of ACE2 in 72 human tissues4
. They found ACE2 is abundantly present in humans in the epithelia of the lung and small intestines. They also found ACE2 expression in the basal layer of the non-keratinizing squamous epithelium in nasal and oral mucosa and the nasopharynx. However, the experiment is conducted at the bulk level. The number of cells expressing ACE2 in each tissue could not be estimated. Yu Zhao et al. analyzed the single-cell RNA-Seq data of the lung tissues from eight donors and found that ACE2 is mainly expressed in the type II alveolar cells (AT2)5
. They also found that the number of ACE2-expressing AT2 in an Asian donor is much higher than the other seven non-Asian donors, which suggest the lung of the Asian could be a niche for 2019-nCoV replication.
HLA-DRB1 belongs to the HLA class II beta chain paralogs. It plays a central role in the immune system by presenting peptides derived from extracellular proteins. HLA-DRB1 is widely expressed in antigen-presenting cells (APC: B lymphocytes, dendritic cells, macrophages) and other cells. Within the DR molecule of HLA-DRB1, the beta chain contains all the polymorphisms specifying the peptide binding specificities. People have made intensive studies to explore the association between the polymorphisms of HLA-DRB1 and human diseases such as asthma, multiple sclerosis, and rheumatoid arthritis6
. People also found that the polymorphisms of HLA-DRB1 are associated with our susceptibility to Human Immunodeficiency Virus (HIV)7
, herpes simplex virus(HSV)8
, BK virus9
, Hepatitis C Virus(HCV)10
, hepatitis B virus (HBV)11
, Epstein-Barr virus (EBV)12
, and Influenza13
. The relationship between the polymorphisms of HLA-DRB1 and the susceptibility to Severe acute respiratory syndrome coronavirus (SARS-CoV) was also investigated, but no consistent conclusions were made14,15.
In current work, we analyzed ACE2 single-cell expression profiles in the non-immune cells of the nasal, mouth, lung, and colon tissues. We find that 2.5% non-immune nasal tissue cells, 2% non-immune mouth tissue cells, 5.6% non-immune lung tissue cells, and 2.8% epithelial cells of the colon have ACE2 expression. For the non-immune tissue cells, the percent of ACE2-expressing cells in the nasal tissue and mouth is comparable to the percent of ACE2-expressing cells in the lung tissue and colon epithelial tissue. We also find that ACE2 tends to be co-expressed with HLA-DRB1 in the non-immune cells of the four tissues at single-cell resolution. We hope our work provides valuable information for virus-prevention strategy and therapeutic strategy development.
Result
non-immune lung tissue cells, and 2.8% non-immune colon tissue cells express ACE2
Sandra Ruiz García et al. profiled single-cell gene expression of airway epithelium from nasal brushing of one donor, bronchial biopsy of a donor, and turbinate of a donor16
. Reyfman, P. et al. sequenced the single-cell gene expression of the lung (bronchioli terminales) from eight donors17. The gene expression of bronchial epithelium from 12 donors was profiled by Duclos GE et al. at single-cell resolution18
. Puram SV et al. sequenced squamous cell carcinoma tissue of mouth from 18 patients at single-cell resolution19
. Smillie CS et al. profiled single-cell gene expression of colon epithelial cells from 12 healthy individuals20
. Using Seurat, we performed unsupervised graph-based clustering on these single-cell RNA-Seq datasets. Then, We ran the Uniform Manifold Approximation and Projection (UMAP) dimensional reduction technique to visualize the data. Next, we used the violin plot to find the clusters with significant PTPRC (CD45) expression in the datasets and filtered out the clusters. Thus, we got non-immune cells in the datasets. At last, we used the violin plot to visualize ACE2-expressing cells in each cluster in each dataset.
At first, we find that ACE2 is not abundantly expressed in any cluster in the datasets (Figure 1). It suggests that 2019-nCoV may not infect a significant number of cells of a cell-type. The damage of 2019-nCoV to a non-immune cell-type maybe limit. Then we calculated the percent of ACE2-expressing cells in each dataset (Table 1). We find that, in nasal tissue, 2.5% non-immune cells from nasal brushing and 1.7% non-immune cells from turbinate have ACE2 expression. 2% non-immune malignant and normal cells from mouth show ACE2 transcription. In lung tissue, 0.2% non-immune cells from the bronchial biopsy, 5.6% non-immune cells from bronchial brushings, and 1.1% non-immune cells from bronchioli terminales have ACE2 transcription. 2.8% non-immune cells from colon epithelial cells express ACE2. For the mouth, bronchial brushing, lung (bronchioli terminals), and colon tissues, multiple donors/patients were sequenced. We calculated the percent of ACE2-expressing cells in non-immune cells per donor/patient (Table 1). We find that the percent of ACE2-expressing cells in non-immune cells calculated by the collected samples is rather reliable and not dominated by an outlier donor/patient with a very high percent of ACE2-expressing cells in non-immune cells.
ACE2 tends to be co-expressed with HLA-DRB1 in the nasal, mouth, lung, and colon tissues at single-cell resolution
The violin plots of the distribution of ACE2 and HLA-DRB1 in the clusters of the non-immune cells of the mouth, turbinate, nasal brushing, bronchial biopsy, bronchial brushing, lung, and colon tissues suggest that the two genes appear to be co-expressed (Figure 1). We employed the hypergeometric test to test the co-appearance of ACE2 expression and HLA-DRB1 transcription in the non-immune cells. We find that ACE2 is co-expressed with HLA-DRB1 in all the datasets, excluding the dataset of bronchial biopsy, at single-cell resolution (Table 1; P-value <0.05).
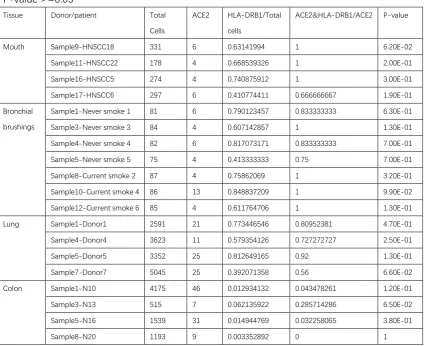
HLA-DRB1 (Table 1; P-value <0.05). We noticed that in the four patients in whom ACE2 failed to be significantly co-expressed with HLA-DRB1, the number of total sequenced cells and ACE2-expressing cells is limit (Table 2). In contrast, the percents of ACE2-expressing cells in the HLA-DRB1-expressing cells are higher than the percent of HLA-DRB1-expressing cells in total cells, which suggests the enrichment of ACE2-expressing cells in the HLA-DRB1-expressing cells (Table 2). In the four patients, we believe that ACE2 will be significantly co-expressed with HLA-DRB1 if more cells are sequenced.
In only one of the eight donors of bronchial brushing tissues, ACE2 is co-expressed with HLA-DRB1 (Table 1; P-value <0.05). However, the number of total sequenced cells and ACE2-expressing cells is limit in the other donors who have in-significant P-value. The percents of ACE2-expressing cells in the HLA-DRB1-expressing cells are higher than the percent of HLA-DRB1-expressing cells in total cells (Table 2). We infer that ACE2 should be significantly co-expressed with HLA-DRB1 if more cells are sequenced.
In four of the eight donors of lung tissues, ACE2 is co-expressed with HLA-DRB1 (Table 1; P-value <0.05). We find that, in the four patients in whom ACE2 failed to be significantly co-expressed with HLA-DRB1, the percents of ACE2-expressing cells in the HLA-DRB1-expressing cells are higher than the percent of HLA-DRB1-expressing cells in total cells (Table 2).
In eight of the twelve donors of colon epithelial tissue, ACE2 is co-expressed with HLA-DRB1 (Table 1; P-value <0.05). We find that, in three of the four patients in whom ACE2 failed to be significantly co-expressed with HLA-DRB1, the percents of ACE2-expressing cells in the HLA-DRB1-expressing cells are higher than the percent of HLA-DRB1-expressing cells in total cells (Table 2).
Given the above, we conclude that ACE2 tends to be co-expressed with HLA-DRB1 in the nasal, mouth, lung, and colon tissues
Discussion
Previous studies have found ACE2 is abundantly present in humans in the epithelia of the lung and small intestines and also expressed in nasal and oral mucosa and the nasopharynx4
. With single-cell RNA-Seq technology, we precisely calculated the number of ACE2-expressing cells in nasal, mouth, lung, and colon tissues and find the number of ACE2-expressing cells in nasal and mouth tissues is comparable to the number of ACE2-expressing cells in the lung and intestine tissues. We think we should make more effort to figure out whether the nasal and mouth epithelial cells are the first major host cells of 2019-nCoV-infection, which may help us understand why so many people are infected with 2019-nCoV but have few or no clinical symptoms.
HLA-DRB1 plays a central role in the immune system by presenting peptides derived from extracellular proteins. The polymorphisms of HLA-DRB1 have been demonstrated to be associated with our susceptibility to diseases and viruses-infection. We have found that ACE2 is co-expressed with HLA-DRB1 in the tissues with abundant 2019-nCoV host cells. Thus, one urging work is to investigate whether 2019-nCoV-infection would significantly elevate HLA-DRB1 expression in the lung.
RNA-Seq data that we can find having profiled mouth tissue at single-cell resolution. The malignant cells are derived from normal epithelial cells of the mouth; we believe most of the malignant cells should still maintain their tissue specificity.
Method
The single-cell RNA-Seq datasets of mouth, bronchial brushing, lung (bronchioli terminales), and colon epithelial tissues were downloaded from GSE103322, GSE131391, GSE122960, and SCP259 (Single Cell Portal). The single-cell RNA-Seq datasets of turbinate, nasal brushing and bronchial biopsy were downloaded from GSE121600.
Single-cell RNA-Seq dataset pre-processing
We employed Seurat (3.1.4) to process the single-cell RNA-Seq datasets. At first, we filtered out the cells 1-expressing less than 200 genes; or 2-highly expressing mitochondrial genes, in which mitochondrial genes’ reads account for more than 25% of the total reads. We filtered out the genes expressing in less than 3 samples. Then, we got the processed single-cell RNA-Seq datasets.
Single-cell RNA-Seq dataset clustering and visualization
We employed Seurat in default mode to cluster and visualize cell-clusters (See supplemental file S1.txt for the R code).
Identification of the non-immune cells
We used the violin plot to check the PTPRC expression in each cluster in each single-cell RNA-Seq dataset. The cluster whose PTPRC expression having a spindle body in the violin plot was filtered. Thus, we got the non-immune cells of each single-cell RNA-Seq dataset.
Test the significance of enrichment of ACE2-expressing cells in HLA-DRB1-expressing cells We employed the hypergeometric test to test the significance of enrichment of ACE2-expressing cells in HLA-DRB1-expressing cells. Supposed 𝑁 is the number of total sequenced cells, M is the number of HLA-DRB1-expressing cells, K is the number of ACE2-expressing cells, we calculated the possibility (p) of finding x or more than x cells of ACE2 expression and HLA-DRB1 expression when we randomly picked K cells from total sequenced cells (𝑁). We used R function phyper to calculate p as follow,
p = 1 − phyper((x − 1), M, (N − M), K); where K > 3, we do not calculate p for the data whose K ≤ 3.
Acknowledgments
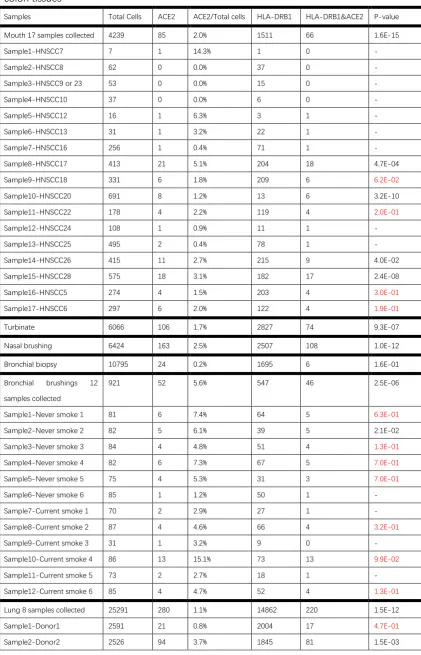
Table 1: Number of total sequenced cells, ACE2-expressing cells, HLA-DRB1-expressing cells and cells with both HLA-DRB1 expression and ACE2 expression in the nasal, mouth, lung and colon tissues
Samples Total Cells ACE2 ACE2/Total cells HLA-DRB1 HLA-DRB1&ACE2 P-value
Mouth 17 samples collected 4239 85 2.0% 1511 66 1.6E-15
Sample1-HNSCC7 7 1 14.3% 1 0 -
Sample2-HNSCC8 62 0 0.0% 37 0 -
Sample3-HNSCC9 or 23 53 0 0.0% 15 0 -
Sample4-HNSCC10 37 0 0.0% 6 0 -
Sample5-HNSCC12 16 1 6.3% 3 1 -
Sample6-HNSCC13 31 1 3.2% 22 1 -
Sample7-HNSCC16 256 1 0.4% 71 1 -
Sample8-HNSCC17 413 21 5.1% 204 18 4.7E-04
Sample9-HNSCC18 331 6 1.8% 209 6 6.2E-02
Sample10-HNSCC20 691 8 1.2% 13 6 3.2E-10
Sample11-HNSCC22 178 4 2.2% 119 4 2.0E-01
Sample12-HNSCC24 108 1 0.9% 11 1 -
Sample13-HNSCC25 495 2 0.4% 78 1 -
Sample14-HNSCC26 415 11 2.7% 215 9 4.0E-02
Sample15-HNSCC28 575 18 3.1% 182 17 2.4E-08
Sample16-HNSCC5 274 4 1.5% 203 4 3.0E-01
Sample17-HNSCC6 297 6 2.0% 122 4 1.9E-01
Turbinate 6066 106 1.7% 2827 74 9.3E-07
Nasal brushing 6424 163 2.5% 2507 108 1.0E-12
Bronchial biopsy 10795 24 0.2% 1695 6 1.6E-01
Bronchial brushings 12
samples collected
921 52 5.6% 547 46 2.5E-06
Sample1-Never smoke 1 81 6 7.4% 64 5 6.3E-01
Sample2-Never smoke 2 82 5 6.1% 39 5 2.1E-02
Sample3-Never smoke 3 84 4 4.8% 51 4 1.3E-01
Sample4-Never smoke 4 82 6 7.3% 67 5 7.0E-01
Sample5-Never smoke 5 75 4 5.3% 31 3 7.0E-01
Sample6-Never smoke 6 85 1 1.2% 50 1 -
Sample7-Current smoke 1 70 2 2.9% 27 1 -
Sample8-Current smoke 2 87 4 4.6% 66 4 3.2E-01
Sample9-Current smoke 3 31 1 3.2% 9 0 -
Sample10-Current smoke 4 86 13 15.1% 73 13 9.9E-02
Sample11-Current smoke 5 73 2 2.7% 18 1 -
Sample12-Current smoke 6 85 4 4.7% 52 4 1.3E-01
Lung 8 samples collected 25291 280 1.1% 14862 220 1.5E-12
Sample1-Donor1 2591 21 0.8% 2004 17 4.7E-01
Sample3-Donor3 2381 14 0.6% 1356 13 4.3E-03
Sample4-Donor4 3623 11 0.3% 2099 8 2.5E-01
Sample5-Donor5 3352 25 0.7% 2724 23 1.3E-01
Sample6-Donor6 2175 36 1.7% 1342 29 1.2E-02
Sample7-Donor7 5045 25 0.5% 1978 14 6.6E-02
Sample8-Donor8 3598 54 1.5% 1514 35 5.8E-04
Colon 12 samples collected 30038 828 2.8% 4088 466 0.0E+00
Sample1-N10 4175 46 1.1% 54 2 1.2E-01
Sample2-N11 3412 32 0.9% 493 15 1.1E-05
Sample3-N13 515 7 1.4% 32 2 6.5E-02
Sample4-N15 4619 124 2.7% 702 62 0.0E+00
Sample5-N16 1539 31 2.0% 23 1 3.8E-01
Sample6-N17 1409 30 2.1% 476 22 9.0E-06
Sample7-N18 2288 51 2.2% 52 7 1.1E-04
Sample8-N20 1193 9 0.0% 4 0 1
Sample9-N21 2371 93 3.9% 662 51 2.3E-08
Sample10-N46 1850 60 3.2% 103 14 2.3E-06
Sample11-N51 6024 329 5.5% 1395 282 0.0E+00
Sample12-N8 643 16 2.5% 92 8 6.4E-04
Table 2: The percent of HLA-DRB1-expressing cells in total single cells and the percent of ACE2-expressing cells having HLA-DRB1 expression in the individual donor/patient whose P-value >=0.05
Tissue Donor/patient Total
Cells
ACE2 HLA-DRB1/Total
cells
ACE2&HLA-DRB1/ACE2 P-value
Mouth Sample9-HNSCC18 331 6 0.63141994 1 6.20E-02
Sample11-HNSCC22 178 4 0.668539326 1 2.00E-01
Sample16-HNSCC5 274 4 0.740875912 1 3.00E-01
Sample17-HNSCC6 297 6 0.410774411 0.666666667 1.90E-01
Bronchial
brushings
Sample1-Never smoke 1 81 6 0.790123457 0.833333333 6.30E-01
Sample3-Never smoke 3 84 4 0.607142857 1 1.30E-01
Sample4-Never smoke 4 82 6 0.817073171 0.833333333 7.00E-01
Sample5-Never smoke 5 75 4 0.413333333 0.75 7.00E-01
Sample8-Current smoke 2 87 4 0.75862069 1 3.20E-01
Sample10-Current smoke 4 86 13 0.848837209 1 9.90E-02
Sample12-Current smoke 6 85 4 0.611764706 1 1.30E-01
Lung Sample1-Donor1 2591 21 0.773446546 0.80952381 4.70E-01
Sample4-Donor4 3623 11 0.579354126 0.727272727 2.50E-01
Sample5-Donor5 3352 25 0.812649165 0.92 1.30E-01
Sample7-Donor7 5045 25 0.392071358 0.56 6.60E-02
Colon Sample1-N10 4175 46 0.012934132 0.043478261 1.20E-01
Sample3-N13 515 7 0.062135922 0.285714286 6.50E-02
Sample5-N16 1539 31 0.014944769 0.032258065 3.80E-01
Sample8-N20 1193 9 0.003352892 0 1
P-value of hypergeometric test is calculated to measure the significance of enrichment of ACE2-expressing cells in HLA-DRB1-expressing cells.
Reference
1 Huang, C.-l. et al. Clinical features of patients infected with 2019 novel coronavirus in Wuhan, China. The Lancet (2020).
2 Xu, X.-t. et al. Evolution of the novel coronavirus from the ongoing Wuhan outbreak and modeling of its spike protein for risk of human transmission. SCIENCE CHINA Life Sciences 63 (2020).
3 Zhou, P. et al. Discovery of a novel coronavirus associated with the recent pneumonia outbreak in humans and its potential bat origin. bioRxiv, 2020.2001.2022.914952, doi:10.1101/2020.01.22.914952 (2020).
4 Hamming, I. et al. Tissue distribution of ACE2 protein, the functional receptor for SARS coronavirus. A first step in understanding SARS pathogenesis. Journal of Pathology 203, 631-637 (2004).
5 Yu Zhao et al., Single-cell RNA expression profiling of ACE2, the putative receptor of Wuhan 2019-nCov. bioRxiv. January 26, 2020.
6 Bodis G et al., Role of Human Leukocyte Antigens (HLA) in Autoimmune Diseases. Rheumatol Ther. 2018 Jun;5(1):5-20.
Immunodeficiency Virus (HIV) and HIV/Hepatitis C Virus-Coinfected Women. J Infect Dis. 2019 Nov 10. pii: jiz589.
8 Srivastava R et al., Human Epitopes Identified from Herpes Simplex Virus Tegument Protein VP11/12 (UL46) Recall Multi-Functional Effector Memory CD4+ TEM Cells in Asymptomatic Individuals and Protect from Ocular Herpes Infection and Disease in "Humanized" HLA-DR Transgenic Mice. J Virol. 2020 Jan 8. pii: JVI.01991-19.
9 Kavuzlu M et al., Investigation of the Relationship Between BK Virus and Human Leukocyte Antigens in Kidney Transplant Recipients. Exp Clin Transplant. 2020 Jan;18(Suppl 1):51-54. 10 El-Bendary M et al., HLA Class II-DRB1 Alleles with Hepatitis C Virus Infection Outcome in Egypt: A Multicentre Family-based Study. Ann Hepatol. 2019 Jan - Feb;18(1):68-77.
11 Nishida N et al., Key HLA-DRB1-DQB1 haplotypes and role of the BTNL2 gene for response to a hepatitis B vaccine. Hepatology. 2018 Sep;68(3):848-858.
12 Wergeland S et al., Vitamin D, HLA-DRB1 and Epstein-Barr virus antibody levels in a prospective cohort of multiple sclerosis patients. Eur J Neurol. 2016 Jun;23(6):1064-70. 13 Luckey D et al., Immunity to Influenza is dependent on MHC II polymorphism: study with 2 HLA transgenic strains. Sci Rep. 2019 Dec 13;9(1):19061.
14 Ng MH et asl., Association of human-leukocyte-antigen class I (B*0703) and class II (DRB1*0301) genotypes with susceptibility and resistance to the development of severe acute respiratory syndrome. J Infect Dis. 2004 Aug 1;190(3):515-8.
15 Xiong P et al., Lack of association between HLA-A, -B and -DRB1 alleles and the development of SARS: a cohort of 95 SARS-recovered individuals in a population of Guangdong, southern China. Int J Immunogenet. 2008 Feb;35(1):69-74.
16 Ruiz Garcia S et al., Novel dynamics of human mucociliary differentiation revealed by single-cell RNA sequencing of nasal epithelial cultures. Development. 2019 Oct 23;146(20). 17 Reyfman, P. et al. Single-Cell Transcriptomic Analysis of Human Lung Provides Insights into the Pathobiology of Pulmonary Fibrosis. American Journal of Respiratory and Critical Care Medicine (2018).
18 Duclos GE, Teixeira VH, Autissier P, Gesthalter YB et al. Characterizing smoking-induced transcriptional heterogeneity in the human bronchial epithelium at single-cell resolution. Sci Adv 2019 Dec;5(12).
19 Puram SV et al., Single-Cell Transcriptomic Analysis of Primary and Metastatic Tumor Ecosystems in Head and Neck Cancer. Cell. 2017 Dec 14;171(7):1611-1624.e24.