Decision Support System for Metabolism-Based Transition to
Urban Water Systems of Tomorrow
Mark Morley*, Kourosh Behzadian*, Zoran Kapelan*, Rita Ugarelli**
* Centre for Water Systems, College of Engineering, Mathematics and Physical Sciences, University of Exeter, Exeter, EX4 4QF, UK
** SINTEF Building and Infrastructure, Forskningsveien 3b, NO-0314 Oslo, Norway
Abstract: A decision support system (DSS) tool for the assessment of intervention strategies in an urban water system (UWS) with an integral simulation model called "WaterMet2" is presented. Lists of intervention options and
Performance Indicators (PI) are exposed by the DSS for the user to define intervention strategies and metrics for their comparison. The quantitative and risk-based metrics are calculated by WaterMet2 and risk modules while the
qualitative metrics may be quantified by external tools feeding into the DSS. Finally, a Multi-Criteria Decision Analysis (MCDA) approach is employed in the DSS to compare the defined intervention strategies and rank them with respect to a pre-specified weighting scheme for different scenarios. This mechanism provides a useful tool for decision makers to compare different strategies for the planning of UWS with respect to multiple scenarios. The suggested DSS is demonstrated through the application to a northern European real-life case study.
Keywords: decision support system, indicator, intervention strategy, risk, WaterMet2.
Introduction
Urban water systems (UWS) face the long-term perspective of constraints and challenges associated with climate change and the availability of natural resources. This prospect requires the adaptation of the operation and infrastructure of UWS to meet uncertain future scenarios through the adoption of mitigating technologies in the water industry. However, it is suggested the impact on the UWS of these technologies, prior to their practical implementation, is best evaluated by a DSS. This approach has attracted attention by practitioners and researchers in recent years, leading to the development of tools such as AQUACYCLE (Mitchell et al., 2001), UWOT (Makropoulos et al., 2008), UVQ (Mitchell and Diaper, 2010), City Water Balance (Mackay and Last, 2010) and WaterMet2 (Behzadian and Kapelan 2015a). Despite a plethora of DSS being developed in recent years, relating to the integrated modelling of UWS, there remain outstanding issues which need to be addressed in this framework. The principal concern relates to simultaneously covering the whole range of sustainability dimensions in the Performance Indicators (PIs), including both quantitative and risk-based ones. Ideally, the PIs should reference all facets of sustainability including social, environment, economic, governance and assets (Alegre et al., 2012).
obtained after running the WaterMet2 model and the risk module are shown, along with how those outputs are used in the population of the multi-criteria decision analysis decision matrices.
DSS Methodology
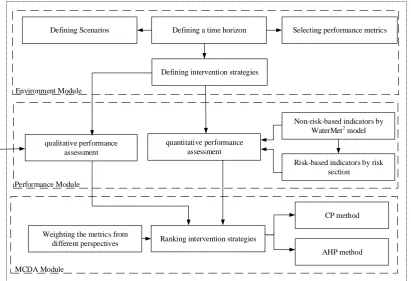
The Decision Support System (DSS) developed seeks to support long-term, strategic-level planning of UWS at the city/system level. This is achieved through a new methodology for comparison and selection of alternative solutions, within the framework of long-term transition paths, and amidst multiple decision criteria. The support offered to the decision maker takes several forms and guides the user through the description of alternative intervention options and scenarios. The structure of the classes in the DSS engine is split into three principle modules (Figure 1): 1) "Environment", 2) "Performance" and 3) MCDA. These modules are described below in further details.
Defining a time horizon
Defining Scenarios Selecting performance metrics
Defining intervention strategies
quantitative performance assessment qualitative performance
assessment
Non-risk-based indicators by WaterMet2 model
Risk-based indicators by risk section
Ranking intervention strategies
CP method
AHP method Weighting the metrics from
different perspectives Environment Module
Performance Module
MCDA Module
Figure 1. Flowchart of the suggested DSS framework.
Environment Module
The "Environment" part manages the specifications of the analysis including timing, intervention strategies, PIs, scenarios and customised model input. Basically, this module assists the user in defining the Environment configuration – i.e. the outline definition of the problem to be analysed. More specifically, the following steps are taken in this module:
Defining Scenarios which comprise varying input parameters to the analysis tool (i.e. WaterMet2 model) or to custom metrics defined outside of WaterMet2. Note that analysis of the UWS over some planning horizon in the DSS is the basis of a pre-specified scenario. Each scenario can influence a number of specific variables in WaterMet2.
Selecting the performance metrics of interest to be used for evaluation from the list of available PIs, including those supported by the WaterMet2 model and those supported by other tools outside the DSS.
Defining intervention strategies based on the list of available intervention options. Each intervention strategy comprises a set of individual interventions, including technologies and their operation on different parts of the UWS, each of which is assumed to occur at a specific time over a defined planning horizon. The DSS supports an existing library of individual intervention options quantified by WaterMet2 based on different components in the UWS.
Performance Module
The "Performance" part undertakes the responsibility of evaluating the performance metrics which are split into two categories: (1) performance assessment of quantitative metrics including non-risk-based and risk-based metrics calculated by the WaterMet2 and Risk section, respectively; (2) qualitative metrics of the aforementioned types, defined within the DSS and quantified by external tools outside the immediate scope of the DSS. The PIs calculated or supported by the WaterMet2 directly such as risk-based metrics are automatically populated in the DSS, whilst others evaluated outside the DSS need to be supplied manually by the user. Through repeated execution of the WaterMet2 model each intervention strategy is evaluated to determine its effect on Urban Water Cycle System (UWCS) performance. This is achieved by, firstly, applying each Scenario defined in the Environment Configuration in turn and also applying each intervention strategy in turn – at the appropriate time step. This process results in a series of metric values, for each time step and scenario, representing the performance of the system.
As a part of the built-in simulation model in the DSS, the WaterMet2 model is used to
descriptions of the components and their functionality can be found in Behzadian et al. (2014).
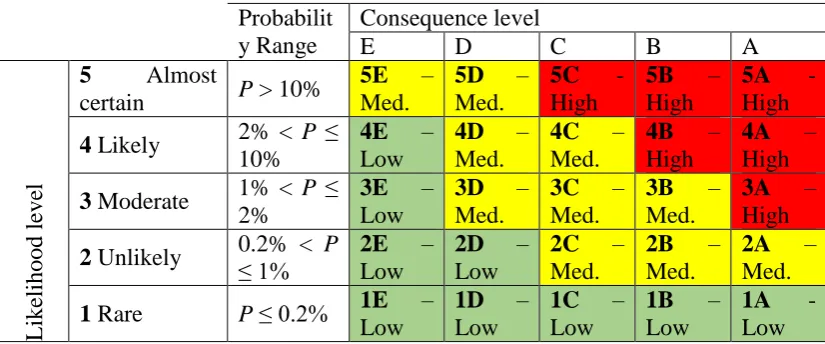
The risk assessment is calculated based on the likelihood of occurrence and severity of consequences. The likelihood is assumed here as the probability of the scenario under analysis and is scaled in five levels, each associated with a specified probability range (Table 1). The likelihood scale needs to be as objective as possible. The probability of risk event is assumed here to follow corresponding scenarios. For example, the probability of a risk event related to population growth is simplified as equivalent to the probability of the scenario of population growth. The scenario of high and low population growth were selected here to illustrate the methodology. For example, it is assumed that the probability of exceeding the upper limit of the 90% confidence interval is equal to 5% ([100 % - 90 %]/2). This means that there is a 5% probability that the population will follow the strong growth or higher and between 1 and 2% of being lower than the lower profile. Therefore, assuming Table 1 as reference scale, the probability level is set to 4 ‘likely' and 3 'moderate' respectively.
Considering that consequences are established as deviations from the sustainability objectives, with corresponding criteria, metrics and targets, the consequence scale consists of levels defined by ranges of deviations from the set targets. Consequences are defined here as five levels (A-E) of deviations of absolute value of risk event from a specified sustainability target value (Table 1). The absolute value of the consequences is estimated based on the PIs obtained from the UWS simulation in the WaterMet2 model. Note that the level of deviations for each metric needs to be converted to the summary scale as well (i.e. from A to E in which A is the most sever consequence level and E is the least one). Finally, the risk level can be estimated based on the assessment of likelihood and consequence levels for each event using a selected risk matrix, as shown in Table 1. The risk matrix was built in collaboration to the water utility comparing the levels of risk estimated during the risk analysis with the risk criteria established. The criteria for risk evaluation have been described and specified for each level of risk, it being usual to consider that the levels of low, medium and high risk are acceptable, tolerable and intolerable, respectively. The selection of the levels for each combination of probability and consequence levels have been selected for the metrics here presented, resulting the matrix of table 1.
Table 1. Risk matrix for quantifying risk-based metrics.
Probabilit y Range
Consequence level
E D C B A
Like
li
hood leve
l
5 Almost
certain P > 10%
5E – Med. 5D – Med. 5C - High 5B – High 5A - High
4 Likely 2% < P ≤ 10% 4E – Low 4D – Med. 4C – Med. 4B – High 4A – High
3 Moderate 1% < P ≤ 2% 3E – Low 3D – Med. 3C – Med. 3B – Med. 3A – High
2 Unlikely 0.2% < P ≤ 1% 2E – Low 2D – Low 2C – Med. 2B – Med. 2A – Med.
MCDA Module
Having created two or more intervention strategies, the principal role of the DSS is to undertake an automatic ranking of the strategies using a Multi-Criteria Decision Analysis (MCDA) technique. The MCDA module applies a user-configured ranking approach to the specified intervention strategies for the purposes of scoring and ranking them for each scenario and user preference combination. Two well-known MCDA techniques are implemented in the DSS for the purpose of ranking intervention strategies: Compromise Programming (CP) (Zeleny, 1973) and the Analytic Hierarchy Process (AHP) (Saaty, 1980) although the design does not preclude other techniques to be added, including optimization. The two methods were selected because of their widespread use but also because they use different ranking technologies and, also, allow users to express their preferences in a different way. In the CP method, user preferences are specified as multiple evaluation criteria weights making this method more suitable for use by less experienced users. In the AHP method, user preferences are specified via the pairwise criteria-importance comparisons. This requires more experience to configure and employ the method. The DSS will enable the user to select the method to use when solving a particular problem, including the possibility to use both methods on the same problem and then compare results (e.g. to see if there an alternative solution that is ranked highly regardless of the MCDA method used). Further details of these techniques can be found in Behzadian et al. (2015).
The ranking is performed according to the Metrics that have been identified in the Environment Configuration and is repeated for each combination of scenario and user preferences defined. Following the ranking, the decision maker is supported in interactively modifying the intervention strategies and submitting it for the evaluation and rankings to be revised. Any number of intervention strategies can be created by the DSS and existing Strategies can be cloned and modified to assist in "what-if?" analysis, allowing variations of Strategies to be analysed in a straightforward fashion to investigate their influence on the overall strategy rankings.
Case Study
Introduction
The urban water system of a northern European city is used here as a reference city for the case study combined with assumptions when necessary. The existing UWS comprises two main surface water resources connected to corresponding water treatment works (WTW), service reservoirs, distribution mains and eventually water consumption points. The existing sewer network represents a mix of combined and separate sewers which are connected to two (wastewater treatment works) WWTWs. Treated wastewater from WWTWs and untreated wastewater/stormwater from combined sewer overflows (CSOs) of sewer networks are discharged into a single receiving water body (i.e. downstream sea). The DSS is demonstrated here for conditions of likely future population growth. Hence, increased water demands as a result of highest foreseen population growth is the key driver which is likely to impose significant strains on the UWS performance. In the first instance, the DSS needs to have specified scenarios, intervention strategies and metrics and associated target/goals and preferences, described in the following sections.
In order to demonstrate the efficacy of the DSS, the following two scenarios related to high (Scenario 1) and low (Scenario 2) population growth are considered in this case study. In this instance, the WaterMet2 parameters changed in these population
growth scenarios are the different water demand categories (i.e. household/population growth, industrial/commercial growth and irrigation growth).
Intervention Strategies
Three types of intervention options are employed in this case study: (1) Addition of a new water resource along with two WTWs;
(2) Increased annual rehabilitation rate for pipes;
(3) Addition of rainwater harvesting (RWH) and grey water recycling (GWR) schemes;
Based on the above individual intervention options, the metabolism model is analysed in this demonstration based on the following seven alternative UWS intervention strategies against a 30 year planning horizon (2011-2040). Note that the intervention strategies numbered 3 to 7 start from 2015.
(1) Business as usual;
(2) Addition of a new water resource along with two WTWs starting from 2020; (3) 1% additional annual pipe rehabilitation starting from 2015;
(4) Addition of RWH and GWR systems at a local level by 25% of households starting from 2015;
(5) Addition of RWH and GWR systems at a local level by 25% and 50% of households, respectively, starting from 2015;
(6) Addition of RWH and GWR systems at a local level by 50% of households starting from 2015;
(7) Addition of RWH and GWR systems at a local level by 25% of households and 0.5% additional rehabilitation annually starting from 2015;
Performance Metrics
Six metrics according to the performance criteria of sustainability dimensions of water systems (Alegre et al., 2012) are considered for the purposes of this case study. These metrics include three quantitative criteria (C1-C3), two quantitative risk-based
criteria (C4, C5) and a single qualitative example. The quantitative metrics are directly
calculated by WaterMet2 and risk modules, respectively. The qualitative metric (C6) is
quantified by relevant experts and the quantified values incorporated in the DSS. Instead of using qualitative categories (linguistic terms) for metric C6, these are rated
as scoring on a scale of acceptance ranging from 1 to 10, being: extremely low (1-2), low (3-4), medium (5-6), high (7-8) and extremely high (9-10). Furthermore, for the risk-based metrics, failure times shorter than the time step in the simulation model (i.e. daily in the WaterMet2 metabolism model) cannot be captured by the DSS. A brief
description of these metrics is outlined below:
(1) Reliability of water supply (C1): the ratio of water delivered to customers to the
total water demand.
(2) Total cost (C2): annual average of the discounted initial capital investment of
(3) GHG emissions (C3): annual average of the aggregated greenhouse gas
emissions, as Global Warming Potential (GWP100) measured in units of carbon dioxide equivalents (CO2-eq) from all components of the UWS.
(4) Days with restrictions to water service (C4): the risk of the annual days with
restriction (water supply failure) being greater than the target value.
(5) Prolonged hydraulic failure (C5): the risk of annual expected value for the time
length of hydraulic failure being greater than a target value.
(6) Social acceptance (C6): the extent to which an intervention strategy would be
supported by society, especially water consumers; in order to fulfil the water demands with respect to a number of factors especially safety and health issues.
Results and discussion
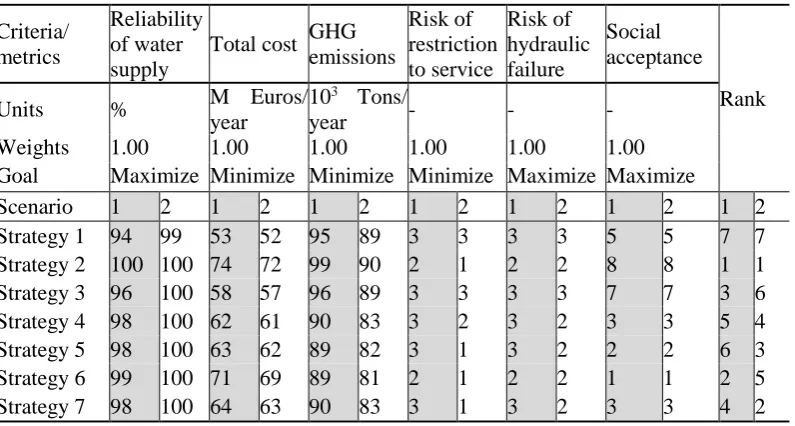
The results are presented in the following two parts: (1) calculation of the quantitative and risk-based metrics for each intervention strategy; (2) ranking the intervention strategies using MCDA. The expert-quantified values for the single qualitative metric are directly populated in the decision matrix.
The time-series of the quantitative metrics (C1-C3) over the planning horizon are
calculated by the DSS by running the WaterMet2 model with respect to each scenario and intervention strategy. The single value for each of these metrics is calculated and populated in Table 2 for each of the two scenarios.
Table 2. MCDA decision matrix and rankings for Scenarios 1 & 2
Criteria/ metrics
Reliability of water supply
Total cost GHG emissions
Risk of restriction to service
Risk of hydraulic failure
Social acceptance
Rank
Units % M Euros/
year
103 Tons/
year - - -
Weights 1.00 1.00 1.00 1.00 1.00 1.00
Goal Maximize Minimize Minimize Minimize Maximize Maximize
Scenario 1 2 1 2 1 2 1 2 1 2 1 2 1 2
Strategy 1 94 99 53 52 95 89 3 3 3 3 5 5 7 7
Strategy 2 100 100 74 72 99 90 2 1 2 2 8 8 1 1
Strategy 3 96 100 58 57 96 89 3 3 3 3 7 7 3 6
Strategy 4 98 100 62 61 90 83 3 2 3 2 3 3 5 4
Strategy 5 98 100 63 62 89 82 3 1 3 2 2 2 6 3
Strategy 6 99 100 71 69 89 81 2 1 2 2 1 1 2 5
Strategy 7 98 100 64 63 90 83 3 1 3 2 3 3 4 2
The risk-based metrics (C4, C5) are calculated based on the following sequential
water supply failure (C4) and prolonged hydraulic failure (C5), the consequence scales
of deviation value in Table 1 are defined as follows, respectively: E < 5% < D < 20% < C < 40% < B < 60% < A
and E < 20% < D < 50% < C < 85% < B < 90% < A.
Given the maximum value experienced being used to aggregate the risk-based metrics over the planning horizon, the consequence levels of risk events can be calculated as shown in Table 3. With the given likelihood and consequence levels, the risk is then estimated according to the risk matrix of Table 1 for each intervention strategy and scenario, the results of which are further illustrated in Table 3.
Table 3. Deviation values and risk estimation for risk-based metrics; H=high, M=medium, L=low
Scenario 1 Scenario 2
Strategy C4[%] C5 [%] C4[%] C5 [%]
Dev. Prob. Cons. Risk Dev. Prob. Cons. Risk Dev. Prob. Cons. Risk Dev. Prob. Cons. Risk
1 99 4 A H 100 4 A H 97 3 A H 99 3 A H
2 6 4 D M 83 4 C M 1 3 E L 80 3 C M
3 99 4 A H 100 4 A H 77 3 A H 97 3 A H
4 73 4 A H 88 4 B H 9 3 D M 80 3 C M
5 55 4 B H 88 4 B H 1 3 E L 83 3 C M
6 25 4 C M 84 4 C M 1 3 E L 83 3 C M
7 60.4 4 A H 88 4 B H 4 3 E L 90 3 B M
Ranking results
The aforementioned metric values calculated for each intervention strategy are used to populate the corresponding MCDA decision matrix, as per Table 2, for each of the two scenarios respectively. As the qualitative risk levels reported in Table 3 cannot directly be used for a quantitative comparison between the intervention strategies, they are rated on a scale between 1 and 3 as: high (3), medium (2) and low risk (1).
Following the population of the decision matrices, the ranking of intervention strategies is undertaken by means of the Compromise Programming (CP) method (Zeleny 1973). The outputs of this ranking can be seen in the two right-most columns of Table 2. In this table, equal metric weights have been used to rank the strategies.
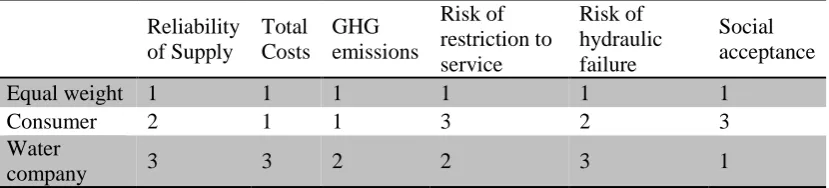
To further analyse the sensitivity of the ranking to the metric weights of the metrics, two further weighting schemes, including Water Company and Consumer perspectives, have been ranked by the MCDA (Table 4).
Table 4. Weights of the metrics from different perspectives
Reliability of Supply
Total Costs
GHG emissions
Risk of restriction to service
Risk of hydraulic failure
Social acceptance
Equal weight 1 1 1 1 1 1
Consumer 2 1 1 3 2 3
Water
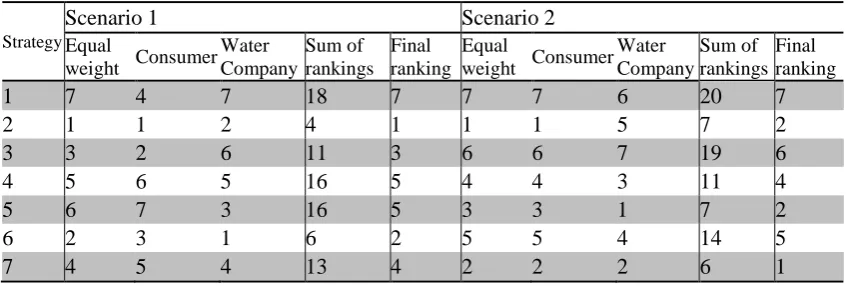
Given the three weighting schemes and two scenarios, a total of six groups of ranking for the intervention strategies are obtained, illustrated in Table 5. Naturally, there are several ways that these rankings can be merged together to achieve a final ranking for each intervention strategy. In this instance, the sum of the ranks of each strategy is used for determining final ranking, as shown in the last column for each scenario in Table 5.
Table 5. Summary of rankings of intervention strategies and final ranking
Strategy
Scenario 1 Scenario 2
Equal
weight Consumer Water Company
Sum of rankings
Final ranking
Equal
weight Consumer Water Company
Sum of rankings
Final ranking
1 7 4 7 18 7 7 7 6 20 7
2 1 1 2 4 1 1 1 5 7 2
3 3 2 6 11 3 6 6 7 19 6
4 5 6 5 16 5 4 4 3 11 4
5 6 7 3 16 5 3 3 1 7 2
6 2 3 1 6 2 5 5 4 14 5
7 4 5 4 13 4 2 2 2 6 1
As can be seen, Strategy 2, which has been consistently ranked highly, is selected in the top Strategy for both scenarios. However, it is further seen that if there is low population growth (Scenario 2), Strategy 7 is ranked first owing to its consistent high rank when seen from all perspectives. Strategy 1 has the lowest final rank because it has been identified as the worst strategy for several scenario/weighting combinations. Therefore, while Strategies 2 and 7 are recommended as the best strategies to adopt in this simple example, Strategy 1is clearly not to be recommended. However, further analysis will be required to fully cover and test different criteria for these strategies.
Conclusions
obtained on the case study demonstrate how the DSS developed and presented here can be used to effectively and efficiently assist planners in making better, more objective and strategic level decisions with respect to meeting the future long-term goals and performance targets in their urban water system/city.
Acknowledgements
This work was carried out as part of the "TRansition to Urban water Services of Tomorrow" (TRUST) project funded in the EU 7th Framework Programme under Grant Agreement No. 265122. The authors also wish to thank NTNU, Oslo VAV, LNEC and Addition (TRUST project partners) for their collaboration. Interested readers for receiving the DSS and WaterMet2 model for research purposes may contact the authors.
References
Alegre, H., Cabrera jr., E., Hein, A. and Brattebø, H. (2012), Framework for Sustainability Assessment of UWCS
and development of a self-assessment tool. Deliverable D31.1. TRUST Project.
Behzadian K., Kapelan, Z., Venkatesh, G., Brattebø, H., and Sægrov, S. (2014) WaterMet2: a tool for integrated
analysis of sustainability-based performance of urban water systems, Drink. Water Eng. Sci. Discuss., 7, pp1-26.
Behzadian, K., & Kapelan, Z. (2015a). Modelling metabolism based performance of an urban water system using WaterMet2.Resources, Conservation and Recycling,99, 84-99.
Behzadian, K., & Kapelan, Z. (2015b). Advantages of integrated and sustainability based assessment for metabolism based strategic planning of urban water systems.Science of the Total Environment,527, 220-231.
Behzadian, K., Morley, M. S., Vitorino, D., Coehlo, S., Ugarelli, R., & Kapelan, Z. (2015). Final report with DSS
methodology, software and case study from a pilot city, Deliverable 54.3. TRUST Project.
Mackay, R. and Last, E. (2010), SWITCH city water balance: a scoping model for integrated urban water management. Reviews in Environmental Science and Bio/Technology 9(4) 291-296.
Makropoulos, C.K., Natsis, K., Liu, S., Mittas, K. & Butler, D. (2008), Decision support for sustainable option selection in integrated urban water management. Environmental Modelling & Software 23(12) pp1448-1460.
Mitchell, V.G., Mein, R.G. and McMahon, T.A.(2001),Modelling the urban water cycle. Environmental Modelling
& Software, 16(7) pp615-629.
Mitchell, V.G. and Diaper, C. (2010), UVQ User Manual: (urban water balance and contaminant balance analysis
tool), Version 1.2, CMIT Report No. 2005-282. CSIRO.
Morley, M.S., Kapelan, Z. and Savić, D.A. (2012), Integrated Decision Support Framework. Deliverable D54.1. TRUST Project.
Saaty, T.L. 1980. The Analytic Hierarchy Process: Planning, Priority Setting, Resource Allocation, ISBN 0-07-054371-2, McGraw-Hill, New York, U.S.A. 287pp.
Ugarelli, R., Ceu Almeida, M., Behzadian, K., Liserra, T., Smeets, P., Kapelan, Z. and Sægrov, S. (2014) Sustainability Risk Based Assessment of Integrated Urban Water System, 11th International Conference on
Hydroinformatics, HIC 2014, New York City,