An Underwater Image Mosaicing and Fusion
Approach based on Weighted Aggregation
Energy Threshold using Multi-wavelet Transform
Mingwei ShengScience and Technology on Underwater Vehicle Laboratory Harbin Engineering University, Harbin, China
Email: [email protected]
Yongjie Pang, Lei Wan and Hai Huang
School of Shipbuilding Engineering / Harbin Engineering University, Harbin, China Email: [email protected], [email protected], [email protected]
Abstract—As ideal tools, autonomous underwater vehicles (AUVs) are used to implement underwater monitoring missions instead of human. Because the underwater images captured are many close-range images, the mosaicing and fusion method is applicable to create large visual representations of the sea floor. A novel mosaicing and fusion approach based on weighted aggregation energy threshold using Biorthogonal wavelet transform was proposed in order to improve the quality and contrast of the underwater images. Firstly, adopting the phase correlation method, the overlapped areas of the source images were determined, and then the overlapped areas were decomposed using Biorthogonal wavelet transform. Secondly, the overlapped area were fused and constructed adopting the low-frequency and high-frequency images fusion algorithms, and the mosaicing image with clarity contrast was obtained. Finally, fusion performance evaluations were carried out to evaluate the qualitative and quantitative of the image.
Index Terms—underwater image, mosaicing and fusion method, Biorthogonal wavelet transform
I. INTRODUCTION
Autonomous Underwater Vehicles (AUVs) are underwater mobile robots that can be applied to many tasks of difficult human exploration, such as periodical inspection of jacket structures of offshore platforms instead of human [1]. AUVs are usually equipped with video cameras to get the environment information in the sea. In underwater visual inspection, the vehicles are equipped with down-looking cameras, usually attached to the robot structure [2]. Images of the same scene from multi-sensors for certain scope with different features or different viewpoints resolution at different time usually provide redundancy and complementary information. More recently, image fusion method has been widely adopted during in the remote sensing, medical diagnosis image processing, intelligent robot and many other places [3]-[5]. Furthermore, the advantages of different underwater image sensors can be combined effectively
through image fusion method, which can improve the reliability of system and the information abundance of underwater image.
The image fusion method includes mainly three ways [6]: A direct fusion method using to fuse two source images of spatial registration into an image adopting some simple processions such as direct selecting or weighted average. Another algorithm is based on pyramid decomposition and reconstruction, which is eventually formed through reconstruction. The last method is the fusion algorithm based on the wavelet transform, which fuses images pertinently in the feature fields of each layer using multi-resolution analysis and Mallat fast algorithm. By comparison analysis, the visual effect of fused image obtained from the third method is better than the former methods; it was chosen as the fusion algorithm in this letter.
Due to the virtue of its multi-resolution, directivity and non redundancy, wavelet transform has been applied in image processing field successfully [7]-[10]. However, as the orthogonal filter of wavelet transform has the characteristics of linear phase, and the phase distortion will lead to the distortion of the image edge, so the Biorthogonal wavelet was involved to overcome the difficulty.
II. PHASE CORRELATION METHOD
The phase correlation image alignment method based on the Fourier shift property is easy to implement [11], [12], which states that a shift in the coordinate frames of two functions is transformed in the Fourier domain as linear phase differences. It can be described as follows:
Let I1(x, y) and I2(x, y) be two functions that are absolutely integrable over
\
2, and the relation equation is given:2( , ) 1( 0, 0)
I x y =I x x y y− − (1) According to the Fourier shift property
2 1 0 0
ˆ( , ) ˆ( , )exp( ( )) I u v =I u v −i ux +vy (2) Here, we define a function to encode the normalized cross power spectrum:
*
2 1
0 0
*
1 1
ˆ ( , ) ( , ) exp( (ˆ
)) ˆ( , ) ( , )ˆ
I u v I u v i ux vy
I u v I u v = − +
(3)
where * indicates the complex conjugate.
For solving Eq. (3) for (x0, y0), inverse Fourier transform the normalized cross power spectrum was involved, which is more robust to noise. As is a simple matter to determine (x0, y0), since from Eq. (3) the result is δ(x-x0, y-y0) which is a Dirac delta function centered at (x0, y0).
The phase correlation method provides a distinct sharp peak at the point of registration whereas the standard cross correlation yields several broad peaks and a main peak whose maximum is treated as the mosaicing point. The underwater images often suffer from effects such as diffusion, scatter and caustics, and the underwater images belong to blurred images. So the phase correlation method can handle the blurred images.
III. MOSAICING AND FUSION ALGORITHMS With Biorthogonal wavelet analysis and fast Mallet transform, the algorithm proposed firstly decomposed an image in single level to get an approximate (low-frequency) image and some detail (high-(low-frequency) images, which respectively represent different structures of the original image. And then the inverse Biorthogonal wavelet transform was carried out with special fusion algorithm, so the effect of fusion will be accomplished. A. Image Fusion based on Multi-wavelet Transform
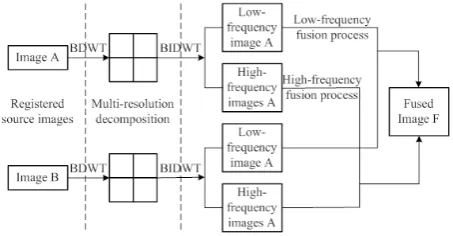
The fusion algorithm flow chart is illuminated as Figure 1. The fusion process is described as follows: firstly, the two overlapped areas of source underwater images are decomposed by multi-wavelet Biorthogonal transform, with the wavelet coefficients obtained. Secondly, the two images are reconstructed with the wavelet coefficients' matrix, and low-frequency and high-frequency images are to be given. Finally, according to the fusion rules, fusion and mosaicing process will be accomplished.
Figure 1. The fusion algorithm flow chart based Biorthogonal wavelet B. Low-frequency Fusion Rule
The low frequency component of the wavelet coefficient contains the main contour information of the signals and it is equivalent to the approximation of the source signals in a certain level, therefore this component contains most of the information. Because uniformity measure matched well with the subjective visual effects of the visual system, it is quit applicable to be implemented to describe those features, which change slowly in the low frequency domain. Therefore max algorithm was chosen as the low-frequency fusion rule. C. High-frequency Fusion Rule
Let' s take the image A for example, in the wavelet transform with (m, n) as the center pixel, in the direction of i, suppose a wavelet transform reconstruction high frequency gray value matrix be f Ai( ), whose size is 3×3, and moreover, f m ni( , ) is the gray value of pixel f Ai( )
at (m, n). Therefore, we define a saliency cost function to encode the local energy in the direction of i in the area with point (m, n) as its center:
1 1
2
1 1
( , ) ( , ) (( ),( ))
i i
A
m n
E m n w m n f m m n n
′=− ′=−
′ ′ ′ ′
=
∑ ∑
+ + (4)To calculate the energy of the two images, energy of source images i
A
E and i B
E were obtained, respectively. The size of window w m n( , )′ ′ adopted is 3×3, and the template coefficients of window are defined as follows:
0 1 0 ( , ) 1 2 1 0 1 0
w m n
⎡ ⎤
⎢ ⎥
′ ′ =⎢ ⎥
⎢ ⎥
⎣ ⎦
(5)
Suppose i( , ) A
f m n and i( , )
B
f m n respectively be the gray values at pixel (m, n) of the wavelet transform reconstruction high frequency images A and B; further suppose i( , )
F
f m n be the fusion result of the high frequency components from source images, so the mean value of the local energy i, ( , )
l AB
M m n can be described as
follows:
,
1 1
1 1
2 ( , ) (( ),( )) (( ),( )) ( , )
( , ) ( , ) l AB
i i
A B
i m n
i i
A B
w m n f m m n n f m m n n
M m n
E m n E m n
′=− ′=−
′ ′⋅ + ′ + ′ ⋅ + ′ + ′
=
+
∑ ∑ (6)
energy value in the main. Therefore, the high-frequency fusion rules are designed as follows:
When
, ( , )
l AB
i
M m n <T , the direct energy value
algorithm was adopted as follows:
if ( , ) ( , ) then ( , ) ( , )
if ( , ) ( , ) then ( , ) ( , )
i i hi
A B F A
i i hi
B A F B
E m n E m n f m n f m n E m n E m n f m n f m n
⎧ ≥ =
⎨
> =
⎩
(7)
When Ml ABi, ( , )m n ≥T , it is illustrated that the differences between the two source images are rather small. Therefore, the gray value of the region central pixel of the fused image can be computed using the weighted aggregation energy value algorithm as follows:
if ( , ) ( , )
then ( , ) ( , ) (1 ) ( , )
if ( , ) ( , )
then ( , ) (1 ) ( , ) ( , )
i i
A B
hi hi hi
F f A f B
i i
B A
hi hi hi
F f A f B
E m n E m n
f m n d f m n d f m n
E m n E m n
f m n d f m n d f m n
⎧ ≥ ⎪ = + − ⎪ ⎨ > ⎪ ⎪ = − + ⎩ (8)
Where df is the factor of difference influence with
,
1 ( , )
0.5 0.5 ( )
1
l AB
i f
M m n d
T −
= − ⋅
− .
IV. THE EVALUATION OF IMAGE FUSION PERFORMANCE The image fusion result depends on the evaluation method. The human vision system is quite sensitive to the changing local part in an image, so as a qualitative judgment, whether the edge and corner is obvious or not is an important standard. Therefore the evaluation methods here include the qualitative and quantitative comparison. Two indexes were adopted as follows:
(1) PSNR: the Peak Signal to Noise Ratio (PSNR) indicates the effectiveness of this algorithm. The PSNR (dB) is thus given as follows:
2
10 1 1
2 0 0 255 10log [ ( , ) ( , )] H W i j W H PSNR
s x y f x y
− − = = ⋅ ⋅ = −
∑∑
(9)where W and H denote the width and height of image. s(x, y) and f(x, y) indicate the gray scale value of overlapped area of registering source image and the fusion image.
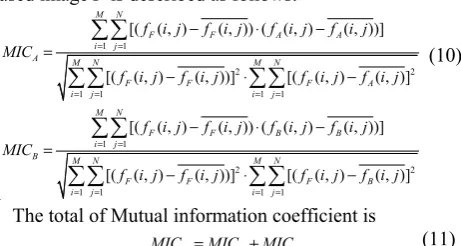
(2) Mutual information coefficient MIC represents the approximate degree of two images. Mutual information between overlapped area of the source image A, B and fused image F is described as follows:
1 1
2 2
1 1 1 1
1 1 2 [( ( , ) ( , )) ( ( , ) ( , ))] [( ( , ) ( , ))] [( ( , ) ( , )] [( ( , ) ( , )) ( ( , ) ( , ))] [( ( , ) ( , ))] [( ( , ) ( , M N
F F A A
i j
A M N M N
F F F A
i j i j
M N
F F B B
i j B
F F F B
f i j f i j f i j f i j MIC
f i j f i j f i j f i j
f i j f i j f i j f i j MIC
f i j f i j f i j f i = = = = = = = = − ⋅ − = − ⋅ − − ⋅ − = − ⋅ −
∑∑
∑∑
∑∑
∑∑
21 1 1 1
)]
M N M N
i j i j
j = = = = ⎧ ⎪ ⎪ ⎪ ⎪ ⎪ ⎨ ⎪ ⎪ ⎪ ⎪ ⎪ ⎩
∑∑
∑∑
(10)The total of Mutual information coefficient is
F A B
MIC =MIC +MIC (11) where f i jF( , ) and f i jA( , ) correspond to the gray values of the pixel (i, j) in the fusion image F and image
A. Moreover, ( , )f i jF and f i jA( , ) indicate the average gray value of the fusion image F and the overlapped area.
V. EXPERIMENTS AND RESULTS
A. Determination of Overlapped Areas in Source Images The mosaicing and fusion approach can enhance and improve the quality and contrast of the underwater images, and the determination of overlapped area is essential for image mosaicing. The reference and registering underwater source images are shown in Figure 2. From the figure we can conclude that the regions surrounded by red circles are blurred images.
(a) (b)
Figure 2. Overlapped area of the reference and registering underwater images. (a) Overlapped area in reference image. (b) Overlapped area in
registering image
The phase correlation result is illustrated as Figure 3. The result provides a distinct sharp peak at the point of registration whereas the standard cross correlation yields several broad peaks and a main peak whose maximum is considered as the mosaicing point. The overlapped area of the reference underwater image is determined and shown as Figure 4. In this letter, we define the square area between the mosaicing point and the bottom right corner as the overlapped area.
Figure 3 The normalized phase correlation between two consecutive
frames
Figure 4 Overlapped area in the reference image
B. Single Layer Decomposition of Images based on the Biorthogonal Wavelet Transform
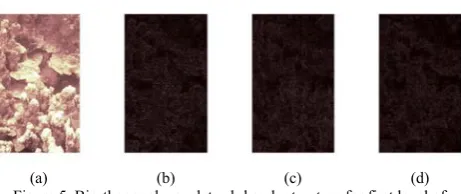
(a) (b) (c) (d) Figure 5. Biorthogonal wavelet sub-bands structure for first level of
decomposition for the overlapped area of image A. (a) approximation (b) horizontal detail. (c) vertical detail. (d) diagonal detail.
(a) (b) (c) (d) Figure 6 Biorthogonal wavelet sub-bands structure for first level of
decomposition for the overlapped area of image B. (a) approximation (b) horizontal detail. (c) vertical detail. (d) diagonal detail
C. Fusion and Mosaicing of Underwater Images
Adopting the fusion algorithm proposed while the weighted aggregation energy threshold value T=0.1, and the Biorthogonal wavelet sub-bands structure for first level of decomposition for the overlapped areas of source images were fused and reconstructed. the fused overlapped area image and mosaicing image are illustrated in Figure 7 and Figure 8, separately. The results suggest that the integrated mosaicing image is clearly visible and distinguishable.
Figure 7. Fusion overlapped area (T =
0.1). Figure 8. Mosaicing image
D. Influence of Weighted Threshold Value on the Fusion Results
According to the weighted threshold value set in equation (9) and equation (11), the influence of weighted threshold value on the image fusion effectiveness was observed and measured. The experiment results were shown in Figure 9 and Figure 10.
Figure 9. Image information entropy H versus threshold values
T
Figure 10. Mutual information coefficient MICF versus threshold
values T
Figure 9 and Figure 10 suggest that with the threshold values T increasing, the fusion image information including the Peak Signal to Noise Ratio PSNR, and mutual information coefficient MICF decrease. The results also demonstrate that more richness information and bigger mutual information coefficients can be obtained with smaller weighted threshold value.
VI. CONCLUSION
In this letter, we present a novel approach for underwater image mosaicing and fusion adopting the phase correlation method and Biorthogonal wavelet transform algorithm. Firstly, the overlapped area was determined using the phase correlation method. And then a novel fusion algorithm based on Biorthogonal wavelet transform including decomposition and reconstruction was carried out for the image mosaicing and fusion with the special high-frequency and low-frequency fusion rules of the different-position-focused underwater images. The mosaicing result shows that the proposed approach can preserve more edges in both highly and lowly corrupted images. As a quantitative index for the fusion method of high-frequency, the influence of weighted threshold values T was also submitted to analysis. Two quantitative indexes such as image Peak Signal to Noise Ratio and mutual information coefficient were involved into evaluate the fusion performance. The experimental results demonstrate that with the increase of the weighted aggregation energy threshold value T, the image Peak Signal to Noise Ratio PSNR, and mutual information coefficient MICF decrease. What this means in practice is that adopting the algorithm in this paper, smaller threshold values are more appropriate for the mosaicing and fusion for underwater blurred images.
ACKNOWLEDGMENT
This work was made possible by grants from the National Nature Science Foundation of China (51009040, 51209050), the Fundamental Research Funds for the Central Universities (HEUCF1321004), the China Postdoctoral Science Foundation (012M510928), and the Heilongjiang Postdoctoral Fund (LBH-Z12065). The authors greatly appreciate the referees for their helpful comments and suggestions, which helped improve this paper.
REFERENCES
[1] Santos-Victor J, Sentieiro J. The role of vision for underwater vehicles. Symposium on Autonomous Underwater Vehicle Technology, 1994, pp. 28-35.
[2] R. Garcia, V. Lla, F. Charot. Vlsi architecture for an underwater robot vision system. In IEEE Oceans Conference, 2005, Vol. 1, pp. 674–679.
[3] G. Simone, A. Farina, F. C. Morabito, et al, "Imagefusion techniques for remote sensing applications", 2002, Vol. 3(1), pp. 3-15.
[5] M. Hossny, "Towards autonomous image fusion", Control Automation Robotics & Vision, 2010, pp. 1748-1754. [6] J. Wang, D. Zion, C. Armenakis, et al, "A comparative
analysis of image fusion methods", IEEE Transaction on Geosciences and Remote Sensing, 2005, Vol. 43(6), pp. 1391-1402.
[7] H. Wang, J. Peng, W. Wu, "Fusion algorithm for multi-sensor images based on discrete multi-wavelets transforms", IEEE Proceedings on Vision, Image and Signal Processing, 2002, Vol. 149(5), pp. 283-289.
[8] M. X. Li, H. P. Mao, Y. C. Zhang, et al, "Fusion algotithm for muti-sensor images based on PCA and lifting wavelet transformation", New Zealand Journal of Agricultural Research, 2007, Vol. (50), pp. 667-671.
[9] W. Z. Shi, C. Q. Zhu, Y. Tian, et al, "Wavelet-based image fusion and quality assessment", Internation Journal of Applied Earth Observation and Geoinformation, 2005, Vol. 6(3-4), pp. 241-251.
[10]Z. Liu, Z. Y. Xue, R. S. Blum, "Concealed weapon detection and visualization in a synthesized image", Pattern Anal Applic, 2006, Vol. 8, pp. 375-389.
[11]C. D. Kuglin and D. C. Hines, “The phase correlation image alignment method,” in Proc. Int. Conf. Cybernetics Society, 1975, pp. 163–165.
[12]J. J. Pearson, D. C. Hines, S. Golosman, and C. D. Kuglin, “Video rate image correlation processor,” Proc. SPIE, 1977, pp. 197–205.
Mingwei Sheng received Ph.D and Master degree in Mechatronics Engineering from the State Key Laboratory of Robotics and Systems, Harbin Institute of Technology, China in 2011 and 2007. Currently he has work as a lecturer in National Key Laboratory of Science and Technology of Underwater Vehicle, Harbin Engineering University, China. His research interest includes underwater visual image enhancement, mosaicing and fusion.
Yong-jie Pang is a professor and supervisor for Ph. D candidate in school of Shipbuilding Engineering, Harbin Engineering University, China. His research interests including control studies of underwater vehicles and exploiting systems of resources in deep ocean, underwater environment perception.
Lei Wan is a researcher and supervisor for Ph. D candidate in school of Shipbuilding Engineering, Harbin Engineering University, China. His research interests including design of underwater vehicles and exploiting systems of resources in deep ocean, underwater virtual world simulation, multiple AUVs cooperation and coordination.