Glaucomatous Image Classification Using Wavelet
Based Energy Features And PNN
A. Iyyanarappan, G.Tamilpavai
PG Scholar, Dept. of Computer Science and Engineering Anna University, GCE-Tirunelveli Assistant Professor, Dept of Computer and Science Engineering, Anna University, GCE-Tirunelveli Email: [email protected]
Abstract: Glaucoma is the second leading cause of blindness worldwide. As glaucoma progresses, more optic nerve tissue is lost and the optic cup grows which leads to vision loss. Glaucomatous image classification can be efficiently performed using the texture features of an image. This paper focused on recent Glaucoma Classification techniques in Computer-Aided Diagnosis(CAD).Feature extraction is necessary to reduce the original dataset by measuring certain properties to make decision process easier during classification. Texture has been widely involved in many real life applications such as remote sensingbiomedical image processing, content based image retrieval. Representatives techniques and algorithm are explained to provide good idea about classification of fundus image which deals with 1how medical images could be analyzed, processed, feature extracted by 2D-DWT
methods and classified by Neural Network(NN), 2how the techniques above could be expanded further to resolve problem relevant to Glaucoma image.
Keywords: 2D-Discretewavelet transforms,Glaucoma, Feature extraction, Neural Network.
I.
INTRODUCTION
Glaucoma is caused due to the increase in intraocular pressure of the eye. The intraocular pressure increases due to malfunction or malformation of the drainage system of the eye. The anterior chamber of the eye is the small space in the front portion of the eye. A clear liquid flow in and out of thechamberandthis fluid is called aqueous humor.The increased intraocular pressure within the eye damages the optic nerve through which retina sends light to the brain where they are recognized as images and makes vision possible[1]. The goal of this paper is to develop an algorithm which automatically analyze eye ultrasound images and classify normal eye images and diseased glaucoma eye images The two central issues to automatic glaucoma recognition feature extraction from the retinal images and classification based on the chosen feature extracted. Features extracted from the images are categorized as either structural features or texture features.Here, discrete wavelet transform (DWT) using daubechies wavelet, symlets wavelet and biorthogonal wavelet are used to extract features. Wavelet Energy signatures are calculated from these extracted features [2]. Probabilistic Neural Network is used to automatically analyse and classify the images as normal or abnormal eye images.Finally, this Classifier can be used to distinguish between normal and glaucomatous images. We observed an accuracy of around 95%,this demonstrates the effectiveness of these methods.
II.
MATERIAL USED
The digital retinal images were collected from the web database, which manually curated the images based on the quality and usability of samples. The images were grouped into a set of normal retina images and a set of images clinically diagnosed with glaucoma. All the images were taken with a resolution of 560 × 720 pixel and stored in Lossless JPEG format. The dataset contains 30 fundus images. The 30 fundus images consist of 15 normal and 15 glaucomatous images collected from database [3].The fundus camera, a microscope, and a light source are used to acquire the retinal images to diagnose diseases.
Fig.1 a) Normal Retina Image (b) Glaucomatous Image In glaucomaFig.1(b), the optic nerve damages by the elevation in the intraocular pressure inside the eye, causing
irreversible damage to the optic nerve and to the retina.
III.
METHODOLOGY
Retina Image Classification can be based on these methods, In this they are using different techniques to classify image and then predict as Glaucoma or Normal Retina Image.
A. Image Acquisition B. Feature Extraction C. Image Classification
A. Image Acquisition
The first stage in fundal digital image analysis is image capture. This is normally acquired by a fundal camera (mydriatic or non-mydriatic) that has a back-mounted digital camera. Digital cameras use an image sensor likeDirect digital sensors are either a Charge-Coupled Device (CCD) or Complementary Metal Oxide Semiconductor Active Pixel Sensor (CMOS-APS) (Gonzalez and Woods,1992)[4]. S.Y.Lee(2004) proposed an,RNFL photographs were acquired by fundus camera system (CF-60UD, Canon Inc., Tokyo)integrated with digital camera (D60, Canon Inc.). Green filter was used to enhance the RNFL on the fundus photograph during acquisition. Image was stored in 1520 x 1080 pixel JPEG format for further analysis [5][6].
B. Feature Extraction
(db3), the symlets (sym3), and the biorthogonal (bio3.3) threewaveletfilters is used to extract features and analyzed discontinuities and abrupt changes contained in signals. DWT can be performed by iteratively filtering a signal or image through the low-pass and high-pass filters, and subsequently downsampling the filtered data by two Polikar (1999)[8]. This process will decompose the input image into a series of subband images. The wavelet features of an image are obtained by undergoing wavelet decomposition. Herethe wavelet decomposition is done by using 2-D discrete wavelet transformwhich captures both the spatial and frequency informations of a signal. DWT analyzes the image by decomposing it into a coarse approximation via low-pass filtering and into detail information via high-pass filtering [9,10]. Such decomposition is performed recursively onlow-pass approximation coefficients obtained at each level, until the necessary iterations are reached. Let each image be represented as a p × q gray-scale matrix I[i,j], where each element of the matrix represents the grayscale intensity of one pixel of the image. Each nonborder pixel has eight adjacent neighboring pixel intensities. These eight neighbors can be used to traverse the matrix. The resultant 2-D DWT coefficients are the same irrespective of whether the matrix is traversed right-to-left or left-to-right. Hence, it is sufficient that we consider four decomposition directions corresponding to 0◦ (horizontal, Dh), 90◦ (vertical, Dv) orientations. The decomposition structure for one level, I is the image, g[n] and h[n] are the low-pass and high-pass filters, respectively, and A is the approximation coefficient. As is evident from Fig.3, the first level of decomposition results in four coefficient matrices, namely, A1, Dh1, Dv1 [11][12].
Fig.32D-DWT Decomposition: 2ds1 indicates that row are down sampled by two and columns by one, 1ds2 indicates that row are down sampled by one and columns by two and The “x” operator indicates convolution operation. For instance, the 2D-DWT of a digital image is implemented bya low-pass filter which is convolved with the image rows, and a high pass filter which isconvolved with the image columns. The convolutions are followed by down sampling by afactor of two.As a result, the 2D-DWT hierarchically decomposes a digital image into aseries of successively lower resolution images and their associated detail images. Van de Wouwer (1999),Forinstance, the result of filtering process is four subbands: the approximation subband (LL),
thehorizontal detail subband (LH), the vertical detail subband (HL), and the diagonal detailsubband (HH) [13]. The LL, LH, HL, and HH subband are respectively low frequencies for bothdirections, low frequencies for the horizontal direction and high frequencies for the verticaldirection, high frequencies for the horizontal direction and low frequencies for the verticaldirection, and high frequencies for both directions [14].Then, the obtained approximation images(LL) are decomposed again to obtain one level detail and approximation images. This decomposition process can be represented in the common square scheme Fig.4, which is depictedbelow.
R-plane(LL) G-plane(LL) B-plane(LL) Fig.4 One level 2D-DWT decomposition of an image
Extract the Energy Features
The 2-D DWT is used in order to extract the energy signatures[15]. The DWT is applied to three different filters namely daubechies (db3), symlets (sym3) and biorthogonal (bio3.3, bio3.5, bio3.7). With the help of these filters, we obtain the wavelet coefficients.Since the number of elements in these matrices is high, and we only need a single number as a representative feature, we employ averaging methods to determine such single valued features. The definitions of the three features that were determined using the DWT coefficients are in order. Equations (1) and (2) determine the averages of the corresponding intensity values, whereas (3) is an averaging of the energy of the intensity values. Thus wavelet coefficients which are subjected to average and energy calculation results in feature extraction.
𝐀𝐯𝐞𝐫𝐚𝐠𝐞𝐃𝐯𝟏 = 𝟏
𝐩 × 𝐪 𝐃𝐯𝟏 𝐱, 𝐲 𝐲= 𝐪
𝐱= 𝐩
𝐀𝐯𝐞𝐫𝐚𝐠𝐞𝐃𝐡𝟏 = 𝟏
𝐩 × 𝐪 𝐃𝐡𝟏 𝐱, 𝐲 𝐲= 𝐪
𝐱= 𝐩
𝐄𝐧𝐞𝐫𝐠𝐲 = 𝟏
𝐩𝟐+ 𝐪𝟐 𝐃𝐯𝟏 𝐱, 𝐲 𝟐
𝐲= 𝐪 𝐱= 𝐩
Energy signatures provide a good indication of the total energy contained at specific spatial frequency levels and orientations [15].The energy-based approach assumes that different texture patterns have different energy distribution in the space-frequency domain. The energy obtained from the detailed coefficients can be used to distinguish between normal and glaucomatous images with very high accuracy. Hence these energy features are highly discriminatory. This approach is very appealing due to its low computational I
Rows x g(n) Rows x h(n)
2ds1 2ds1
Columns X g(n)
Columns X h(n)
1ds2 1ds2
A1 Dh
Columns X g(n)
Columns X g(n)
1ds2 1ds2
Dv Dd
LL1
HL1
LH1
complexity involving mainly the calculation of first and second order moments of coefficients.
C. Image Classification
Classifiers: The ability of each image-based feature extraction method to separateglaucoma and non-glaucoma cases is quantified by the results of PNN classifiers. Classifiers achieve good results if their underlying separation model fits well to the distribution of the sample data. As the underlying data distribution is unknown, we tested different classifiers
Classification using Probabilistic Neural Network: Unlike the standard backpropagation neural networks Haykin (2008)[16], the Probabilistic Neural Network (PNN) was developed by Donald Specht (1988)[17]. Classification refers to the analysis of the properties of an image. Depending upon the analysis, the dataset is further referred into different classes. Input features are categorized as 0 and 1.The classification process is divided into two phases: training phase and testing phase. In the training phase, known data is given and in testing phase an unknown data is given. Classification is done by using classifier after training phase. This network provides a general solution to pattern classification problems. Yamur (2008),Nayak et (2009) PNN is adopted for it has many advantages. Its training speed is many times faster than a BP network[18]. Additionally, it is robust to noise examples. However, we choose a basic Matlab PNN for its simple structure and training manner. The most important advantage of PNN is that training is easy and instantaneous. Weights are not “trained” but assigned. Existing weights will never be alternated but only new vectors are inserted into weight matrices when training. So it can be used in real-time [19].Since the training and running procedure can be implemented by matrix manipulation, the speed of PNN is very fast. The training set of PNN must be done through representative of the actual population of effective classification and it is characterized by the following, more demanding than most NN's, sparse set sufficient and erroneous samples and outliers tolerable. The training of PNN is fast as orders of magnitude faster than backpropagation.
Fig.5 Topology of the Probabilistic Neural Networks.
Specht(1990), The PNN employs an exponential activation function rather than the sigmoid function that is commonly used in the standard backpropagation neural networks. Then, a PNN can identify nonlinear decision boundaries that approach the Bayes optimal. The basic network topology consists of four layers shown above Fig.5. The first layer is the inputs layer. In the second layer, the neurons are divided to Agroups and the probability density function(PDF) of each group (a) of patterns is directly estimated from the set of training samples using window approximation method. The third layer performs the summation of all PDF. Finally, the Bayesian decision is made in the fourth layer. The PDF isassumed to follow a Gaussian distribution. Then, the PDF for a feature vector X to be of acertain category a, 1 ≤ a ≤ A, is given by:
f
a,i X = 1
2π p2
×m1× exp − X −X ai
, X −X ai 2σ 2 m
i=1
Where, p is the number of patterns in X, m is the number of the training patterns of category a, I is the pattern number, and σ is the smoothing factor of the Gaussian curves used to construct the PDF. The value of σ is optimized during training based on the clearestseparation of classes with the highest classification rate (Chen et al., 2007)[20].
IV.
IMAGE QUALITY EVALUATION METRICS
The quality of an image is examined by objective evaluation as well as subjective evaluation. For subjective evaluation, the image has to be observed by a human expert which is complicated and does not give the exact quality. There are various metrics used for objective evaluation of an image. Sensitivity is the probability of an abnormal class being classified as abnormal.
Sensitivity = TP
TP + FN × 100%
Specificity is defined as the probability of a normal class being identified as normal.
Specifity = TP
TN + FP × 100%
The Positive Predictive Accuracy (PPV) shows the accuracy of detecting the normal and abnormal cases.
PPV = TP
TP +FP × 100%
The accuracy shows quality or ability of the performance.
Accuracy = TP + TN
TP + FP + FN + TN× 100%
V.
EXPERIMENT RESULTS
The following section provides a detailed description of the results obtained from our, feature extraction, and Classification.
Feature ExtractionBased on DWT
The energy based approach assumes that different texture patterns have different energy distributions in the space-frequency domain. This approach is very appealing due to its low computational complexity involving mainly the calculation of first and second order moments of transform coefficients. Its provides a snapshot of the results obtained from Feature extraction described in the methodology section.
Table I- Shows the energy feature extraction using Discrete Wavelet Transform.
Feature Normal Glaucoma P-value
Energy 8.0830E-004± 4.1659E-005
3.9611E-004±
3.7244-004 ≤0.0001
Here one level Wavelet decomposition is done, and the wavelet filters used here were, the daubechies (db3), the symlets (sym3), and the biorthogonal (bio3.3) filters. The extractedfeatures were used for Classification.Fig.6shows the energy feature extraction using 2D-DWT.
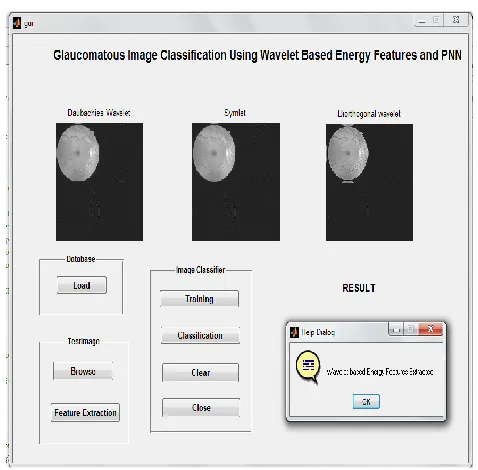
Fig.6 Energy feature extraction using 2D-DWT
ClassificationBased on PNN
Experimental results indicate that PNN has a number of majoradvantages over other traditional neural networks. Figure 7(a) & (b) shows classification result using PNN, the retinalimages are classified as „glaucoma is detected‟ or „glaucoma is not detected‟. First, the Wavelet transformtechnique is employed to extract the energy distribution featuresof the distorted signal at one leveldecomposition. Then, the PNN classifies these
extracted features to identify the normal and abnormal retinalimages according to the energy features. Experiments have been carried out to verify the ability of the PNN inachieving good classification rate.
Fig.7 (a)Retinal images are classified as Normal using PNN
Fig.8(b)Retinal images are classified as Abnormal using PNN
In this approach, we have considered 20 retinal images both normal andglaucoma eye.Out of 20 imagestaken forclassification, 10 were normal retinal images and the remaining 10 were glaucomatous images and 15 for training. Results are presented in table II.
TableII Classification Accuracies (%) of Classifier PNN after Feature Extraction
Classifier Sensitivit y
Specificit
y PPA Accuracy
From Table II shows the classification accuracy obtained by the classifier used.Thus the Sensitivity, Specificity, Positive Prediction Accuracy and Accuracy using theProbabilistic Neural Network were 95%, 90%, 90% and 95% respectively.
Conclusion
In this paper, a wavelet-based texture feature set has been used. The texture feature set is made up of the energy of sub images. Wavelet transform are very efficient tools for feature extraction and they are very successfully used in biomedical image processing. Classification technique is developed to automatically detect whether glaucoma is present or not. Features by DWT give maximum classification accuracy of 95% and it is rapid, easy to operate, non-invasive and inexpensive. We have carried out the classification by Probabilistic Neural Network for the purpose of examining the efficiency of the features extracted. If more powerful classifiers used, classification accuracy may further be improved.
Reference
[1]. R. Varma et al., “Disease progression and the need for neuroprotection in glaucoma management,” Am.J.ManageCare, vol. 14, pp. S15–S19, 2008. [2]. Amir Rajaei, LalithaRangarajan,”Wavelet Features
Extraction For Medical Image Classification”, Vol. 4, page(131-141), International Journal of Engineering Sciences, Sept 2011
[3]. Glaucoma research foundation.(2009) [Online]. Available:http://www.glaucoma.org/glaucoma/glauco ma-facts-and-stats.php
[4]. Gonzalez, R. C. & Woods, R. E. (2010). Texture. In Digital Image Processing (3rd ed.), pp. 849-861. USA: Pearson.
[5]. S.Y.Lee, K.K.Kim1, “Automated Quantification of Retinal Nerve Fiber Layer Atrophy inFundus Photograph Proceedings of the 26th Annual International Conference of the IEEE EMBS San Francisco,CA,USA September15,2000
[6]. S.Chandrika, K.Nirmala, “Comparative Analysis of CDR Detection for Glaucoma Diagnosis”, The International Journal of Computer Science& Applications (TIJCSA), ISSN-2278-1080,Vol.2 No.04, June 2013.
[7]. Daubechies, Ingrid. 1988. « Orthonormal bases of compactly supportedwavelets».Communications on Pure and Applied Mathematics, vol. 41, nº 7, p. 909-996
[8]. Polikar , R. (1999). The Story of Wavelets. Physics and ModernTopics in Mechanical and Electrical Engineering.
[9]. U. RajendraAcharya, SumeetDua, XianDu, “Automated Diagnosis of Glaucoma Using Texture and Higher Order SpectraFeatures”IEEE
Transactions on Information Technology inBiomedicine, May 2011.
[10]. SumeetDua,U. Ra jendra Acharya, Pradeep S. VinithaSree, “Wavelet-Based Energy Features for Glaucomatous Image Classification”, IEEE TransactionsOn Information TechnologyIn Biomedicine, Vol.16 No.1, January 2012
[11]. YufengZhenga,*, Edward A.
Essocka,“ANovelFeature Extraction Method– Wavelet-Fourier Analysis and Its ApplicationtoGlaucomaClassification”,Louisville, KY, Dept.ofOphthalmology& Visual Sci. Univ. of Louisville.
[12]. R.udiger Bock, J.org Meier, “Classifying Glaucomawith ImageBased Features from Fundus Photographs”,Dept. of Ophthalmology, University of Erlange-Nuremberg.
[13]. VandeWouwer, G. Scheunders, P. & Van Dyck, D. (1999). Statistical Texture Characterization from Discrete Wavelet Representations.IEEETransactions on Image Processing.
[14]. I. Kullayamma, P. MadhaveeLathaRetinal “Image Analysis for Exudates Detection” International Journal of Engineering ResearchandApplications (IJERA) ISSN: 2248-9622
[15]. Celina Rani George, “Glaucomatous ImageClassification UsingWaveletBasedEnergy Signatures & Neural Networks” International Journal of Engineering Research &Technology (IJERT)ISSN: 2278Vol. 2 Issue 3, March – 2013.
[16]. Haykin, S. (2009). Neural Networks and Machine Learning (3rd ed.).USA: Pearson. Higher Order Spectra Features”IEEE Transactions on Information Technology.
[17]. Specht. D. 1988. “ Probabilistic Neural Networks for Classification Mapping, or AssociativeMemory” IEEE International Conferenceon Neural Networks, p. 525-532.
[18]. J. Nayak, U. R. Acharya, P. S. Bhat, A. Shetty, , “Automated diagnosis of glaucoma using digital fundus images,” J. Med. Syst.,vol. 33,no. 5, pp. 337– 346, Aug. 2009.
[19]. Hiremath, P. S., &Shivashankar, S. (2006). “Wavelet
Based Features for Texture
Classification”.GVIPJournal, 6(3),pp.55-58. in Biomedicine, May 2011.