Shankar. World Journal of Engineering Research and Technology
SPATIAL DISTRIBUTION OF TOTAL DISSOLVED SOLIDS IN THE
GROUNDWATERS OF BANGALORE CITY, KARNATAKA, INDIA.
Shankar B. S.
Professor and Head, Civil Engineering Department, ACED, Alliance University,
Bangalore- 560 062, Karnataka, India.
Article Received on 31/05/2016 Article Revised on 20/06/2016 Article Accepted on 11/07/2016
ABSTRACT
Enhanced level of TDS in drinking water produces harmful effects on
human health and aquatic ecology. The present study deals with the
spatial assessment of Total dissolved solids (TDS) levels in the ground
waters of the industrial zones of Bangalore urban. Three major
industrial zones comprising of 8 areas were selected for the study. 30
groundwater samples from each of these areas (total of 240 samples),
were analyzed for TDS during the pre-monsoon and post-monsoon periods of 2015. Thus,
overall 480 samples in the two seasons were analyzed as per the Standard methods for the
examination of water and waste water (APHA, 2002) and the analyses results interpreted as
per the Bureau of Indian standards (BIS 10,500: 2003). Based on the analyses results, 20% of
the waters from the entire study area have recorded excess TDS concentration (>2000 mg/L)
as per the upper limit of BIS, with the Tannery area of Bangalore North being worst affected,
with 60% of the samples exceeding the TDS limits. The north, east and south zones recorded
40%, 11% and 16% non-potability due to excess TDS. TDS contours depicting the same have
also been presented.
KEYWORDS: Concentration, Groundwater, Pollutant, Total Dissolved Solids.
1. INTRODUCTION
The term solid refers to the matters either filterable of non-filterable that remain as a residue
in water i.e. TDS of water includes all soluble materials in solutions whether ionized or
non-ionized. It does not include suspended sediments, colloids or dissolved gases.
World Journal of Engineering Research and Technology
WJERT
www.wjert.org
SJIF Impact Factor: 3.419*Corresponding Author Dr. Shankar. B. S.
Professor and Head, Civil
Engineering Department,
ACED, Alliance
University, Bangalore-
Total dissolved solids (TDS) represent the total concentration of dissolved substance in the
water and one can measure the quality of drinking water based on level of TDS (Akhtar and
Tang, 2013). TDS in groundwater originate from natural sources, sewage, urban run-off and
industrial wastes. A large number of salts are found dissolved in water. The common ions are
bicarbonates, carbonates, chlorides, sulphates, phosphates, calcium, magnesium, sodium,
potassium, and iron.
Polluted drinking water is eventually linked to hundreds of thousands of deaths in whole
world in every year and is regarded as a prevalent health risk (Hussain et al., 2014). A high
content of dissolved solids elevates the density of water, reduces the solubility of gases, and
utility of water for drinking and other purposes.
According to World Health organization (WHO) and US-Environmental Protection Agency
(US-EPA) permissible limit of TDS is 1000 mg/L while Pakistan Council of Research in
Water Resources (PCRWR), Pakistan Standard and Quality Control Authority (PSQCA), it
illustrates its permissible limit as 500-1500 mg/L (PCRWR, 2007). Some other countries like
Thailand, China and Indonesia showed maximum acceptable limit not more than 500 mg/L
while in Japan it should be less than 1000 mg/L (WHO, 2006). But Indian Water Quality
Standards (BIS) places the desirable limit as 500 mg/L, while the excessive or maximum
permissible limits are placed at 2000mg/L (BIS 10,500, 2003). Excessive concentrations of
TDS are undesirable in water. Dissolved minerals, gases and organic constituents may
produce aesthetically displeasing colour, taste and odor. Some dissolved organic chemicals
may deplete the dissolved oxygen in the receiving waters. High concentration of dissolved
solids about 3000 mg/L may also produce distress in livestock. In industries, the use of water
with high amount of dissolved solid may lead to scaling in boilers, corrosion and degraded
quality of the product. Excessive levels of TDS may cause gastrointestinal disorders and
laxativeness in transient consumers in addition to various other disorders.
Details of study zones
Bangalore city lies between North Latitude 1205212111 to 13061011 and East Longitude
770014511 to 7703212511 covering an area of approximately 400 square km. The entire study
area is covered in part of the Survey of India Toposheet No 57 G and 57 H series. The study
area of Bangalore city has been divided into 3 industrial zones, namely,
Zone I: Bangalore North
The industrial areas selected in each zone are listed below.
Zone I: Bangalore North
1. Peenya industrial area
2. Tannery industrial area
Zone II: Bangalore East
1. K.R.Puram industrial area
2. Whitefield industrial area
3. Bellandur industrial area
Zone III: Bangalore South
1. Bommasandra industrial area
2. Bommanahalli industrial area
3. Kengeri industrial area
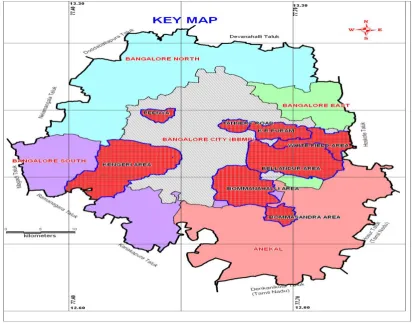
Figure 1 shows the key map of the entire study zone, and the individual study areas.
2. MATERIALS AND METHODS
Thirty water samples were collected from both the borewells and open wells in each of the 8
industrial areas during March and October 2015 seasons in two litre PVC containers and
sealed and later analyzed for Total dissolved solids gravimetrically using a hot air oven as per
the standard methods for examination of water and wastewater (APHA, 2002). Thus a sum
total of 480 groundwater samples were analysed and the results obtained were evaluated in accordance with the standards prescribed under „Indian Standard Drinking Water Specification IS 10500: 2003‟ of Bureau of Indian Standards.
3. RESULTS AND DISCUSSION
The TDS analysis results showing the minimum, maximum and mean seasonal
concentrations (mg/L) has been presented in Table 1.
Legend for Tables. S.No Title
1 Minimum, maximum and mean seasonal concentrations of TDS in groundwaters
Legend for Figures. Fig. No. Title
1 Key map of Study area (Bangalore) showing the individual study areas. 2 TDS Contours for the groundwaters of Peenya industrial area during
post-monsoon
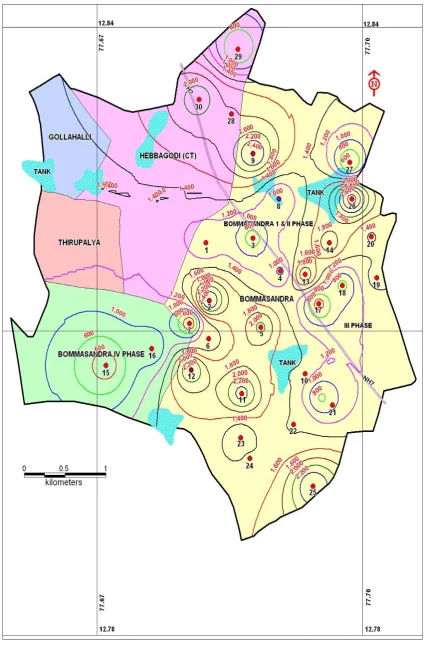
3 TDS Contours for the groundwaters of Tannery industrial area 4 TDS Contours for the groundwaters of Bommasandra area
Table 1: Minimum, maximum and mean seasonal concentrations of TDS in groundwaters.
S.
No Study zone and areas
Pre-monsoon Post-monsoon
Min Max Mean Min Max Mean
North Zone
1 Peenya 239 3814 1191.86 290 3575 1248.83 2 Tannery area 355 5075 2015.67 455 5390 2148.37 East Zone
1 K.R.Puram 320 2435 1044.83 340 2545 1111.0 2 Whitefield 220 1160 700.67 215 1245 748.5 3 Bellandur 205 2650 1122.67 200 2745 1171.83 South Zone
The Table 1 indicates that TDS value varies from a minimum of 205 mg/L in the
groundwater sample( W 22) of Whitefield area, to a maximum of 5075 mg/L in sample T13
of Tannery industrial area during the pre-monsoon season, with a maximum statistical mean
of 2015.67 mg/L in Tannery industrial area. In post-monsoon, the TDS values vary from a
minimum of 200 mg/L in sample no BE 17 of Bellandur area to a maximum of 5390 mg/L
in sample no T13 of Tannery industrial area, with a maximum statistical mean of 2148.37
mg/L in the same Tannery area. The average concentrations of TDS during post-monsoon in
North, East and south zones are 1699, 1010 and 1118 µ mg/L respectively. Further TDS
values have exhibited an increasing trend in concentration during post-monsoon season
compared to pre-monsoon due to mixing of surface pollutants during the infiltration and
percolation of rainwater. Salts which are held back in the interstice or pores while
groundwater is evaporated or water table falls, get leached back to the groundwater during
the rainy period. Hence the post monsoon waters have higher TDS levels when compared to
pre-monsoon season (Janardhana Raju 2007). Waters with high TDS (>2000mg/l) are of
inferior palatability and may induce an unfavorable physiological reaction in the transient
consumer and gastro intestinal irritation (Ranjit Singh and Ajith Kumar 2004).
In the present study 20% of the waters from the entire study area have recorded excess TDS
concentration (>2000 mg/L) as per the upper limit of BIS, with the Tannery area of
Bangalore North being worst affected, with 60% of the samples exceeding the TDS limits.
The north, east and south zones recorded 40%, 11% and 16% non-potability due to excess
TDS.
It is observed that the TDS levels in tannery area are extremely and alarmingly high. This is
because various chemicals are used in the tanneries, such as lime, sodium carbonate, common
salt or sodium chloride, sodium sulphate, chromium sulphate etc. The biggest polluting
material in these tanneries, which is very difficult to get rid of is common salt, used as a raw
material, which has resulted in salinization of groundwater and increased the TDS levels
immensely.
Further, (Carrol, 1962) classified the groundwaters based on TDS as
This classification has helped in classifying the waters in the study area as brackish category.
In the entire study areas, 52.5 % of the samples fall under fresh category, while the remaining
47.5 % fall under brackish category based on TDS classification. The maps showing the TDS
contours for Peenya, Tannery area and Bommasandra industrial area has been presented in
Figures 2 to 4.
Fig
.2: TDS Con
tours f
or
t
h
e gr
ou
n
d
wat
er
s of
Pe
en
ya in
d
u
str
ial
ar
ea d
u
rin
g p
ost
-m
on
F
ig.
3
:
T
DS Con
tours f
or
the g
rou
n
d
wat
er
s o
f Tan
n
er
y in
d
u
str
ial
ar
ACKNOWLEDEMENTS
The Author is extremely grateful to the Chancellor, Dr. Sudhir Angur, Alliance University
and Professor Sudhindra, Director, ACED, for the whole-hearted support and encouragement
provided by them apart from the excellent library and laboratory facilities that were provided
to the author during the course of the work.
REFERENCES
1. Akhtar M M and Tang Z. “Identification of contamination sources and TDS concentration in groundwater of second biggest city of Pakistan”, International Journal of
Environmental Science and Development, 2013; 4(1): 341–345.
2. APHA. “Standard methods for the examination of water and wastewater”, 20thedition, American Public and Health Association, Washington D.C, New York, USA, 2002.
3. BIS 10500. “Bureau of Indian Standards”, Manak Bhavan, New Delhi, India, 2003.
4. Carrol D. “Rain water as a chemical agent of geologic processes- A review”, USGS water
supply paper., 1962; 1535-G: 18.
5. Hussain I, Shakeel M, Faisal M, Soomro Z A, Hussain M, and Hussain T, “Distribution
of Total Dissolved Solids in Drinking Water by Means of Bayesian Kriging and Gaussian Spatial Predictive Process”, Water Quality Exposure Health, 2014; DOI
10.1007/s12403-014-0123-9.
6. Janardhana Raju N. “Hydrogeochemical parameters for assessment of groundwater quality in upper Gunjanaeru River basin, South India”, Environ Geol, 2007; 52:
1067–1074.
7. Maqsood Ahmad and Sohail Chand. “Spatial Distribution of TDS in Drinking Water of Tehsil Jampur using Ordinary and Bayesian Kriging”, Pak. j. stat. oper. res., 2015; 11(3):
377-386.
8. PCRWR. National water quality monitoring programme water quality Islamabad. Report:
2005–2006, Pakistan Council for Research in Water Resources, Islamabad, 2007.
9. Ranjit Singh A J and Ajith Kumar T T, “Water quality analysis of drinking water resources in selected villages in Tirunelveli District”, Indian Journal of Env Protection,
2004; 24: 48-52.
10.WHO. “Guidelines of drinking water quality recommendation”, 3rd edition. World