https://dx.doi.org/10.22161/ijaems.5.5.8 ISSN: 2454-1311
Multi Color Image Segmentation using L*A*B*
Color Space
Aden Darge
1, Dr Rajesh Sharma R
2, Desta Zerihum
3, Prof Y K Chung
41PG Student Department of Computer Science and Engineering, School of Electrical Engineering and Computing, Adama
Science and Technology University, Adama, Ethiopia.
2Assistant Professor, Department of Computer Science and Engineering, School of Electrical Engineering and Computing,
Adama Science and Technology University, Adama, Ethiopia.
3Program Chair, Department of Computer Science and Engineering, School of Electrical Engineering and Computing, Adama
Science and Technology University, Adama, Ethiopia.
4Professor, Department of Computer Science and Engineering, School of Electrical Engineering and Computing, Adama Science
and Technology University, Adama, Ethiopia.
Abstract— Image segmentation is always a fundamental but challenging problem in computer vision. The simplest approach to image segmentation may be clustering of pixels. my work s in this paper address the problem of image segmentation under the paradigm of clustering. A robust clustering algorithm is proposed and utilized to do clustering on the L*a*b* color feature space of pixels. Image segmentation is straight forwardly obtained by setting each pixel with its corresponding cluster. We test our segmentation method on fruits images, medical and Mat lab standard images. The experimental results clearly show region of interest object segmentation.
Keywords— color space, L*a*b* color space, color image segmentation, color clustering technique.
I. INTRODUCTION
A Lab color space is a color-opponent space with dimension L for lightness and a and b for the co lor opponent dimensions, based on nonlinearly co mpressed CIE XYZ color space coordinates. The coordinates of the Hunter 1948 L, a , b color space are L, a, and b [1][2]. However, Lab is now more often used as an informa l abbreviation for the CIE 1976 (L*, a*, b*) colo r space (also called CIELAB, whose coordinates are actually L*, a*, and b*). Thus, the initia ls Lab by themselves are somewhat a mb iguous. The color spaces are related in purpose, but differ in imple mentation. Color spaces usually either model the human vision system or describe device dependent color appearances. Although there exist many diffe rent color spaces for human vision, those standardized by the CIE (i.e . XYZ, CIE Lab and CIE Luv, see for e xa mp le Wyszecki & Stiles 2000) have gained the greatest popularity. These
color spaces are device independent and should p roduce color constancy, at least in princ iple. A mong device dependent color spaces are HSI, NCC rgbI and YIQ (see Appendix 1 for formulae ). The different versions of HS-spaces (HSI, HSV, Flec k HS and HSB) are related to the human vision system; they describe the color’s in a way that is intuitive to humans.
The three coordinates of CIELA B represent the lightness of the color (L* = 0 y ields black and L* = 100 indicates diffuse white; specular wh ite may be higher), its position between red/magenta and green (a*, negative
values indicate green while positive values indicate magenta) and its position between yellow and blue (b*, negative values indicate blue and positive values indicate yellow). The asterisk (*) after L, a and b are part of the full name, since they represent L*, a* and b*, to distinguish them fro m Hunter's L, a, and b, described below. Since the
https://dx.doi.org/10.22161/ijaems.5.5.8 ISSN: 2454-1311
correlates of chro ma and hue. Since CIELA B and CIELUV, the CIE has been incorporating an increasing number of colors appearance phenomena into their mode ls, to better model color vision. These color appearance models, of which CIELA B, a lthough not designed as [3] can be seen as a simple example [4], culminated with CIECAM02.
II. COLOR SPACE
The nonlinear relat ions for L*, a*, and b* are intended to mimic the nonlinear response of the eye. Furthermore , uniform changes of components in the L*a*b* color space aim to correspond to uniform changes in perceived color, so the relative perceptual diffe rences between any two colors in L*a*b* can be approximated by treating each color as a point in a three dimensional space (with three components: L*, a*, b*) and taking the Euc lidean d istance between them [5].
A. Device independent color space
Some co lor spaces can express color in a device-independent way. Whereas RGB colors vary with display and scanner characteristics, and CMYK co lors vary with p rinter, ink, and paper characteristics, device independent colors are not dependent on an y particular device and are meant to be true representations of colors as perceived by the human eye. These color representations, called device-independent color spaces, result fro m work carried out by the Co mmission
International d’Eclairage (CIE) and for that reason are also called CIE-based color spaces. The most common method of identifying color within a color space is a three-dimensional geometry. The three color attributes, hue, saturation, and brightness, are measured, assigned numeric values, and plotted within the color space.
B. CIE XYZ to CIE L*a*b* (CIELAB) and CIELAB to CIE XYZ conversion
where,
Here Xn, Yn and Zn are the CIE XYZ tristimulus values of the reference white point (the subscript n suggests "normalized").
The division of the f(t) function into t wo do ma ins was done to prevent an infinite slope at t = 0. f(t) was assumed to be linear below some t = t0, and was assumed to match the t1/3 part of the function at t0 in both value and slope. In other words:
Reverse transformation
C. Lab color space
The overall concept starting fro m conversion of origina l image to L*a*b* color space and then object segmentation is represented through block diagram.
Figure 1.Color Image Segmentation for Medical Images using L*a*b* Color Space
D. Color difference
https://dx.doi.org/10.22161/ijaems.5.5.8 ISSN: 2454-1311
a. Delta E
The International Co mmission on Illu mination (CIE) ca lls
their distance metric ΔE*ab (also called ΔE*, dE*, d E, or
―Delta E‖) where delta is a Greek letter often used to
denote difference, and E stands for Empfindung; Ge rman for "sensation". Use of this term can be traced bac k to the influential Hermann von He lmholt z and Ewa ld Hering. In
theory, a ΔE of less than 1.0 is supposed to be indistinguishable unless the samples are adjacent to one another. However, perceptual non-uniformit ies in the underlying CIELA B color space prevent this and have led to the CIE's refin ing their defin ition over the years. These non-uniformit ies are important because the human eye is more sensitive to certain colors than others. A good metric should take this into account in order for the notion of a "just noticeable difference" to have meaning. Otherwise, a
certain ΔE that may be insignificant between two colors that the eye is insensitive to may be conspicuous in another part of the spectrum [6].Unit of measure that calculates and quantifies the diffe rence between two co lors -- one a reference co lor, the other a samp le co lor that attempts to match it -- based on L*a*b* coordinates. The "E" in "Delta E" co mes fro m the German word "Emp findun g," meaning "feeling, sensation Delta" co mes fro m the Gree k language,
and is used in mathematics (as the symbol Δ) to signify an
incre mental change in a variab le, i.e., a difference. So, "Delta E" co mes to mean "a diffe rence in sensation." A Delta E of 1 or less between two colors that are not touching one another is barely perceptible by the average
considered an acceptable match in co mme rcia l reproduction on printing presses. (Note: Hu man v ision is mo re sensitive to color d iffe rences if two colors actually touch each other.) The higher the De lta E, the greater the d ifference between the two samples being co mpared. There are several methods by which to calcu late De lta E va lues, the most common of which a re Delta E 1976, De lta E 1994, De lta E CM C, and Delta E 2000. De lta E 2000 is considered to be the most accurate formulat ion to use for s mall delta E ca lculations (<5). Day light hu man vision (a.k.a ., photopic vision) is most sensitive to the green region of the color spectrum around 550n m, and least sensitive to colors near the e xtre mes of the visible spectrum (deep blue purples at one end and deep reds at the other). For that reason, color diffe rences in the latter regions are harder for the average human observer to detect and quantify, ma king Delta E measurements for those colors possibly less accurate.
b. Tolerance
Tolerancing concerns the question "What is a set of colors
https://dx.doi.org/10.22161/ijaems.5.5.8 ISSN: 2454-1311
which holds L* (lightness) fixed. As can be observed on the diagra m on the right, the e llipses denoting the tolerance contours vary in size. It is partly due to this non -uniformity that lead to the creation of CIELUV and CIELA B. More generally, if the lightness is allowed to vary, then we find the tolerance set to be ellipsoidal. Increasing the we ighting factor in the aforementioned distance expressions has the effect of increasing the size of the e llipsoid a long the respective axis [7].Turgay Ce lik and Tard i Tjahjad i [7] presented an effective unsupervised color image segmentation algorith m which uses multi scale edge informat ion and spatial color content. The segmentation of homogeneous regions is obtained using region growing followed by region merging in the CIEL*a*b* color space.
c. Delta difference and tolerance
The difference between two color samples is often
expressed as Delta E, also called DE, or ΔE. 'Δ' is the Gree k letter for 'D'. This can be used in quality control to show whether a printed samp le, such as a color swatch or proof, is in tolerance with a refe rence sample or industry standard. The difference between the L*, a* and b* values between
the reference and print will be shown as Delta E (ΔE). The
resulting De lta E nu mber will show how far apart v isually the two samples are in the color 'sphere'.
Customers may specify that their contract proofs must have
tolerances within ΔE 2.0 fo r examp le. Different tolerances may be specified fo r greys and primary colors. A value of less than 2 is common for greys and less than 5 for primary CM YK and overprints. This is somewhat contentious however. Proofing RIPs sometimes have verification software to check a proof against a standard scale, such as an Ugra/ Fogra Media Wedge, using a spectrophotometer. Various software applicat ions are available to check co lor swatches and spot colors, proofs, and printed sheets. Delta E d isplays the difference as a single value for color and
lightness. ΔE values of 4 and over will normally be visib le to the average person, while those of 2 and over may be visible to an e xperienced observer. Note that there a re several subtly diffe rent variations of De lta E: CIE 1976, 1994, 2000, cmc delta e [8].
III. METHODOLOGY
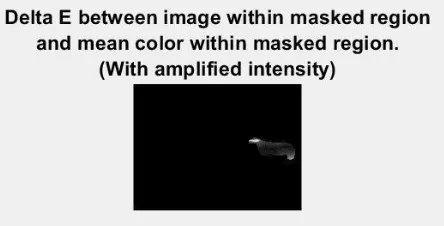
User draws region and this finds pixe ls in the image with a similar color, using De lta E. As well as the RGB image is converted to LA B co lor space and then the user draws some freehand-drawn irregularly shaped region to identify a color. The Delta E (the color difference in LA B color space)
is then calculated for every pixel in the image between that pixe l's color and the average LA B co lor of the dra wn region. The user can then specify a number that says how close to that color would they like to be. The software will then find all p ixe ls within that specified De lta E of the co lor of the drawn region.
IV. COLOR-BASED SEGMENTATION USING
PROPOSED CLUSTERING TECHNIQUE The proposed approach performs clustering of color space. A particle consists of K cluster centroids representing L*a*b* color trip lets. The basic a im is to segment colors in an automated fashion using the L*a*b* color space and K-means clustering. The entire process can be summa rized in following steps
Step 1: Read the image. Read the image fro m mother
source which is in .JPEG format, which is a fused image.
Step 2: For color separation of an image apply the De
-correlation stretching.
Step 3: Convert Image fro m RGB Co lor Space to L*a*b*
Color Space. How many colors do we see in the image if we ignore variations in brightness? There are three colo rs: white, blue, and pink. We can easily visually distinguish these colors fro m one another. The L*a*b* color space (also known as CIELA B or CIE L*a*b*) enables us to quantify these visual differences. The L*a*b* color space is derived fro m the CIE XYZ tristimulus values. The L*a*b* space consists of a lu minosity layer 'L*', chro matic ity -layer 'a*' indicating where colo r falls along the red-g reen a xis, and chromatic ity-layer 'b*' indicat ing where the color fa lls along the blue-yellow a xis. A ll of the color informat ion is in the 'a*' and 'b*' layers. We can measure the difference between two colors using the Euclidean distance metric. Convert the image to L*a*b*color space.
Step 4: Classify the Colors in 'a*b*' Space Using K-Means
https://dx.doi.org/10.22161/ijaems.5.5.8 ISSN: 2454-1311
Step 5: Label Eve ry Pixe l in the Image using the results
from K-MEANS.
For every object in our input, K-means returns an index corresponding to a c luster. Label every p ixe l in the image with its cluster index.
Step 6: Create Images that Segment the Image by Color.
Using pixe l labels, we have to separate objects in image by Color.
Step 7: Segment the Nuclei into a Separate Image.
A. Proposed clustering algorithm
Propose clustering algorithm is under the category of Squared Error-Based Clustering (Vector Quantizat ion) and it is a lso under the category of crisp clustering or hard clustering. Proposed algorithm is very simple and can be easily imp le mented in solving many practical proble ms. Proposed algorithm is ideally suitable for biomed ical image segmentation since the number of c lusters (k) is usually known for images of particular regions of human anato my. Steps of the proposed clustering algorithm are given below:
V. RESULTS AND EVALUATION
After the conversion of image into L*a*b* color space, segmentation algorithm is applied.
Figure 5 shows the results of Matlab standard peppers image for two d ifferent Region of interest (ROI) (a) first ROI having De lta E <= 30.9 or >30.9 (b ) second ROI having Delta E <= 54.3 or > 54.3. And also represents the
complete steps to obtain segmentation with selection of object of interest (Reg ion of Interest (ROI)), L*a*b* representation, their histograms and segmented results with matching colors or not matching colors. Figure 8 shows the results of Hu man Hea rt image with (a ) Origina l image (b),(c ) and (d) Heart image segmented objects with proposed COLOR CLUSTERING Technique (e) co lor classification scatter plot representation of the segmented pixe ls in L*a*b* color space. Scatter plot represents clusters of color pixels in the segmented image. He re various heart vessels and heart chambers are segmented from heart image.
Fig.2. a. Original Image b.Region Drew Image
https://dx.doi.org/10.22161/ijaems.5.5.8 ISSN: 2454-1311
Fig.4: Matching color Mask
Fig.5. Results of Matlab standard peppers image for two different region of interest (ROI) (a) first ROI having Delta E<=39.9 or >39.9
Fig.6. a. Original Image b.Region Drew Image
https://dx.doi.org/10.22161/ijaems.5.5.8 ISSN: 2454-1311
Fig.8. Matching color Mask
Fig.9. Results of Human Heart image (a) Original image (b)(c)(d) heart image segemnted objects with proposed COLOR CLUSTERING technique (e) color classification scatter plot represe ntation of the segmented pixels in L*a*b color space having
Delta E<=31.4 or >31.4.
VI. CONCLUSION
The approach of emp loying color clustering image segmentation using L*a*b* color space for any standard images is proposed. Color c lustering image segmentation algorith m, segments the important object informat ion fro m images. The effect iveness of the proposed method is tested by conducting two sets of e xperiments out of which one is meant for med ical images segmentation and one for standard images fro m Mat Lab software. This L* a* b* is also providing better segmentation result for all co lor images.
REFERENCES
[1] Hunter, RichardSewall (July 1948). "photoelectric color-difference meter". Josa 38 (7): 661. (Proceedings of the winter meeting of the optical society of America)
[2] Hunter, RichardSewall (December 1948). "Accuracy, precision, and stability of new photo-electric color-difference meter". Josa 38 (12): 1094. (Proceedings of the thirty -third annual meeting of the optical society of America)
[3] Brainard, David h.. (2003). "color appearance and color difference specification". In shevell, Steven k.The science of color (2 Ed.).Elsevier. p. 206.ISBN 0444512519.
[4] Fairchild, mark d. (2005). "Color and image appearance models". Color appearance models. JohnWiley and sons. p. 340. ISBN 0470012161.
[5] Hunter labs (1996). "Hunter lab color scale". Insight on color 8 9 (august 1–15, 1996). Reston, VA, USA: hunter associates laboratories.
[6] "Delta E: The Color Difference". Colorwiki.com. http://www.colorwiki.com/wiki/Delta_E:The_Color_Differen ce. Retrieved 2009-04-16.
[7] Turgay Celik, Tardi Tjahjadi,Unsupervised color image segmentation using dual-tree complexwavelet transforms,Computer Vision and Image Understanding 114 (2010) 813–826.