104
A Parametric Study of the Synthesis of Silica Nanoparticles
via Sol-Gel Precipitation Method
M. A. Dabbaghian
1, A. A. Babalou
1,2*, P. Hadi
1,2, E. Jannatdoust
1,21- Nanostructured Materials Research Center (NMRC), Sahand University of Technology (SUT),
Tabriz, I. R. IRAN
2- Institute of Polymeric Materials, Sahand University of Technology (SUT), Tabriz, I. R. IRAN
(*) Corresponding author: [email protected]
(Received: 10 Feb. 2010 and Accepted: 15 May 2010)
Abstract:
In this study, SiO2 nanoparticles were successfully synthesized via sol-gel precipitation method and the effects of different parameters such as temperature, ethanol, ammonia and tetraethylorthosilicate (TEOS) contents based on water were investigated in a systematic way applying Taguchi experimental design method. It was
found that, among all the investigated parameters, ethanol as a co-solvent, had the greatest significant effect
on the size of the synthesized silica nanoparticles, so that increasing the amount of ethanol led to initially bigger and then smaller particle size. Temperature had an inverse effect on the particle size, i.e. particle size decreased by increasing the temperature. In addition, the remaining variables, TEOS and ammonia, showed similar trends to that of ethanol in two opposing ways. This novel exploration of size distribution (SD) indicated that particle size was proportional to the SD, so that the narrowest SD was attained at the lowest particle size and vice versa.
Keywords: Sol-Gel Precipitation, SiO2, Nanoparticle, Particle Size, Size Distribution
1. INTRODUCTION
In recent years, nanoparticles have been studied intensively due to their outstanding properties that make them suitable for various applications including catalysts, humidity sensors, pigments and pharmacy [1,2]. Among numerous nanostructured materials, silica has occupied a prominent position both in scientific researches and industrial applications because of its ease of preparation and wide range of uses [3-5]. Since both size and size distribution (SD) of silica nanoparticles are crucial criteria associated with the quality of the final product, control of these factors is of great importance [6-8].
A review of the literature shows that sol-gel
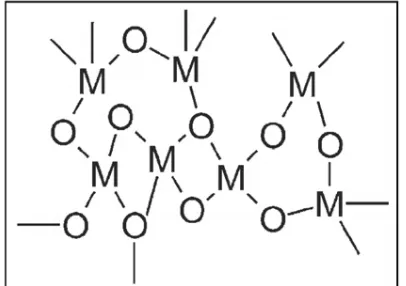
process, also known as Stöber process, has proven to be a promising method for preparing monodispersed, nanosized, spherical silica particles using tetraethylorthosilicate (TEOS) as a precursor due to its simplicity and cheapness [7,9-11]. It involves hydrolysis followed by polycondensation of the precursor under alkaline conditions [1,7,12]. Through this technique, silanol groups are produced via the former process shown by reaction (1), which acts as a substrate for reaction (2), leading to a three-dimensional cross-linked network structure as a result of the latter process due to the formation of siloxan bridges (Si-O-Si), as illustrated in Figure 1 [10,13-14].
105
Babalou
et al.
Si(OH)
4 Condensati
on→
(-Si-O-Si-)+H2O (2)Table 4. Analysis of variance (ANOVA)
Factor DOF(f) Sqrs (S) Sum of Variance(V) F- Ratio (F) Pure Sum (S’) Percent P(%) Temperature 2 19938.883 9969.441 --- 19938.883 28.16 [NH4OH]/[H2O] 2 10422.219 5211.109 --- 10422.219 14.719
[TEOS]/[H2O] 2 8338.884 4169.442 --- 8338.884 11.777
[EtOH]/[H2O] 2 32105.555 16052.777 --- 32105.555 45.343
Other/Error 0 --- --- --- --- ---
Total 8 70805.555 --- --- --- 100%
Figure 1. Three-dimensional cross-linked network structure of silica (M: Si) Figure 1: Three-dimensional cross-linked network structure of silica (M: Si)
Key parameters managing the size and SD of silica nanoparticles include concentration of the precursor, catalyst, co-solvent, water and reaction temperature [4,15-16]. In this respect, many researches have been devoted to the study of the aforementioned factors. Park et al. [6] conveniently determined the optimal synthesis conditions for nanoscale, uniform silica particles. The synthesis of monodispersed silica particles by controlled hydrolysis of TEOS was investigated by Bogush et al. [17]. Rahman et al. [7] reported an optimized synthesis of silica nanoparticles via precipitation method. To our knowledge, no systematic information has been reported on the effects of other parameters, and even in some cases, the effects are stated absolutely paradoxically. In view of this ambiguity, in the present work, silica nanoparticles were synthesized via sol-gel precipitation method and the effects of all important factors were examined employing Taguchi experimental design method. Also, due to the key role of ethanol as a
co-solvent, forming the size and SD of the synthesized silica nanoparticles and due to the shortage of information about co-solvent effect in this method, its effect has been thoroughly investigated. The main objective of this paper, therefore, is clarification of these effects and identification of the desirable size and SD of the synthesized silica nanoparticles.
2. EXPERIMENTAL
2.1. Materials
Specifications of the materials used in this work are summarized in Table 1.
2.2. Synthesis of silica nanoparticles
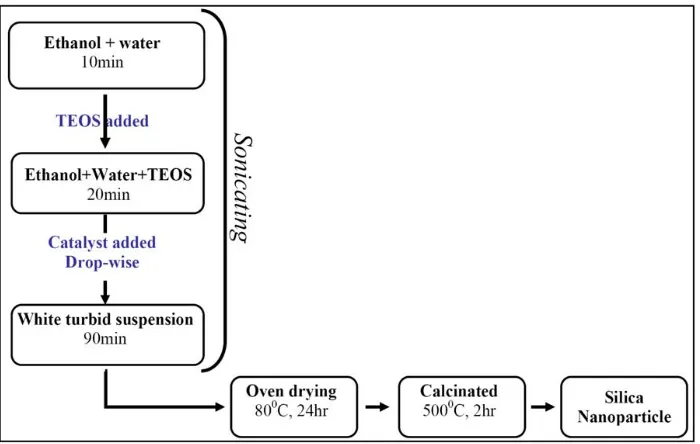
The process of silica nanoparticle synthesis, depicted in Figure 2, comprised two stages. In the first stage TEOS was introduced to a mixture of water and ethanol. It is notable that the presence of ethanol in this mixture facilitated higher solubility of TEOS in water. In the second stage, an appropriate catalyst based on the reaction environment was added drop-wise to the solution to form a gel. The whole reaction was carried out in an ultrasonic bath to avoid particle aggregation, resulting in small particle sizes and narrow SD. After the completion of these reactions, the resultant suspension was dried in an oven at 80 °C, accompanied by calcination at 500 °C.
2.3. Characterization
X-ray diffraction (XRD) measurements were carried out on a TW3710 Philips X’Pert diffractometer
equipped with a Cu-Kα (λ=1.54 Å) radiation source. The measurements were conducted in 2°-60° 2θ
range at an accelerated voltage of 30 kV and current 20 mA. The morphology was observed by scanning
Table 1: Materials used for the synthesis of silica nanoparticles
Table 1. Materials used for the synthesis of silica nanoparticles
Material Chemical structure Characteristic Company
TEOS Si(OC2H5)4 Precursor Acros Organics
Ethanol C2H5OH Co-solvent Merck
Ammonia NH3 Catalyst Merck
Water H2O Hydrolyzing agent -
Table 2. Levels of variables affecting the particle size of silica
Factor Level 1 Level 2 Level 3
Temperature 30 qC 50 qC 70 qC
[NH4OH]/[H2O] 0.5 1 2
[TEOS]/[H2O] 0.02 0.01 0.004
[EtOH]/[H2O] 0.1 0.3 0.6
Table 3. L9 orthogonal array of experiments, accompanied by the results
Trial No. Factors Results
A B C D Average Size (nm) Deviation (nm) Standard
1 1 1 1 1 20 4
2 2 2 2 2 305 38
3 1 3 3 3 210 25
4 2 1 2 3 130 11
5 2 2 3 1 40 8
6 2 3 1 2 100 10
7 3 1 3 2 65 12
8 3 2 1 3 120 10
106
electron microscopy (SEM, LEO 440I, 3×10⁵, LEO, UK) and the particle size and SD were calculated using Image-pro Express (version 6) software.
2.4. Statistical survey of silica particle size
An experimental design is generally applied to determine the dependence of a target variable, here particle size, on some other variables. The effects of four variables at three levels (Table 2) on the size of silica nanoparticles were investigated in this study. To reduce the total number of experiments, a fractional factorial design was employed. The Taguchi statistical method is well-suited to the study of a process that has many factors that need to be evaluated at several levels. An L9 (34) orthogonal array of experiments was chosen for the initial set of our experiments. This L9 array can be used, in principle, to examine the effects of four variables at
three levels in only nine experiments [18-20].
3. RESULTS AND DISCUSISONS
3.1. Characterization of the synthesized particles
Prior to the investigation of the effects of the parameters on the particle size and SD, X-ray diffraction (XRD) and SEM were conducted to verify the synthesis of nanosized silica particles through sol-gel precipitation method. A broad peak centered
at 22° two-theta (2θ), illustrated in Figure 3, is an
indication of the production of silica particles which is in good agreement with the literature [12,15]. Moreover, the amorphous nature of these particles can be vividly observed.
Also, SEM image of these particles are shown in Figure 4, which demonstrates that the spherical silica
Figure 2. Flow diagram for the synthesis of silica nanoparticles
Figure 3. XRD pattern of the synthesized silica sample
Figure 2: Flow diagram for the synthesis of silica nanoparticles
Table 1. Materials used for the synthesis of silica nanoparticles
Material Chemical structure Characteristic Company
TEOS Si(OC2H5)4 Precursor Acros Organics
Ethanol C2H5OH Co-solvent Merck
Ammonia NH3 Catalyst Merck
Water H2O Hydrolyzing agent -
Table 2. Levels of variables affecting the particle size of silica
Factor Level 1 Level 2 Level 3
Temperature 30 qC 50 qC 70 qC
[NH4OH]/[H2O] 0.5 1 2
[TEOS]/[H2O] 0.02 0.01 0.004
[EtOH]/[H2O] 0.1 0.3 0.6
Table 3. L9 orthogonal array of experiments, accompanied by the results
Trial No. Factors Results
A B C D Average Size (nm) Deviation (nm) Standard
1 1 1 1 1 20 4
2 2 2 2 2 305 38
3 1 3 3 3 210 25
4 2 1 2 3 130 11
5 2 2 3 1 40 8
6 2 3 1 2 100 10
7 3 1 3 2 65 12
8 3 2 1 3 120 10
9 3 3 3 1 25 5
Table 2: Levels of variables affecting the particle size of silica
107
Babalou
et al.
nanoparticles have been successfully synthesized via this method.
The measurement of the particle size was made using Image-pro Express (version 6) software with more than 100 particles counted. After the calibration of the software, sizes of several randomly-chosen
particles were detected, as shown in Figure 4. Figure 5 presents SD curve plotted according to the acquired data.
Figure 2. Flow diagram for the synthesis of silica nanoparticles
Figure 3.Figure 4. XRD pattern of the synthesized silica sample SEM micrograph of silica nanoparticles prepared by sol-gel precipitation method
Figure 5. SD curve plotted according to the Image-pro Express data
Figure 4. SEM micrograph of silica nanoparticles prepared by sol-gel precipitation method
Figure 5. SD curve plotted according to the Image-pro Express data
Figure 3: XRD pattern of the synthesized silica sample
Figure 4: SEM micrograph of silica nanoparticles prepared by sol-gel precipitation method
108
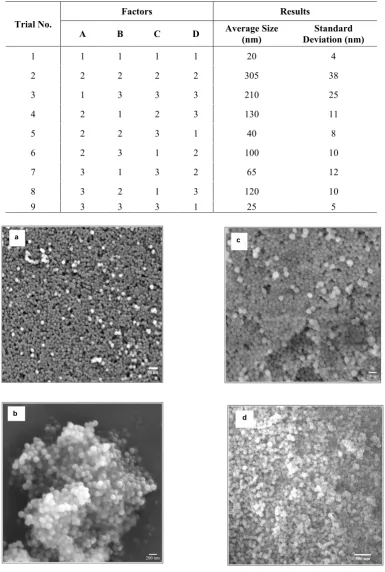
Figure 6. SEM micrographs of silica nanoparticles synthesized through: a) Trial 1 and b) Trial 4
a
b
Figure 6. SEM micrographs of silica nanoparticles synthesized through: c) Trial 6 and d) Trial 8
c
d
Figure 6. SEM micrographs of silica nanoparticles synthesized through: c) Trial 6 and d) Trial 8
c
d
Table 1. Materials used for the synthesis of silica nanoparticles
Material Chemical structure Characteristic Company
TEOS Si(OC2H5)4 Precursor Acros Organics Ethanol C2H5OH Co-solvent Merck
Ammonia NH3 Catalyst Merck
Water H2O Hydrolyzing agent -
Table 2. Levels of variables affecting the particle size of silica
Factor Level 1 Level 2 Level 3
Temperature 30 qC 50 qC 70 qC
[NH4OH]/[H2O] 0.5 1 2
[TEOS]/[H2O] 0.02 0.01 0.004 [EtOH]/[H2O] 0.1 0.3 0.6
Table 3. L9 orthogonal array of experiments, accompanied by the results
Trial No.
Factors Results
A B C D Average Size (nm) Deviation (nm) Standard
1 1 1 1 1 20 4
2 2 2 2 2 305 38
3 1 3 3 3 210 25
4 2 1 2 3 130 11
5 2 2 3 1 40 8
6 2 3 1 2 100 10
7 3 1 3 2 65 12
8 3 2 1 3 120 10
9 3 3 3 1 25 5
Table 3: L9 orthogonal array of experiments, accompanied by the results
Figure 6: SEM micrographs of silica nanoparticles synthesized through: a) Trial 1 and b) Trial 4 c) Trial 6 d) Trial 8
109
3.2. Statistical analysis of particle size and SD
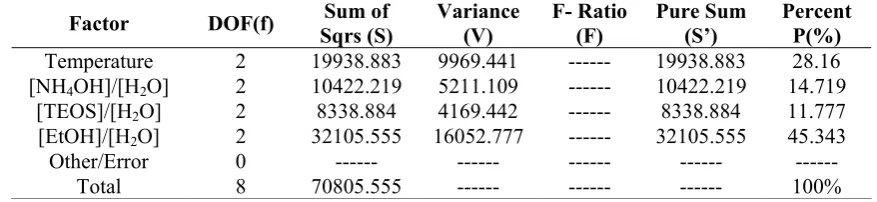
L9 orthogonal array of particle size and SD experiments for silica nanoparticles are shown in Table 3. Also, individual experimental results are included in this table according to the SEM images of the nine trials. In addition, SEM images of trials 1, 4, 6 and 8 have been presented in Figure 6. The statistical analysis of the obtained results has been carried out to identify the effect of individual variables. The statistical technique popularly known as analysis of variance (ANOVA) was used to determine the significance of each variable. The obtained ANOVA results of the particle size are set out as shown in Table 4.
The statistical analysis of the results shows that, within the selected range of variables, ethanol, as a co-solvent, has the greatest effect on the particle size of silica. Nevertheless, the study of the effects of this parameter has scarcely been dealt with in literatures [1, 5], none of which has embodied any logical justification for its behavior. However, the effects of other parameters, namely temperature, ammonia and TEOS, are not negligible and can be interpreted.
3.3. Evaluation of the variables effects on particle size
3.3.1. Effect of the co-solvent
As tabulated in Table 4, ethanol has the most significant effect on the particle size. As depicted in Figure 7(a), first, the size of silica nanoparticles increases dramatically by increasing the ethanol content, and then decreases gradually.
Such a behavior can be attributed to the gel
formation steps, hydrolysis and condensation. In the initial step, by increasing the co-solvent content, more TEOS can be hydrolyzed, leading to the generation of more sols in the reaction medium. Thus, they have more chance to collide and form gel network, resulting in large particles. But in the later step, further increase in co-solvent content causes the reaction medium to enlarge which, in turn, leads to higher spacing between the reacting agents. Therefore, the rate of condensation declines and the conversion of colloidal sol particles to gel network is interrupted. In this case, the colloidal particles have less opportunity to bind to the gel network and thus, the particle size decreases considerably [4, 13, 18]. It can be concluded that hydrolysis is the governing reaction in stage (I) of Figure 7a, whereas the controlling reaction in stage (II) is condensation. 3.3.2. Effect of the temperature
The trend of variation of particle size with reaction temperature is illustrated in Figure 7(b). As the temperature increases, the size of silica particles decreases, but at higher temperatures, the particle size tends to be rather fixed, which is in good agreement with the literature [4, 6]. Three explanation to justify such a behavior may be offered. Increasing the temperature causes decreased saturation concentration of ammonia which, in turn, results in lower dissolution of TEOS, reduction in hydrolysis reaction rate and ultimately, decreased particle size. Another feasible explanation is that ammonia evaporates partially in higher temperature, leading to the same result, as mentioned above. The third plausible justification associated with this behavior is attributed to the nucleation rate, so that rising reaction temperature increases nucleation rate and consequently the particle size is reduced.
Table 4. Analysis of variance (ANOVA)
Factor DOF(f) Sqrs (S) Sum of Variance(V) F- Ratio (F) Pure Sum (S’) Percent P(%)
Temperature 2 19938.883 9969.441 --- 19938.883 28.16
[NH4OH]/[H2O] 2 10422.219 5211.109 --- 10422.219 14.719
[TEOS]/[H2O] 2 8338.884 4169.442 --- 8338.884 11.777
[EtOH]/[H2O] 2 32105.555 16052.777 --- 32105.555 45.343
Other/Error 0 --- --- --- --- ---
Total 8 70805.555 --- --- --- 100%
Figure 1. Three-dimensional cross-linked network structure of silica (M: Si) Table 4: Analysis of variance (ANOVA)
110
3.3.3. Effect of the catalyst
Catalysts are generally used due to the slow rate of hydrolysis reaction, though the rate of condensation reaction is also influenced in higher levels of these materials [6, 7]. To date, many articles have been published regarding the catalyst effect on the particle size, but each with a paradox result [1, 2, 6, 7].
The trend of particle size with ammonia (as a catalyst) in the present work can be observed in Figure 7(c). The particle size firstly increases and then decreases by increasing the ammonia content. When the concentration of ammonia is small, its effect on the kinetics of hydrolysis reaction is more dominant [7]. Taking into account that increased rate of hydrolysis reaction results in larger particles, the concentration of ammonia can be assumed to be proportional to the particle size in lower levels of ammonia. Nevertheless, when its concentration exceeds a certain amount, kinetics of condensation reaction is more influenced, leading to the sudden condensation of the particles and thus the formation of smaller particles [16]. 3.3.4. Effect of TEOS
Figure 7(d) exhibits an unusual behavior in which particle size initially increases and then decreases with [TEOS]/[H2O] ratio. This surprising trend can be related to the presence of two counteracting mechanisms: first, raising [TEOS]/[H2O] ratio enhances the probability of the monomer addition to the network and thus particle growth. Second, when the ratio of [TEOS]/[H2O] is increased, the amount of water is decreased in the reaction medium, leading to reduced rate of hydrolysis reaction and hence, smaller particles. Initially, since the water content required for hydrolysis is sufficiently high, the former mechanism is more dominant, resulting in the increased particle size. However, when the water content tends to be lower than critical content, the latter mechanism would be dominant, so that beyond the critical content, the rate of hydrolysis is so low that the efficiency of the system, indicating conversion of the monomer, drastically decreases [7] which causes smaller particles to form.
Figure 7. Effects of a) ethanol concentration, b) temperature, c) ammonia and d) TEOS concentrations on the particle size of silica
a
b
c
d
Figure 7: Effects of a) ethanol concentration, b) temperature, c) ammonia and d) TEOS concentrations on the particle size of silica
111
Babalou
et al.
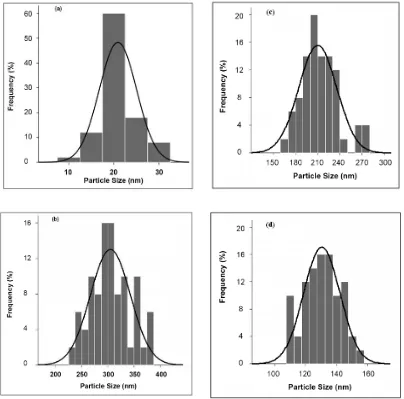
3.4. Particle size distribution (SD)
As mentioned earlier, particle size distribution and standard deviation were calculated for all trials of L9 array. As illustrated in Figure 8, all samples had relatively normal distribution, but as particle size decreased, particle size distribution became narrower, so that trial 2, with the highest particle size, exposed the broadest size distribution (see Figure 8(b)), whereas the narrowest size distribution is ascribed to trial 1 which has the lowest particle size (see Figure 8(a)).
4. CONCLUSION
Nanosized silica particles were synthesized via sol-gel precipitation process and the effects of the co-solvent, temperature, catalyst, and precursor on the particle size and size distribution were explored using Taguchi experimental design method. Based on this work, the following conclusions can be drawn:
The co-solvent effect:
•
It was found that ethanol,as a co-solvent, had the most significant effect on the particle size and size distribution of the
Figure 8. Figure 8. Particle size distribution of silica nanoparticles: a) Trial 1 and b) Trial 2 Particle size distribution of silica nanoparticles: a) Trial 1 and b) Trial 2 Figure 8: Particle size distribution of silica nanoparticles: Figure 8. Figure 8. Particle size distribution of silica nanoparticles: c) Trial 3 and d) Trial 4 Particle size distribution of silica nanoparticles: c) Trial 3 and d) Trial 4
112
Figure 8. Particle size distribution of silica nanoparticles: g) Trial 7 and h) Trial 8
Figure 8. Particle size distribution of silica nanoparticles: e) Trial 5 and f) Trial 6
Figure 8. Particle size distribution of silica nanoparticles: i) Trial 9
Figure 8:(Continued) Particle size distribution of silica nanoparticles:
e) Trial 5 f) Trial 6 g) Trial 7 h) Trial 8 i) Trial 9
113
Babalou
et al.
synthesized silica nanoparticles. whereas, no open published research has dealt with the study of this parameter profoundly and no rational explanation has been presented for its strange behavior in the literature. The reverse effect of ethanol in low and high contents is attributable to the change in hydrolysis and condensation reaction rates.
Other variables effects:
•
It was observedthat particle size decreases by increasing the temperature. The trend of particle size variation with ammonia and TEOS contents was similar to that of ethanol, so that the particle size initially increased and then decreased by increasing either of these two parameters.
Furthermore, as a novel discovery, it was surprisingly observed that the narrowest SD was acquired in the smallest particle size and the largest particle size resulted in the broadest SD.
ACKNOWLEDGMENT
The authors wish to thank Sahand University of Technology (SUT) for the financial support of this work. They are also grateful to their co-workers and technical staff in the Nanostructured Materials Research Center (NMRC) and Research Center for Polymeric Materials of SUT for their help during the various stages of this work.
REFERENCES
Rao, K. S., El-Hami, K., Kodaki, T., Matsushige,
1.
K. & Makino, K (2005) Journal of Colloid and Interface Science 289:125.
Rahman, I. A., Vejayakumaran, P., Sipaut, C. S.,
2.
Ismail, J., Abu Bakar, M., Adnan, R. & Chee, C. K. (2006) Journal of Ceramics International 32:691. Chrusciel, J. & Slusarski, L. (2003) Journal of
3.
Materials Science 21 (4):461.
KIM, K. & KIM, D.H.T. (2002) Journal of
Sol-4.
Gel Science and Technology 25:183.
Tabatabaei, S., Shukohfar, A., Aghababazadeh,
5.
R. & Mirhabibi, A. (2006) Journal of Physics: Conference, Series 26:371.
Park, S.K., Kim, K. D. & Kim, H. T. (2002) Journal
6.
of Colloids and Surfaces, A: Physicochemical and Engineering Aspects 197:7.
Rahman, I. A., Vejayakumaran, P., Sipaut, C. S.,
7.
Ismail, Abu Bakar, J. M., Adnan, R. & Chee, C. K. (2007) Journal of Colloids and Surfaces A: Physicochem. Eng 294 (1-3):102.
Jal, P. K., Sudarshan, M., Saha, Sabita Patel, A.
8.
& Mishra, B. K. (2004) Journal of Colloids and Surfaces A: Physicochem. Eng. 240:173. Tamon, H., Kitamura, T. & Okazaki, M. (1998)
9.
Journal of Colloids and Interface Science 197:353.
Chang, S. M., Lee, M. & Kim, W. S. (2005)
10.
Journal of Colloid and Interface Science 286:536.
Nocun, M., Siwulski, S., Leja, E. & ski, J. J.
11.
(2005) Journal of Optical Materials 27:1523. Yu, K., Guo, Y., Ding, X., Zhao, J. & Wang, Z.
12.
(2005) Journal of Materials Letters 59:4013. Wu, C., Wu, Y., Xu, T. & Yang, W. (2006)
13.
Journal of Non-Crystalline Solids 352:5642. Bertoncello, R., Milanese, L., Dran, J. C.,
14.
Bouquillon, A. & Sada, C. (2006) Journal of Non-Crystalline Solids 352:315.
Khoabane, K., Mokoena, E. M. & Coville, N. J.
15.
(2005) Journal of Microporous and Mesoporous Materials 83:67.
Rao, A.V. & Bhagat, S.D. (2004) Journal of
16.
Solid State Sciences 6:945.
Bogush, G. H., Tracy, M. A. & Zukoski, C. F. (1988) 17.
Journal of Non-Crystalline Solids 104 (1):95. Phadke, M. S. (1989)
18.
Quality Engineering UsingRobust Design, Prentice-Hall International, Inc., AT & Bell Laboratories: USA.
Roy, R. K. (1990) A Primer on the Taguchi
19.
Method, Van Nostrand Reinhold: New York. Hadi, P. & Babaluo, A. A. (2007) Journal of
![Figure 7(d) exhibits an unusual behavior in which particle size initially increases and then decreases with [TEOS]/[H2O] ratio](https://thumb-us.123doks.com/thumbv2/123dok_us/1317464.1639562/7.666.91.310.67.622/figure-exhibits-unusual-behavior-particle-initially-increases-decreases.webp)