Technology (IJRASET)
©IJRASET 2013: All Rights are Reserved
599
Power Level Management Using Linear Amplifier
Gain
Baljit Kaur1, Sukhwinder Kaur2
1,2
Department of Electronics and communication Engineering, PTU, Jalandhar (Punjab)
Abstract— Based on various performance techniques available for optical metro communication system, in this paper, we
compared various decibel based power amplifier eye opening diagram analysis in case of linear amplifier simulation setup.
Keywords—WSON, GMPLS, EDFA, BER, SMF
I. INTRODUCTION
Research efforts are focused on intra domain aspects. It is well known that in order to improve network scalability and manageability, a large scale network should be separated into multiple small-scale networks [1-5]. A multi domain translucent WSON with an intelligent control plane needs to be thoroughly investigated. Finally, another issue to be noted is that most of the researchers have demonstrated the feasibility and effectiveness of their methodology by either simulations or experiments using a test bed with only a control plane [6]. Despite great progress, the lack of experimental research and numerical results on an actual network test bed, especially in a multi domain scenario, limits technical deployment in real operational scenarios to a certain extent. In light of this, in this article, we present two solutions in support of the multi domain translucent WSON, along with their functional and protocol architectures. The first one is a distributed solution with a GMPLS protocol suite responsible for IA-RWA path computation; the other one is a centralized solution based on the introduction of path computation elements (PCEs) for interdomain IA-RWA [7-10]. GMPLS is responsible for topology (and resource) dissemination through its routing protocol, as well as light path provisioning through its signaling protocol. The main characteristics of each approach are presented, followed by an assessment of their overall feasibility and efficiency [11]. By using a multi domain translucent WSON test bed comprising both control and data planes. In addition, the performance of both centralized and distributed multidomain translucent WSONs is evaluated [12].
II. SIMULATIONSETUP
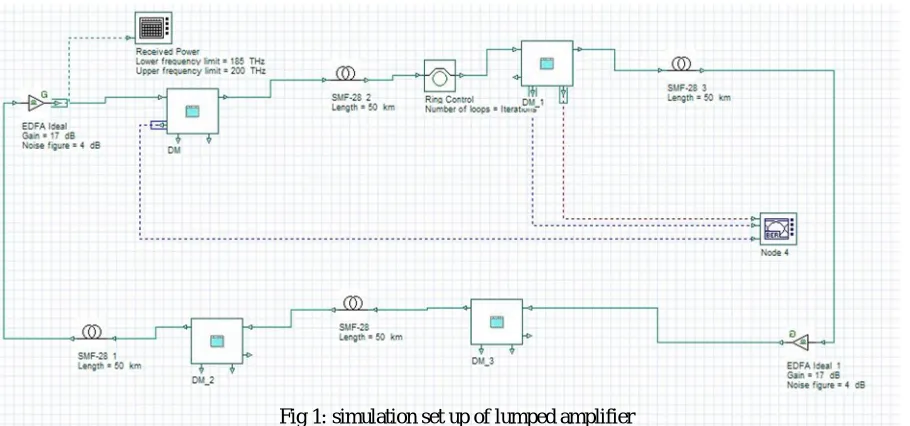
The simulation setup of power level management in metro networks-lumped amplifier operates over the length 200 km. It consists the four single mode fiber. The attenuation at the all SMF is 0.25dB/km. DM_LRE is the bi-directional process which is used for the both process transmitter and the receiver. DM-LRE Tx/Rx transmitted the data at 2.5 Gbps whose sensitivity is -23 dBm.
[image:2.612.78.533.497.710.2]
Fig 1: simulation set up of lumped amplifier
Technology (IJRASET)
©IJRASET 2013: All Rights are Reserved
600
and electro-optical conversion. The gain of amplifier is 17 dB and noise figure is 4 dB. Noise figure is the measured of the degradation of the noise figure. The iterations number of loops is used in this simulation setup for the desired results. The results are display at the BER analyser through the DM_LRE Tx/RX for 2.5 Gbps data rate. Output of optical Ring Control of 5 iterations is given to the input of DM_LRE Tx/Rx. After that output of DM_LRE Tx/Rx is attached with the input of a power amplifier of gain 53 dB and power of 10 dBm. Output of power amplifier is given to the optical fiber (SMF-28 2) which simulates propagation of optical field in single mode fiber.
III.RESULTSANDDISCUSSION
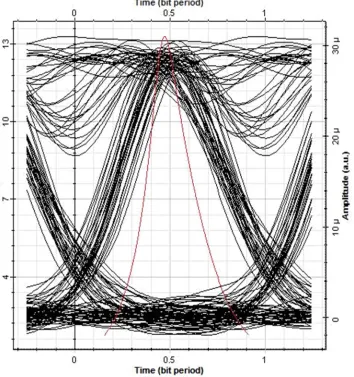
[image:3.612.144.498.207.584.2]The performance of power level management using lumped amplifier is given below showing the various results at the 10 dB values
Fig 2. Eye diagram for 10 dB power amplifier gain
Technology (IJRASET)
[image:4.612.110.464.85.536.2]©IJRASET 2013: All Rights are Reserved
601
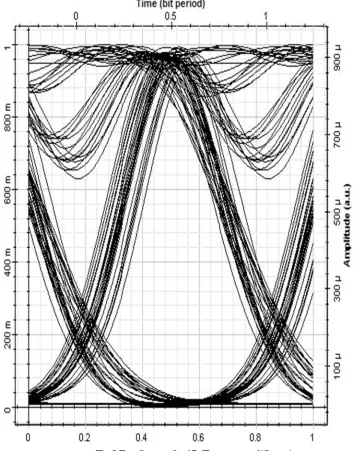
Fig 3 Eye diagram for 15 dB power amplifier gain
Technology (IJRASET)
[image:5.612.119.493.82.378.2]©IJRASET 2013: All Rights are Reserved
602
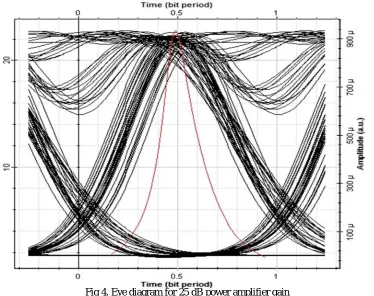
Fig 4. Eye diagram for 25 dB power amplifier gain
Optital metro network system setup is examined at different Power amplifier gain various parameters are analysed in order to obtain the best operating When the system performance was analysed up to 25 dB of optical metro network system using the linear amplifier configurations,The results obtained were not satisfactory, it introduced distortions in the signal. Fig 4 shows the eye diagram at 25 dB, the obtained eye diagram has very low signal quality and obtained jitter is also high. So the overall performance of the system was very poor. With further variation in the whole system will be done on the basis of alterations in the dB power amplifier gain values of linear amplifier gain at the different values like 35 db and the further analysis of the system would get done and on this basis the final and the suitable set up would be considered for the designing purposes.
IV.SUMMARY
Noise power and signal power values for the different power amplifier gain in dBm
S No. Power amplifier gain (dB)
Power quantities (dBm)
Min. value Max. value Total Ratio Max/min
Freq Max.
Freq min. 1 10 Signal power(dBm) -14.05 -44.13 -14.5 -44.13 193.1 193.2
Noise power (dBm)
-3.9 -43.7 -3.9 -43.7 193.2 193.1
2 15 Signal power(dBm) 0.94 -28.96 0.94 -28.96 193.1 193.2
Noise power (dBm)
11.09 -28.60 11.09 -28.60 193.2 193.1
3 25 Signal power(dBm) -14.05 -44.13 -14.5 -44.13 193.1 193.2 Noise
power (dBm)
-3.9 -43.73 -3.9 -43.73 193.2 193.1
4 35 Signal power(dBm) 0.94 -28.96 0.94 -28.96 193.1 193.2
Noise power (dBm)
Technology (IJRASET)
©IJRASET 2013: All Rights are Reserved
603
V. CONCLUSION
The metro network network system with the usage of linear amplifier in an optical domain with the alteration in the power amplifier gain at (20,30,40,50) db and with the alteration in the power amplifier gain at (10,15,25,35)) db for Lumped amplification it is superficially observed that the results taken out to be at the 50 db for linear and at the 15 db for Lumped amplification characteristics comes out to be more satisfactory with less BER high and Q-factor respectively.
REFERENCES
[1] Abilene network traffic statistics, http://www.abilene.iu.edu/. [2] Ryan, Hankin, and Kent (RHK), http://www.rhk.com/.
[3] Mukherjee, B., 2000. WDM optical communication networks: Progress and challenges, IEEE Journal on Selected Areas in Communications, 18,1810-1824. [4] Ghani, N., Dixit, S. and Wang, T. S., 2000. On IP-over-WDM integration, IEEE Communications Magazine, 38, 72-84.
[5] Banerjee, A., Drake, J., Lang, J. P., Brad, T., Kompella, K. and Rekhter, Y., 2001.Generalized multiprotocol label switching: An overview of routing and management enhancements, IEEE Communications Magazine, 39,144-150.
[6] Awduche, D. and Rekhter, Y., 2001. Multiprotocol lambda swithching: Combining MPLS traffic engineering control with optical crossconnects, IEEE Communications Magazine, 39, 111-116.
[7] Internet Engineering Task Force, http://www.ietf.org/.
[8] Wei, J. Y., 2002. Advances in the management and control of optical internet, IEEE Journal on Selected Areas in Communications, 20, 768-785. [9] Yao, S., Mukherjee, B. and Dixit, S., 2000. Advances in photonic packet switching: An overview, IEEE Communications Magazine, 38, 84-94.