COMPARATIVE STUDY OF SECTOR
BASED APPROACHES FOR
SEARCHING IMAGES BASED ON
SHAPE
Komal Asrani1
1
Department of Information Technology, B.B.D.N.I.T.M, Lucknow
Renu Jain2 2
Department of Computer Science, U.I.E.T, Kanpur
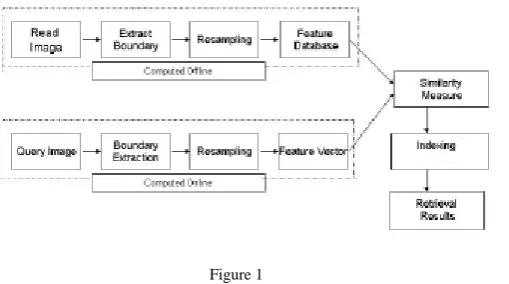
Abstract: This paper presents two approaches for shape based image retrieval. These approaches are based on pixel density. These approaches measure the similarity with no additional cost required for segmentation. The image is preprocessed and the edges are generated. Quadrant Based Sector Approach partitions the image into four quadrants and the pixel density in each quadrant. Circle Based Sector Approach partitions the image into concentric circles and identifies the pixel density in each strip. The results are compared using regression analysis.
Keywords: Feature Extraction; Image Retrieval; Shape; Sector Based Approach.
1. Introduction
The digital era is growing exponentially and the library of the digital collection which includes audio, video and images is growing proportionally. But the process of managing the huge database is worthwhile only if we are able to retrieve the contents appropriately when required. But the process of retrieval is dependent on the contents to be searched and complexity of contents. Considering images, the retrieval can be based on various aspects such as color, color layout, texture and shape. Among these aspects, shape is considered as the basic tool for image recognition as it provides the basic cue for similarity matching. To add on, human beings identify any particular image on the basis of shape. So, image retrieval based on shape has been the major issue of discussion.
To handle with the issue of retrieving images, we are looking forward for suggesting image retrieval based on shape. We focus our discussion on the problem of finding image features, which are invariant to translation and rotation. The assumption taken here is that the image is presented against a homogeneous background. This assumption is necessary because segmentation can be used for dealing with heterogeneous images or background. Nevertheless, each calculated region obtained by segmentation does not correspond to an entire object. To add on, getting detailed objects is difficult without human interventions. In this approach, the images considered are leaves of plants, which are photographed in homogeneous background. In fact, we are focusing on recognizing leaf based on its shape, which in turn would help to recognize the plant species, which is actually unlimited and vast.
alphabet recognition. Mars and Nishihara and Braddy have discussed the shape representation in detail and provided with a set of criteria for evaluation of shape. In [6] [7], shape was represented using Fourier expansion of the function of their tangent angle and their arc length. The lower order Fourier coefficients were used to represent the shape. Edge Pixel Neighborhood Information(EPNI) method employed neighborhood structure of edge pixels to make an extended feature. Although the method is scale and translation invariant but does not exhibit rotation invariance property. Abbasi et al.(1997) and Mokhtarian et al.(1996) proposed a curvature scale space(CSS) image to represent leaf shape for Chrysanthemum variety classification. Wang [8]described a method which combines different features based on centroid distance curve [9] extracts several dominant points from shape contour which are derived from the convex hull and contour curvature. Extensive work has been done for representing shape but an efficient approach which would ensure scale and rotation invariance is still an area of research. An effort is done to represent shape contour depending on the pixel density.
In general, 2D shape description can be divided into two categories: contour based and region based. Contour based retrieval only considers boundary contours of the shape whereas region based retrieval can be used to represent the complete shape in detail. This approach takes into account the actual spatial occupancy of pixels hence intrinsically global representation [1].
Shape retrieval considers three important three major issues: shape representation, shape similarity and shape indexing. Various approaches are available for representing shape, but the basic classification defines two categories: contour-based and region-based. In contour based approach, only the edges details are taken into consideration for representation of shape whereas in region based representation, all the pixels of the shape are taken into consideration. Region based approaches use moment descriptors to describe the global details of the image. Contour based approaches are more popular than region based approaches and are comparatively easy to incorporate and identifies the details of the contour of the shape but can only be used to discriminate shape only large dissimilarities. These representations are classified into global shape descriptors, shape signatures and spectral descriptors. The retrieval process computes the similarity between the similarity between query and database values which represent the image.
The organization of the paper is as follows. Section 2 details the proposed feature extraction process which briefs Image Preprocessing, representation of shape contours as feature vectors using Sector Based Approach for Retrieval. Section 3 analyses and evaluates the experimentation results. Conclusions and future work are proposed in Section 4.
2. Feature Extraction Process
2.1 Image Preprocessing:
The image, available against homogeneous background is preprocessing. The image obtained in .jpg format is processed using ImageJ. A macro has been developed in ImageJ performs three tasks. First it converts the image to binary image , then resizes by maintaining the aspect ratio and finally generates the edges or contours of the leaf. Now the edged images with clean edges are available.
Figure 1
Among various aspects used for representing shape, shape is considered as a prominent feature which is helpful for the identification of image. In our work, we are incorporating contour based approach to represent the shape. Shape is used to represent the image in the form of edges. Edges are proven to be a fundamental primitive of an image for the reservation of both semantics and perceived attributes. In our work, we have used ImageJ to extract the contours of the image. Once the edges are traced, the centroid of the contour is calculated. The centroid (xc,yc) is calculated by considering the minimum and maximum values. Thereby, the centroid (xc,yc) is taken as the reference origin point and the image is segmented to read and calculate the feature vectors.
2.2 Representation of shape contours as feature vectors using Sector Based Approach for Retrieval:
In sector based approach for retrieval, the image is split into sectors and pixel density is calculated for each sector. Two sector based approaches have been identified.
1. Quadrant Based Sector 2. Circle Based Sector
2.2.1. Quadrant Based Sector:
The approach works by splitting the image into four quadrants. The reference point used for generating the quadrants is (xc,yc), which is calculated by taking into consideration the minimum and maximum extent of the image. Thereby, each pixel is read to define its quadrant range, and hence the count of pixels in each quadrant is maintained.
2.2.2. Circle Based Sector:
In this approach, the image is split into concentric circles. The image which has been generated using ImageJ, is used as reference. The fundamental strategy of this method is to maintain the count of pixels in the strips of the concentric circles, which is used to represent the image. The strip width w is defined as
w= R N
where R is the radius of the surrounding circle of the image and N defines the number of concentric circles. The major aspect of this approach is that it is rotation invariant and also tolerate to small translations. This could be explained as that any rotation of the image with respect to a reference point, in this case (xc,yc) would always remain the same.
3. Experimental Results:
been implemented in NetBeans using Java. Recall and Precision is calculated to measure the effectiveness. Recall is defined as
ratio of number of relevant retrieved images to number of all relevant images.
Recall = Number of relevant retrieved images Number of all relevant images
Precision is defined as the ratio of number of relevant retrieved images to total number of retrieved images.
Precision = Number of relevant retrieved images Total number of retrieved images
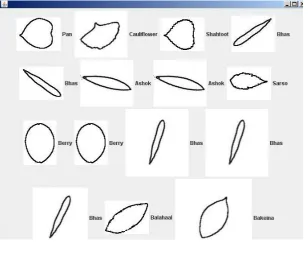
Figure 2 shows the snapshot of the collection of leaves taken for performing experiment using Quadrant Based Sector and Circle Based Sector.
Figure 2
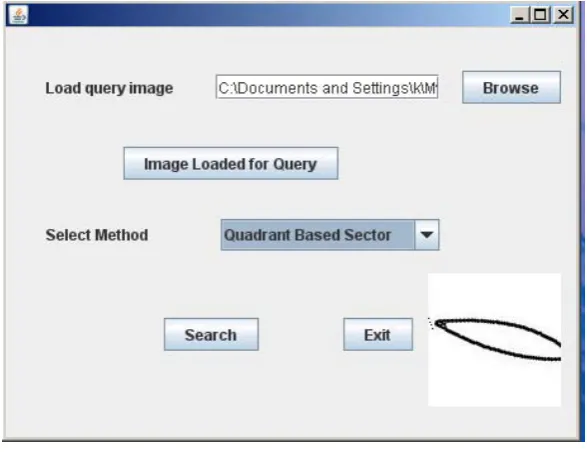
Quadrant Based Sector Approach: Figure 3 shows the User Interface for taking input about location of image in the file system for execution of query using Quadrant Based Sector approach in NetBeans:
Figure 4 shows the snapshot of results generated against executed search query using Quadrant based sector approach. The results are presented in descending order in terms of similar or ascending order in terms of distance.
Figure 4
Likewise seven other search queries have been executed and the results in the form of recall and precision percent is calculated and is given in Table 1.
Quadrant Based Sector Recall(%) Precision(%)
54 39 67 52 34 25 84 38 46 23 25 10 46 38
Table 1
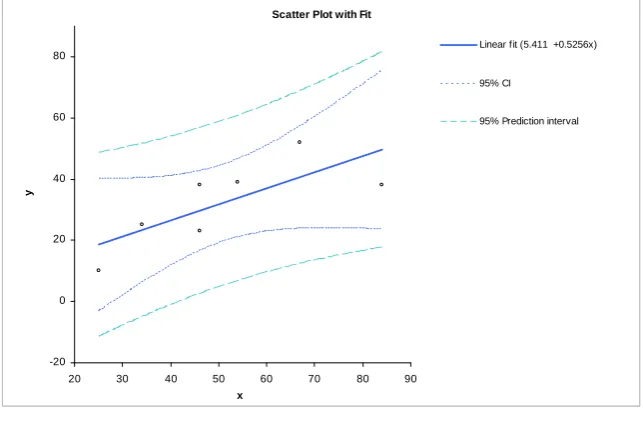
Regression analysis is done with Recall along x-axis and Precision along y-axis whose interpretations are presented in Table 2.
Coefficient of Determination=0.58 Standard error=9.8
n 7
R2 0.58
Adjusted
R2 0.49
SE 9.8
Term
Coeffici
ent 95% CI SE
t
statistic DF p
Intercept
5.411 -22.587 to
33.408 10.8915 0.50 5 0.6404
Slope
0.5256 0.0079 to
1.0433 0.20139 2.61 5 0.0477
y = 5.411 + 0.5256x
Source of variation
Sum
squares DF Mean square
F
statistic p
Model 654.5 1 654.5 6.81 0.0477
Residual 480.4 5 96.1
Total 1134.9 6
Table 2
Statistical analysis in the form of scatter plot with fit (Figure 5) and residual plot (Figure 6) is generated.
Scatter Plot with Fit
-20 0 20 40 60 80
20 30 40 50 60 70 80 90
x
y
Linear fit (5.411 +0.5256x)
95% CI
95% Prediction interval
Residual Plot
-15 -10 -5 0 5 10 15
20 30 40 50 60 70 80 90
x
R
esi
d
u
al
Figure 6
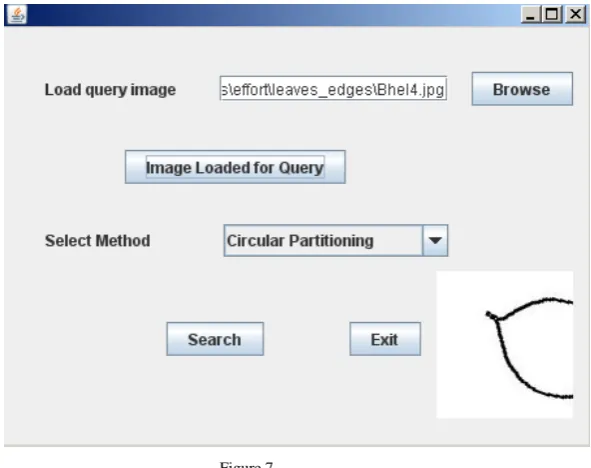
Circular Based Sector approach: Figure 7 shows the User Interface for taking input about location of image in the file system for execution of query using Circular Based Sector approach in NetBeans:
Figure 7
Figure 8
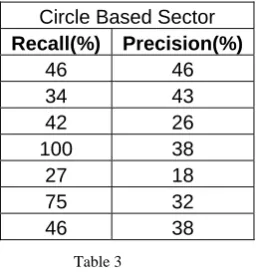
The search results for seven queries is presented in Table 3.
Circle Based Sector Recall(%) Precision(%)
46 46 34 43 42 26 100 38
27 18 75 32 46 38
Table 3
Regression analysis is done and the results are generated in Table 4 with recall along x axis and precision along y axis.
Coefficient of Determination=0.06 Standard error=10.4.
Goodness of linear fit=-0.13
N 7
R2 0.06
Adjusted R2 -0.13
SE 10.4
Term Coefficient 95% CI SE
t statis
tic DF p
Slope 0.09254
-0.33489 To .5199 0.16627 0.56 5 0.6018
y = 29.54 + 0.09254x
Table 4
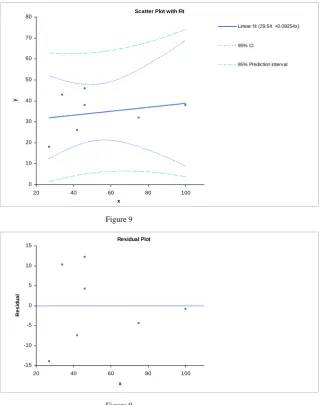
Statistical analysis in the form of scatter plot with fit(Figure 9) and residual plot (Figure 10) is generated.
Scatter Plot with Fit
0 10 20 30 40 50 60 70 80
20 40 60 80 100
x
y
Linear fit (29.54 +0.09254x)
95% CI
95% Prediction interval
Figure 9 Residual Plot -15 -10 -5 0 5 10 15
20 40 60 80 100
x R esi d u al Figure 9 4. Conclusions:
We interpret that the goodness of linear fit in Quadrant Based Sector approach is found be significantly better than Circle Based Sector Approach. Referring the residual plotting, it is observed that the runs of residuals are more scattered in Circle Based Sector Approach as compared to Quadrant Based Sector Approach. The F statistic value of Quadrant Based Sector Approach is much higher than Circle Based Sector Approach which indicates that the proportional increase in error of fitting a mean model versus linear model is high in Quadrant Based Sector Approach than in Circle Based Sector Approach. The probability of ensuring a linear fit than mean is higher in Circle Based Sector Approach than in Quadrant Based Sector Approach.
Source of variation Sum squares DF
Mean square
F
statistic p
Model 33.8 1 33.8 0.31 0.6018
Residual 545.9 5 109.2
From the above results, we conclude that the methods studied can be used to generate much better results provided the number of images in database for each kind of leaf is increased. Further, the number of queries required to be executed should be at least 100 or more to understand the effectiveness of the methods. Besides, with just maintaining the details of pixel density, additional information like tangential angle, deviation with respect to last reference point, distance from centroid needs to be incorporated to provide better results.
References:
[1] S. Loncaric, “A Survey of Shape Analysis Techniques” Pattern Recognition, vol. 34, no.8,pp. 983-1001, August 1998. [2] C. Carson, S.B.Elongie, H. Greenspan and J.Malik, “Blobworld: image segmentation using expectation-maximization”
[3] F. Mokhatrian, “Silhouette-based isolated object recognition through curvature scale space,” IEEE Trans. On Pattern Analysis and Machine Intelligence, vol 17, no.5, pp 539-544, May 1995.
[4] E.Petralis, A.Diplaros and E.Millios “Matching and Retrieval of distorted and Occluded Shapes using Dynamic Programming,” IEEE Trans. On Pattern Analysis and Machine Intelligence, vol . ,no.11,pp.1501-1516, November 2002.
[5] A.W. Smeulders, M.Worring, S.Santini, A.Gupta and R.Jai, “Content –Based Image Retrieval at the End of the Early Years,” IEEE Trans. On Pattern Analysis and Machine Intelligence, vol .23,no.12,pp. 1349-1380, December 2000.
[6] Jain A.K and Vailaya A. “Image retrieval using shape and color” 2nd Asian Conference on Computer Vision, vol 2, Pages 529-533 Dec 95, Singapore.
[7] Peter J. van Otterloo A contour-oriented approach to Shape Analysis, Prentice Hall International (UK) Ltd. C1991.
[8] Z. Wang, Z. Chi and D. Feng “Shape Based Leaf Image Retrieval” in IEEE Proc.- Vis. Image Signal Process, vol 150, Feb 2003. [9] H.H.H.Ip, A.k.Y. Cheng, W.Y.F. Wang and J.Feng “Invariant Sketch Based Retrieval of Images” in Proc. IEEE International