Available online at http://www.ijabbr.com Volume 1, Issue 1 (March, 2013), PP 11-17
Corresponding Author : Maziar haidari, E-mail: [email protected] 11 | Page
Evaluation of different sampling method to study of tree density
(tree/hectare) in the Zagros forest
Maziar Haidari *1, Manocher Namiranian 2, Mahmood Zobeiri 2 and Loghman Ghahramany 3
1
M. Sc. Graduate of forestry, Department of forestry, University of Tehran, Karaj, I. R. Iran
2 Professor of forestry, Faculty of Natural Resources, University of Tehran, karaj, I. R. Iran 3
Assistant professor of forestry, Faculty of Natural Resources, University of Kurdistan, Sanandaj, I. R. Iran
ABSTRACT
For maintaining of Zagros forests role in wild life, water and soil conservation, the suitable solutions and methods for assessing the existing conditions and planning for management of this forests should be given. To detection of suitable sampling method to study tree density in the northern Zagros forest, Blake forest, in Baneeh region, Kurdistan province, and west of Iran was selected. 40 square sample plots one hectare (100×100 m) were selected and perfect inventoried. In every sample plot the position of tree, kind of species and number of species were recorded. In order to study of tree density (tree/ha) different sampling methods (rectangular sample with 20×50 m and 10×50, random sampling method with 40, 50 and 60 circle sample plots which everyone was 1000 m2) compered the prefect inventory. To determination of suitable sampling for study of tree density used the %E2 ×T indexes. To compere the tree parameter in the every sampling methods and perfect inventory used the t-test analysis. Data analyzing was done by SPSS16 software’s. Results showed that the rectangular sample with 20×50 m sample methods was the best methods and have maximum of accuracy. Overall results showed that the rectangular sample with 20×50 m sampling methods was (have minimum of time and %E2×T criteria) the suitable methods to study of density (tree/ hectare). Authors suggested to study of tree density (tree/hectare) in the northern zagros forest used the rectangular sample with 20×50 m sampling methods.
Key words: Kurdestan province, Sample methods, Tree density northern zagros forest INTRODUCTION
12 | Page Precision and Cost. Parameters evaluated were number per hectare, crown cover and basal area. Results showed that random-systematic sampling with circle shape plots is of less error than transect method in all cases (Nimvari et al, 2002) researcher determination of the most appropriate transect length for estimation of quantitative characteristics in Zagros forests and results showed that transects with 140m length had the most precision for estimating the above-mentioned parameters (Naghavi et al, 2009). The researcher Comparison of circular plot and transect sampling methods in the Zagros Oak Forests, for this purpose and based on cost and precision (E%2 × T) criterion. Results showed that the more suitable method for these forests in west of Iran is the circular sample plot with 1000m2 area (Heidari et al, 2009). The researcher study of vertical and horizontal forest structure in Northern Zagros Forest and results showed that Overall results showed Blake forest was two forest story and Quercus libani Oliv and Quercus infectoria Oliv were the most dominant woody plants and located in over story (Haidari et al, 2013). The aim of our study was comparing the accuracy and precision of several of the sampling methods to study of tree diversity and tree parameters in northern zagros forest.
MATERIAL AND METHOD
Site description
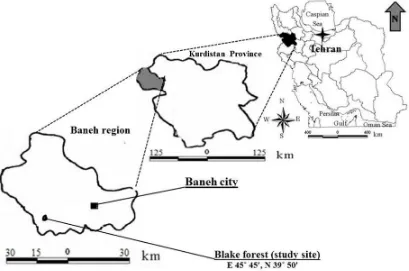
This research was investigated in the Baneh region, northern Zagros forest, and western Iranian state of Kurdistan (Figure 1). Blake Village is located in west of Baneh city and 40 (600×675 meter) hectare of conventional territory of this village was selected (Haidari, 2011).
13 | Page Analysis
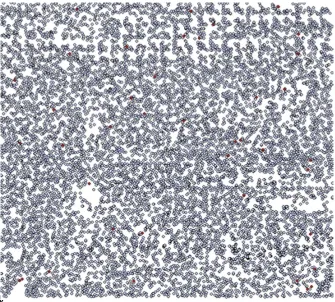
In this study 40 square sample plots one hectare (100×100 m) were selected and perfect inventoried (Figure 2) and in every sample plot the position of tree, kind of species and density were recorded.
Figure 2: dispersion of tree in the study area (600×675 m)
14 | Page Compere the different sampling methods by used the accuracy and costs index:
After the statistical analysis and detected of significant and non-significant different between sampling methods use the compering the accuracy and costs index in the base of below formula:
T × %E2 A=
T: total time of sampling E: Standard error
Each of sampling methods was lowest A (%E2× T) index is suitable sampling methods. Data analyzing was done by SPSS16 software’s.
RESULT AND DISCUSSION
Results of perfect inventory showed that five tree and shrub species observed in the study area. Species in the study area include the Quercus libani Oliv, Quercus infectoria Oliv, Acer monspesolanum L, Pistacia atlantica Desf, Crataegus sp and Pronus sp. Quercus libani Oliv was the most dominant tree and shrub plants.
Table 1. List of Shrub species in the studied areas
no Scientific name Family
1 Quercus libani Oliv. Fagaceae
2 Quercus infectoria Oliv. Fagaceae
3 Acer monspesolanum L. Aceraceae
4 Pistacia atlantica Desf. Anacardiaceae
5 Crataegus sp. Rosaceae
6 Pronus sp. Rosaceae
The shrub species belonged to four families were identified in the study area (Table 1) thus for the classes of rosacea, Fagaceae, Anacardiaceae and Aceraceae, two, two, one and one species were existed, respectively.
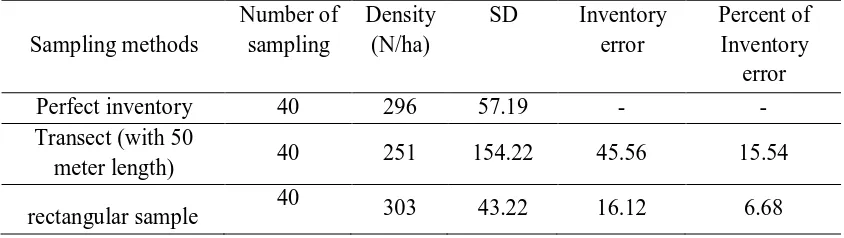
Table 2: results of density (tree/hectare) in the different sampling methods
Sampling methods
Number of sampling
Density (N/ha)
SD Inventory error
Percent of Inventory
error
Perfect inventory 40 296 57.19 - -
Transect (with 50
meter length) 40 251 154.22 45.56 15.54
15 | Page with 20 m×50
rectangular sample with 10 m×50m
40 305 65.33 32.12 8.56
random method with 40 sample
40 322 134.32 44.23 17.24
random method with
50 sample 40 319 120.54 35.34 14.23
random method with
60 sample 40 333 69.81 22.34 11.22
Table 2 showed that the rectangular sample with (20 ×50m) and (10 ×50m) have a maximum of accuracy, minimum of inventory error and nearest of density (tree/ha) in compere of real quantity (Perfect inventory). These sampling methods are suitable methods for study of tree density.
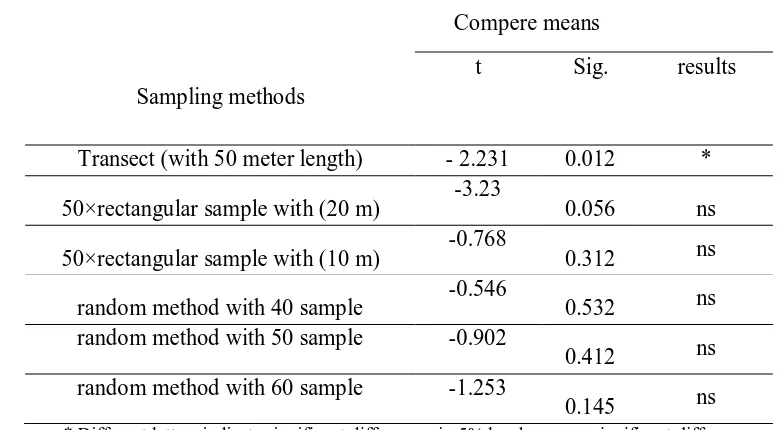
Table 3: results of t-test analysis to study of density (tree/hectare) Compere means
Sampling methods
t Sig. results
Transect (with 50 meter length) - 2.231 0.012 * rectangular sample with (20 m)
×
50 -3.23 0.056 ns
rectangular sample with (10 m) ×
50 -0.768 0.312 ns
random method with 40 sample -0.546 0.532 ns random method with 50 sample -0.902
0.412 ns
random method with 60 sample -1.253
0.145 ns
* Different letters indicate significant differences in 5% level ns. no significant differen
t
Results of table 3 showed that transect (with 50 meter length) is significant different from real quality (perfect inventory) and deleted in continues of study. Others sampling methods no significant different from real quality and was suitable sampling methods.
Table 4: compering of the accuracy and cost between different sampling methods to study the tree density (tree/ha)
Sampling methods
time of sampling (minute)
percent of Inventory
error
T × %E2
suitable sampling method
16 | Page rectangular sample with 50
m × 20
542 6.68 3621 First
rectangular sample with
50 m × 10
452 8.56 3869 Second
random method with 40
sample 600 17.24 10344 fifth
random method with 50 sample
720 14.23 10246 fourth
random method with 60 sample
860 11.22 9649 tertiary
Results of table 4 showed that by used the (T × %E2) criteria best suitable sampling was rectangular sample with 20 m×50methods. Collection of appropriate qualitative, quantitative and diversity data is necessary for proper management and planning (Naghavi et al, 2009). For maintaining of Zagros forests role in wild life, water and soil conservation, the suitable solutions and methods for assessing the existing conditions and planning for management of this forests should be given (Karamshahi et al, 2012). To determine a suitable method, based on precision and cost, of inventory in Western oak forests (Nimvari et al, 2002). rectangular sample with 20×50 m and 10×50 in the 100× 100 m net, random sampling method with 40, 50 and 60 circle sample plots which everyone was 1000 m2 and Transect (with 100 meter length in the 100× 100 m net, and this sampling methods compared with perfect inventory. The tree and shrub species that identified in the studied region belonged to six trees and shrub species in four families. The presence of six tree and shrub species in 40 ha area indicates not considerable diversity in the study area (table 1). Rosacae family had high number of species (table 2). Quercus libani Oliv was the most dominant woody plants for the class of tree. Table 2 showed that the rectangular sample with (20 ×50m) and (10 ×50m) have a maximum of accuracy, minimum of inventory error and nearest of density (tree/ha) in compere of real quantity (Perfect inventory). These sampling methods are suitable methods for study of tree density. Results showed that the rectangular sample with (20 ×50m) and (10 ×50m) have a maximum of accuracy, minimum of inventory error and nearest of density (tree/ha) in compere of real quantity (Perfect inventory). These sampling methods are suitable methods for study of tree density (table 2). After the statistical analysis and detected of significant and non-significant different between sampling methods use the compering the accuracy and costs index (%E2× T) to determination suitable sampling methods. Results showed that by used the (T × %E2) criteria best suitable sampling was rectangular sample with 20 m×50methods (table 4). Overall results showed that the rectangular sample with 20 m×50m sampling methods were the suitable methods was suitable to study of density (tree/ha) and Heidari et al, 2009 emphasis this this results. Authors suggested to study of tree density (tree/hectare) in the northern zagros forest used the rectangular sample with 20 m×50m sampling methods.
CONCLUSION
17 | Page Acknowledgements
We thank Mr. Esmaei Khosropour, Sorosh Zabiholahii and Sasan Vafaei for their help in the field and we thank Mr. Rahmat Namdari and Mr. Khabat Janati for their help in the analysis of data.
REFERENCES
Heidari R.H, Zobeiri M, Namiranian M, Sobhani H, 2009. Comparison of circular plot and transect sampling methods in the Zagros Oak Forests (Case study: Educational and research forest of Razi University, Kermanshah province). Iranian Journal of Forest and Poplar Research, 17(3):358-368.
Haidari M, Shabanian N, Haidari R.H, Bazyar M, 2012. Structural diversity of oak forests in Kurdistan Province (Case study: Oak forest), IOSR Journal of Pharmacy and Biological Sciences (IOSR-JPBS), 4(3): 37-43.
Haidari M, Jalilvand H, Haidari R.H, Shabanian N, 2012. Study of Plant Biodiversity in Grazed and Non-grazed Areas in the Iran-o-Turanian Ecological Zones (Case Study: Yazd Province, IRAN), Annals of Biological Research, 3 (11):5019-5027.
Hosseini S.A. O, Haidari M, Shabanian N, Haidari R.H, Fathizadeh O, 2012. The impact of single selection method logging on the tree and shrub diversity in the Hyrcanian forests, European Journal of Experimental Biology, 2 (6):2229-2237.
Haidari M, Namiranian M, Gahramani L, Zobeiri M, Shabanian N, 2013. Study of vertical and horizontal forest structure in Northern Zagros Forest (Case study: West of Iran, Oak forest), European Journal of Experimental Biology, 3(1):268-278.
Karamshahi A, Zobeiri M, Namiranian M, Feghhi J, 2012. Investigation on application of k-nn (k- nearest neighbor) sampling method in Zagros forests (Case study: Karzan forest, Ilam), Iranian Journal of Forest and Poplar Research, 19(4): 452-465.
Magurran, A.E. (1988). Ecological Diversity and its Measurement. Princeton University Press, Princeton, U.S.A.
Naghavi H, Fallah A, Jalilvand H, Soosani J, 2009. Determinations of the most appropriate transect length for estimation of quantitative characteristics in Zagros forests, Iranian Journal of Forest, 1(3): 228-238.
Nimvari J.E, Zobeiri M, Sobhani H, Zangeneh H. P, 2002. A Comparison of Randomized-Systematic Sampling with Circle Shape Plot and Transect Method, Based on Precision and Cost, (Case Study in Sorkhedizeh of Kermanshah, Iranian Journal of Forest and Poplar Research, 12(2):122-134.
Pourbabaei H; Navgran S, 2011. Study on floristic and plant species diversity in the Lebanon oak (Quercus libani) site, Chenareh, Marivan, Kordestan Province, western Iran Biocenose Journal, 3 (1), 15-22.