Research Article
Modeling Material Flow Behavior during Hot Deformation
Based on Metamodeling Methods
Gang Xiao,
1,2Qinwen Yang,
2Luoxing Li,
1,2and Zhengbing Xu
31State Key Laboratory of Advanced Design and Manufacturing for Vehicle Body, Hunan University, Changsha 410082, China 2College of Mechanical and Vehicle Engineering, Hunan University, Changsha 410082, China
3Key Laboratory of Nonferrous Materials and New Processing Technology of Ministry of Education of China, Guangxi University, Nanning 530004, China
Correspondence should be addressed to Luoxing Li; [email protected] Received 27 July 2015; Accepted 30 August 2015
Academic Editor: Mohsen Asle Zaeem
Copyright © 2015 Gang Xiao et al. This is an open access article distributed under the Creative Commons Attribution License, which permits unrestricted use, distribution, and reproduction in any medium, provided the original work is properly cited. Modeling material flow behavior is an essential step to design and optimize the forming process. In this context, four popular metamodel types Kriging, radial basis function, multivariate polynomial, and artificial neural network are investigated as potential methods for modeling the flow behavior of 6013 aluminum alloy. Based on the experimental data from hot compression tests, the modeling performance of these four methods was tested and subsequently compared from different aspects. It is found that all the methods are capable of constructing models for describing the hot deformation behavior. The merits of Kriging method over other three methods are highlighted when the sample size for modeling is decreased. Furthermore, the applicability of Kriging method is validated while decreasing the sample uniformity with respect to temperature or strain rate. It is proved that Kriging method is competent in modeling the material flow behavior and is the most effective one among the four popular types of metamodeling method.
1. Introduction
Hot forming technology of materials is widely applied in practical manufacturing. In order to achieve the required microstructure and mechanical property of products, the design and optimization of thermomechanical process
parameters have to be properly implemented [1, 2]. For
this reason, the designers strive to study the effect of the parameters with respect to the kinetics of the metallurgical deformation. The flow behavior of materials is compactly affected by the factors of temperature, strain rate, and strain [3]. For exploring and describing the hot deformation behavior, many research groups have made use of regression method to establish the phenomenological and physically based constitutive models [4–6], which would be committed to provide a complete mathematical description of the flow stress. Lin et al. [5] developed a new phenomenological model for describing high-temperature flow behavior of inconel 718 superalloy. Saadatkia et al. [6] developed a physically based model of low and medium carbon steels to investigate the
deformation behaviors. However, the deformation behavior of metal at elevated temperature is always associated with various metallurgical phenomena and thereby complicated in nature [7], such as work hardening, dynamic recovery, dynamic recrystallization, and flow instabilities. The effects of these factors on flow stress are so complex that the relation-ship among them is highly nonlinear. It can be found that the physical procedure is difficult to be systematically interpreted by the conventional constitutive model [8], which would reduce the prediction accuracy and limit the application range. Moreover, the development of modeling flow behavior in the conventional way is usually time-consuming and relies on amounts of experimental data.
Considering the disadvantages of the abovementioned method, artificial neural network (ANN) method is gradually utilized as an alternative approach for modeling material flow behavior to improve processing scheme [8–10]. In essence, ANN is one type of metamodeling method which can get rid of the constraints from describing physical mechanisms. Metamodeling method is widely accepted as a valuable
Volume 2015, Article ID 157892, 8 pages http://dx.doi.org/10.1155/2015/157892
and efficient technique to model various complex nonlinear relationships. In previous researches [11], some other types of metamodeling method were maturely developed, such as Kriging, radial basis function (RBF), and multivariate polynomial method. Each metamodel type has its associated fitting method and the corresponding characteristics [12]. Due to the complicated nature of the relationships between metamodeling methods and engineering problems, there is no conclusion on which method is definitely superior to the others [11]. In order to investigate the applicability of meta-modeling methods and search for the most appropriate one in modeling flow behavior, the four popular methods Kriging, RBF, multivariate polynomial, and ANN were utilized and compared for modeling the flow stress of 6013 aluminum alloy during hot compression.
In this work, the hot plane strain compression tests were carried out on Gleeble-3500 thermomechanical simulator. Considering deformation heating and heat transfer, the measured flow stress data at relatively high strain rates were corrected. Based on the measured and corrected data, the feasibility of these methods is firstly tested in modeling the flow behavior. The most effective modeling method with satisfactory accuracy, stability, and efficiency was then selected on the basis of comparative study and detailed analysis. Finally, the performance of Kriging method that is considered as the best one was further assessed for this modeling process.
2. Metamodeling Methods
2.1. Kriging Method. After being proposed by Krige [13] and improved by others such as Matheron [14], Kriging method was gradually developed to be a popular metamodel type and systematically introduced into the area of computer experiment [15]. In Kriging method, the random output is assumed to be obtained from a linear combination of regression functions plus a random process factor as follows:
𝑌 =∑𝑁 𝑗=1
𝛽𝑗𝑓𝑗(x) + 𝑍 (x) , (1)
where 𝑁 is the number of regression functions,𝑓𝑗(⋅) is a
regression function, 𝛽𝑗 is the coefficient for 𝑓𝑗(⋅), x is the
design point, and𝑍(⋅)is the random process function. The
correlation function is defined by the following equation: Cov(𝑍 (x1) , 𝑍 (x2)) = 𝑟 (𝜃,x1,x2) , (2)
where Cov(⋅)is the correlation function,x1 andx2 are two
design points, and𝜃is a structural parameter to be optimized.
The correlation function could be defined in several different ways such as Gaussian, exponential, linear, spherical, and cubical [16].
2.2. Radial Basis Function Method. Radial basis function (RBF) method was initially developed as an exact interpo-lation technique for data in multidimensional space [17]. In
RBF method, a series of center points (x𝑗1,x𝑗2, . . . ,x𝑗𝑚) are
chosen first from the design points (x1,x2, . . . ,x𝑛) based on
some criteria. Then the basis functions are constructed by using these center points as
𝐵𝑖(x) = 𝑓 (x−x𝑗𝑖) , (3)
wherex is the design point, x𝑗𝑖is the center point for𝐵𝑖(⋅),
and‖x−x𝑗𝑖‖is the Euclidian distance between the two points.
The function𝑓(‖⋅‖)could have different forms such as linear,
Gaussian, cubic, thin-plate, spline, and multiquadratic [17]. The relationship between inputs and outputs is constructed as a linear combination of radial basis functions:
̂𝑔(x) = 𝛽0+∑𝑁 𝑗=1
𝐵𝑗(x) 𝛽𝑗, (4)
wherê𝑔is the estimated output value,𝐵𝑗(⋅)is a basis function,
𝛽0is a constant, and𝛽𝑗is the coefficient for𝐵𝑗(⋅).
2.3. Multivariate Polynomial Method. Multivariate polyno-mial method is one of the most fundamental metamodeling methods used in computer experiment. It is mostly known from response surface method [18], which employs quadratic polynomial in the field of engineering design optimization. In multivariate polynomial method, basis functions are
built directly by using input variable components (x =
[𝑥1, 𝑥2, . . . , 𝑥𝑛]) and their interactions such as
𝐵0(𝑥) = 1, 𝐵1(𝑥) = 𝑥1, . . . , 𝐵𝑛(𝑥) = 𝑥𝑛 𝐵11(𝑥) = 𝑥2
1, 𝐵12(𝑥) = 𝑥1𝑥2, . . . , 𝐵1𝑛(𝑥) = 𝑥1𝑥𝑛
... (5)
A multivariate polynomial is constructed as the weighted sum of these basis functions:
̂𝑔(x) = 𝑏0+ 𝑁 ∑ 𝑗=1
𝐵𝑗(x) 𝑏𝑗, (6)
wherê𝑔is the estimated output value,𝐵𝑗(⋅)is a basis function,
𝑏0is a constant, and𝑏𝑗is the coefficient for𝐵𝑗(⋅).
2.4. Artificial Neural Network Method. Artificial neural net-work (ANN) method is based on a particular set of nonlinear functions to build the relationship between inputs and out-puts. Its architecture consists of input layer, output layer, and hidden layer, which are connected by the processing units
called neurons [19], as shown in Figure 1. Each neuron in
the input layer and output layer represents one independent variable, while the neurons in the hidden layers are only for computation purpose. During training procedure, the known input-output pairs are used to update the weights and biases [20]. The objective is to minimize the errors between the ANN outputs and the targets for the corresponding inputs.
3. Model Construction and Discussion
3.1. Experiments and Modeling Preparation. The material used in the present experiment is 6013 aluminum alloy, with
Input 1 Input 2 Input 3 Output ... ...
Figure 1: The architecture of the ANN model.
T emp er at u re T (K) Water quenching Time t (s) 120s 10K/s 613∼773K
Figure 2: Experimental procedure for the compression tests.
Table 1: Experimental conditions.
Level 1 2 3 4 5
Temperature (K) 613 653 693 733 773
Strain rate (s−1) 0.001 0.01 0.1 1 10
a nominal composition of 0.95% Mg, 0.75% Si, 0.9% Cu, and 0.35% Mn (mass fraction). The cubic specimens with a size
of 20 mm×15 mm×10 mm were prepared for testing. The
hot plane strain compression tests were carried out 25 times using Gleeble-3500 thermomechanical simulator at different
temperatures and strain rates (listed inTable 1). All specimens
were heated to the preset deformation temperature at a rate of 10 K/s and held for 120 s to eliminate thermal gradient. The specimens were compressed to a true strain of 0.8 and cooled down to room temperature in water. The experimental
procedure is explained inFigure 2.
It is widely accepted that the flow stress data measured directly from tests at relatively high strain rates are always affected by instantaneous temperature rise during
defor-mation [21, 22]. According to the previous work of the
authors [23], the temperature rise during hot plane strain compression depends on deformation heating integrated with heat transfer which does occur among the deformed region, the undeformed region, and the press indenter. This type of temperature rise considering deformation heating and heat transfer has been quantitatively described by a proposed model in this literature. Based on the published work, the
measured flow stress data at strain rates of 10 and 1 s−1 are
Kriging RBF Polynomial
ANN Temperature, T
Strain, 𝜀 Flow stress , 𝜎
Strain rate, 𝜀̇
Figure 3: Schematic of modeling flow behavior.
corrected and then used for comparison and analysis of different modeling methods in this paper.
Based on the 25 experimental (including measured and corrected) flow stress curves, the true stress data correspond-ing to the true strain between 0.05 and 0.8 with the interval of 0.05 were adopted to construct models and test their performance. It can be found that a total of 400 sample points are located on the 25 curves which are considered as 25 cases in the modeling and testing processes. These data will be divided into training and testing datasets according to the requirements in different sections of this paper.
The schematic of modeling the flow behavior of 6013
aluminum alloy is shown inFigure 3. The inputs of the model
are temperature (𝑇), strain rate ( ), and strain (̇𝜀 𝜀) whereas
flow stress (𝜎) is the output. In addition, the parameters
of temperature and strain rate are processed by natural logarithm.
3.2. Model Construction and Applicability Assessment. The feasibility of metamodeling methods for modeling the flow behavior is investigated in this section. Three cases with totally different temperatures and strain rates are successively
selected for model testing, as shown in Table 2. In each
testing process, 24 cases (excluding the testing one) are utilized for model training based on the schematic given in
Figure 3. The average (𝛿ave) and the maximum (𝛿max) values
of absolute relative errors (𝛿) from each testing are employed
as quantitative criteria to evaluate the performance of models and the applicability of modeling methods:
𝛿 =𝐸 − 𝑃 𝐸 × 100% 𝛿ave= 1 𝑁 𝑁 ∑ 𝑖=1 𝛿𝑖× 100%, (7)
where𝐸is the experimental value,𝑃is the predicted value,
and𝑁is the number of testing points.
As shown in Table 2, the detailed information on 𝛿ave
and 𝛿max from the developed models is provided. Except
few specific conditions, the values of𝛿are all less than 10%.
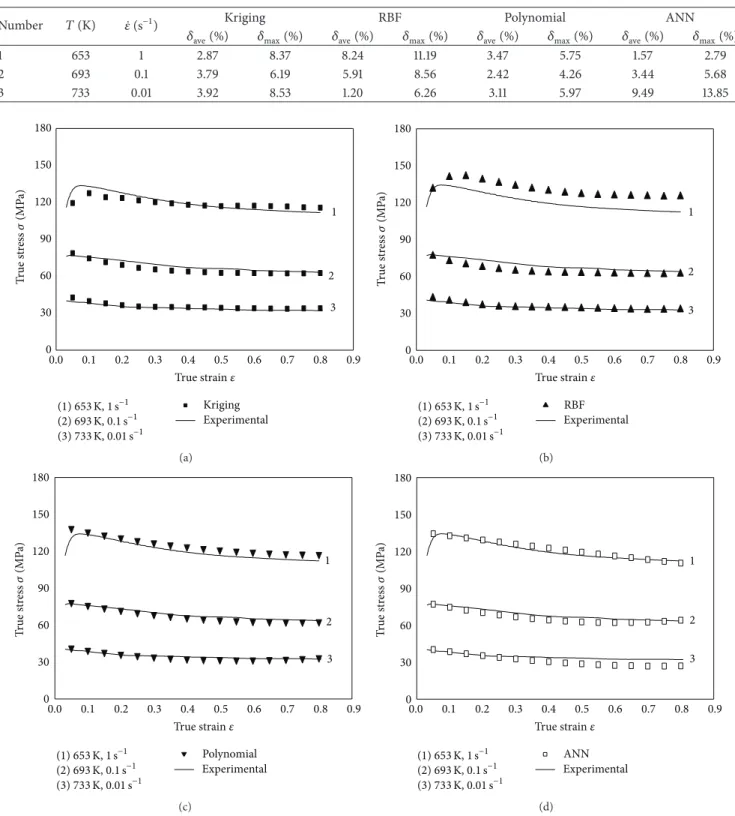
Meanwhile,Figure 4 displays the comparisons between the
predicted values and experimental curves. All the developed models can basically track the dynamic change of stress with the strain increasing at different temperatures and strain rates. Therefore, it can be considered that the four metamod-eling methods Kriging, RBF, multivariate polynomial, and
Table 2: Three testing cases to analyze the prediction accuracy of models.
Number 𝑇(K) ̇𝜀(s−1) Kriging RBF Polynomial ANN
𝛿ave(%) 𝛿max(%) 𝛿ave(%) 𝛿max(%) 𝛿ave(%) 𝛿max(%) 𝛿ave(%) 𝛿max(%)
1 653 1 2.87 8.37 8.24 11.19 3.47 5.75 1.57 2.79 2 693 0.1 3.79 6.19 5.91 8.56 2.42 4.26 3.44 5.68 3 733 0.01 3.92 8.53 1.20 6.26 3.11 5.97 9.49 13.85 30 60 90 120 150 180 0 T rue st re ss 𝜎 (MP a) 1 2 3 0.0 0.1 0.2 0.3 0.4 0.5 0.6 0.7 0.8 0.9 True strain𝜀 Kriging Experimental (1)653K,1s−1 (2)693K,0.1s−1 (3)733K,0.01s−1 (a) T rue st re ss 𝜎 (MP a) 1 2 3 0.0 0.1 0.2 0.3 0.4 0.5 0.6 0.7 0.8 0.9 True strain𝜀 Experimental (1)653K,1s−1 (2)693K,0.1s−1 (3)733K,0.01s−1 RBF 30 60 90 120 150 180 0 (b) T rue st re ss 𝜎 (MP a) 1 2 3 0.0 0.1 0.2 0.3 0.4 0.5 0.6 0.7 0.8 0.9 True strain𝜀 Experimental (1)653K,1s−1 (2)693K,0.1s−1 (3)733K,0.01s−1 Polynomial 30 60 90 120 150 180 0 (c) T rue st re ss 𝜎 (MP a) 0.0 0.1 0.2 0.3 0.4 0.5 0.6 0.7 0.8 0.9 True strain𝜀 Experimental (1)653K,1s−1 (2)693K,0.1s−1 (3)733K,0.01s−1 ANN 30 60 90 120 150 180 1 2 3 0 (d)
Figure 4: Comparisons between the predicted values and experimental flow stress curves of three testing cases: (a) Kriging; (b) RBF; (c) Polynomial; (d) ANN.
ANN are all capable of modeling the elevated temperature flow behavior of 6013 aluminum alloy. However, it is really difficult to find out which one is the most appropriate method based on the existing testing results. In order to make a reasonable selection from these modeling methods, further comparison and analysis are still needed.
3.3. Comparison of Metamodeling Methods. Sample size refers to the number of data points in a dataset. When sample size is sufficiently large, an accurate model can usually be constructed. However, the experiments and simulations are usually expensive or time-consuming, which may lead to the insufficiency of samples. Most of the modeling methods do
P redic te d flo w str es s 𝜎 (MP a) 250 200 150 100 50 0 0 50 100 150 200 250 Data points Best linear fit
R = 0.9952
Experimental flow stress𝜎(MPa)
(a) P redic te d flo w str ess 𝜎 (MP a) 250 200 150 100 50 0 814 0 50 100 150 200 250 Data points Best linear fit
R = 0.9814
Experimental flow stress𝜎(MPa)
(b) P redic te d flo w str ess 𝜎 (MP a) 250 200 150 100 50 0 R = 0.9883 0 50 100 150 200 250 Data points Best linear fit
R = 0.9883
Experimental flow stress𝜎(MPa)
(c) P redic te d flo w str ess 𝜎 (MP a) 250 200 150 100 50 0 R = 0 50 100 150 200 250 Data points Best linear fit
R = 0.9721
Experimental flow stress𝜎(MPa)
(d)
Figure 5: Correlations between the predicted and experimental flow stress: (a) Kriging; (b) RBF; (c) Polynomial; (d) ANN.
not show good performance when sample size is not large enough. This could be an indication that the samples are limited for modeling method to capture the general features of the problems. The method which can provide the most satisfactory modeling performance with limited samples will thus be considered as the most effective one.
In this section, five cases with totally different temper-atures and strain rates are selected for each time of model testing to assess the developed models. That is, one-fifth of the data are evenly excluded from the training data for testing each time. There are 120 different combinations of five cases being utilized. The general performances of the metamodeling methods are compared based on these 120
times of testing. In addition to𝛿ave, the standard deviation
(𝑆) of𝛿and the correlation coefficient (𝑅) from all the testing
points are employed as criteria for comparison of these four metamodeling methods: 𝑆 = √ 1 𝑁 − 1 𝑁 ∑ 𝑖=1 (𝛿𝑖− 𝛿)2 𝑅 = ∑ 𝑁 𝑖=1(𝐸𝑖− 𝐸) (𝑃𝑖− 𝑃) √∑𝑁 𝑖=1(𝐸𝑖− 𝐸)2∑𝑁𝑖=1(𝑃𝑖− 𝑃)2 , (8)
where 𝛿, 𝐸, and 𝑃 are the average values of𝛿𝑖, 𝐸𝑖, and𝑃𝑖,
respectively.
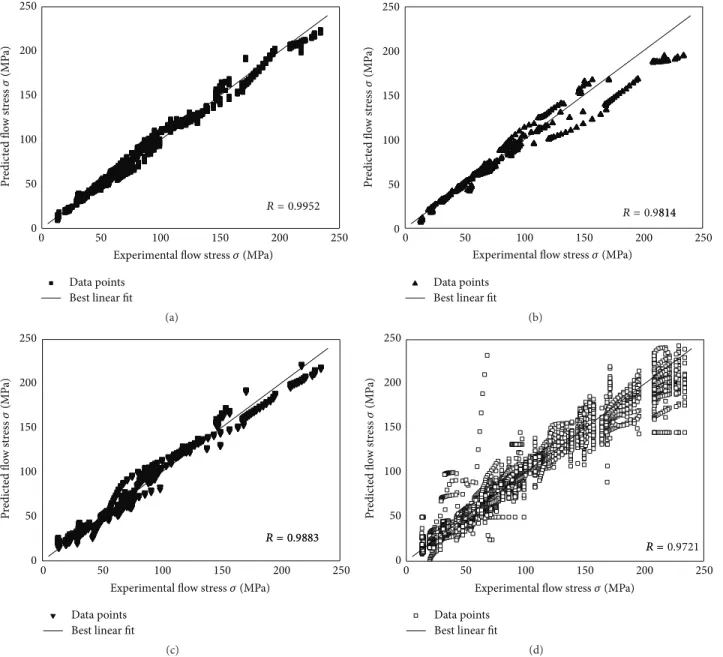
FromTable 3, it can be found that Kriging model has the
Table 3: The predictability comparison of the models. Model 𝛿ave 𝑆 𝑅 Kriging 5.68% 0.0485 0.9952 RBF 7.73% 0.0760 0.9814 Polynomial 9.95% 0.1098 0.9883 ANN 9.68% 0.1898 0.9721 25 20 15 10 5 0 (%) −0.3 −0.2 −0.1 0.0 0.1 0.2 0.3 Relative error Kriging RBF Polynomial ANN
Figure 6: Distributions of the prediction errors.
among the developed models. Meanwhile, the listed values
of𝑆help to illustrate the prediction stability of models and
Kriging model performs the best. Furthermore, the values of
𝑅provide information on the strength of linear relationship
between the predicted and experimental flow stress. As
shown inFigure 5, the fitting results of𝑅clearly demonstrate
that the coincidence degree between the experimental and predicted value from Kriging model is higher than that from other models.
In addition to the three criteria above related to the pre-diction error, the distributions of all the errors are compared among the models at a macro level. As 80 points are predicted in each testing, there are a total of 9600 values of errors collected from 120 times of testing. With the errors being classified into different groups according to their values, the
distributions are reflected inFigure 6, while𝑥-axis is relative
error and𝑦-axis is the percentages of error distribution. It can
be found that 84.91% of predicted data from Kriging method
locate in the relative error range of±10%, larger than 72.96%
from RBF, 66.29% from multivariate polynomial, and 71.53%
from ANN. Based on the comparative analysis on𝛿ave,𝑆,𝑅,
and the error distribution, Kriging method is proved to be the best one for modeling the material flow behavior.
3.4. Assessing Performance of Kriging Method. In the experi-ments, the deformation conditions such as temperature and strain rate are evenly distributed. However, these conditions are not always evenly distributed in practical manufacturing. Uniformity is a measure to evaluate how uniform a point
0.0 0.1 0.2 0.3 0.4 0.5 0.6 1 2 3 4 5 0.7 0.8 0.9 (1)10s−1 (2)1s−1 (3)0.1s−1 (4)0.01s−1 (5)0.001s−1 Kriging Experimental T rue st re ss 𝜎 (MP a) True strain𝜀 30 60 90 120 150 0
Figure 7: Comparisons between the predicted values and experi-mental flow stress curves at 733 K.
set is scattered in a space. In this task, the performance of Kriging method has been further assessed when the sample uniformity is decreased. The assessment is carried out by the way that one level of temperature and one level of strain rate are successively excluded from model training data for model testing.
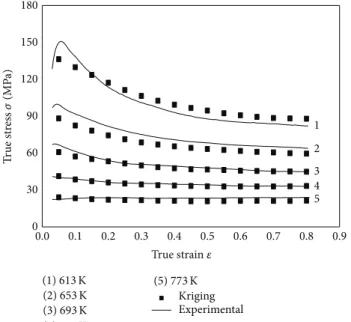
3.4.1. Decreasing Sample Uniformity Related to Temperature.
All the data related to temperature 733 K are excluded from model training data and then used for model testing. That is, the training data cover four levels of temperature and five levels of strain rate. The comparisons between the predicted values and experimental flow stress curves at 733 K are shown
inFigure 7, which are quantified by the calculated values of
𝛿ave(6.56%) and𝑆(0.0480). It is indicated that the prediction
results from Kriging model match well with the experimental data.
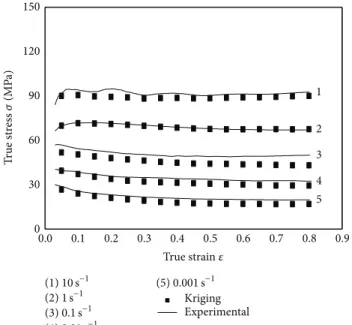
3.4.2. Decreasing Sample Uniformity Related to Strain Rate.
With the information related to all the temperature levels, the
data related to strain rate 0.01 s−1 are excluded from model
training data for model testing. The predictability of Kriging
model is also analyzed based on the𝛿aveand𝑆from all the
testing data. The predicted values from Kriging model are all close to or on the experimental flow stress curves, and
the deviations are shown in Figure 8. The high prediction
accuracy is also validated by the𝛿ave5.53% and the𝑆0.0360.
From the analysis above, it is found that Kriging model can be constructed with high accuracy and stability even when the sample quality is decreased from the aspects of sample size and sample uniformity. The applicability of Kriging method has been fully validated in modeling the flow behavior of 6013 aluminum alloy during hot deformation.
T rue st re ss 𝜎 (MP a) 0.0 0.1 0.2 0.3 0.4 0.5 0.6 0.7 0.8 1 2 3 4 5 0.9 Kriging Experimental True strain𝜀 (1)613K (2)653K (3)693K (4)733K (5)773K 30 60 90 120 150 180 0
Figure 8: Comparisons between the predicted values and experi-mental flow stress curves at 0.01 s−1.
4. Conclusions
In order to investigate the applicability of metamodeling methods and search for the appropriate method in model-ing material flow behavior, four popular metamodel types Kriging, radial basis function, multivariate polynomial, and artificial neural network are investigated and compared for modeling the elevated temperature flow behavior of 6013 alu-minum alloy. These four metamodeling methods are proved to be capable of modeling the flow behavior of 6013 aluminum alloy. When sample size for modeling is decreased by 20%, the superiority of Kriging model is revealed in prediction with satisfactory accuracy and stability. Furthermore, the excellent performance of Kriging model is again demonstrated while decreasing the sample uniformity related to temperature or strain rate. It is indicated that Kriging method can be taken as an appropriate option to model the material flow behavior, even if the sample size is not large enough or the samples are not evenly distributed.
Conflict of Interests
The authors declare that there is no conflict of interests regarding the publication of this paper.
Acknowledgments
This work was supported by National Natural Science Foun-dation of China (no. 51475156), National Key Project of Science and Technology of China (no. 2014ZX04002071), and the Opening Foundation of Key Laboratory for Nonferrous Metal and Featured Material Processing, Guangxi Zhuang Autonomous Region (no. GXKFJ14-08).
References
[1] C. X. Wang, F. X. Yu, D. Z. Zhao, X. Zhao, and L. Zuo, “Hot deformation and processing maps of DC cast Al-15%Si alloy,” Materials Science and Engineering A, vol. 577, pp. 73–80, 2013. [2] R. S. Nalawade, A. J. Puranik, G. Balachandran, K. N. Mahadik,
and V. Balasubramanian, “Simulation of hot rolling deforma-tion at intermediate passes and its industrial validity,” Interna-tional Journal of Mechanical Sciences, vol. 77, pp. 8–16, 2013. [3] A. Rusinek and J. R. Klepaczko, “Shear testing of a sheet steel
at wide range of strain rates and a constitutive relation with strain-rate and temperature dependence of the flow stress,” International Journal of Plasticity, vol. 17, no. 1, pp. 87–115, 2001. [4] Y. C. Lin and X.-M. Chen, “A critical review of experimental results and constitutive descriptions for metals and alloys in hot working,”Materials & Design, vol. 32, no. 4, pp. 1733–1759, 2011. [5] Y. C. Lin, K. K. Li, H. B. Li, J. Chen, X. M. Chen, and D. X. Wen, “New constitutive model for high-temperature deformation behavior of inconel 718 superalloy,”Materials & Design, vol. 74, pp. 108–118, 2015.
[6] S. Saadatkia, H. Mirzadeh, and J. M. Cabrera, “Hot deformation behavior, dynamic recrystallization, and physically-based con-stitutive modeling of plain carbon steels,”Materials Science and Engineering A, vol. 636, pp. 196–202, 2015.
[7] W. Liu, H. Zhao, D. Li, Z. Zhang, G. Huang, and Q. Liu, “Hot deformation behavior of AA7085 aluminum alloy during isothermal compression at elevated temperature,” Materials Science and Engineering A, vol. 596, pp. 176–182, 2014. [8] G.-Z. Quan, W.-Q. Lv, Y.-P. Mao, Y.-W. Zhang, and J. Zhou,
“Prediction of flow stress in a wide temperature range involving phase transformation for as-cast Ti-6Al-2Zr-1Mo-1V alloy by artificial neural network,”Materials & Design, vol. 50, pp. 51–61, 2013.
[9] V. Senthilkumar, A. Balaji, and D. Arulkirubakaran, “Applica-tion of constitutive and neural network models for predic“Applica-tion of high temperature flow behavior of Al/Mg based nanocompos-ite,”Transactions of Nonferrous Metals Society of China (English Edition), vol. 23, no. 6, pp. 1737–1750, 2013.
[10] Y. Han, G. J. Qiao, J. P. Sun, and D. N. Zou, “A comparative study on constitutive relationship of as-cast 904L austenitic stainless steel during hot deformation based on Arrhenius-type and artificial neural network models,”Computational Materials Science, vol. 67, pp. 93–103, 2013.
[11] G. G. Wang and S. Shan, “Review of metamodeling techniques in support of engineering design optimization,”Transactions of the ASME—Journal of Mechanical Design, vol. 129, no. 4, pp. 370–380, 2007.
[12] D. Zhao and D. Xue, “A comparative study of metamodeling methods considering sample quality merits,” Structural and Multidisciplinary Optimization, vol. 42, no. 6, pp. 923–938, 2010. [13] D. G. Krige,A statistical approach to some mine valuations and allied problems at the witwatersrand [M.S. thesis], University of the Witwatersrand, Johannesburg, South Africa, 1951. [14] G. Matheron, “Principles of geostatistics,”Economic Geology,
vol. 58, no. 8, pp. 1246–1266, 1963.
[15] J. Sacks, W. J. Welch, T. J. Mitchell, and H. P. Wynn, “Design and analysis of computer experiments,”Statistical Science, vol. 4, no. 4, pp. 409–435, 1989.
[16] S. N. Lophaven, H. B. Nielsen, and J. Søndergaard, “Dace: a Matlab kriging toolbox, version 2.0,” Tech. Rep. IMMREP-2002-12, Technical University of Denmark, Kongens Lyngby, Denmark, 2002.
[17] M. J. D. Powell, “Radial basis functions for multivariable interpolation: a review,” inAlgorithms for Approximation, J. C. Mason and M. G. Cox, Eds., pp. 143–167, Clarendon Press, 1987. [18] R. H. Myers and D. C. Montgomery,Response Surface Method-ology: Process and Product Optimization Using Designed Exper-iments, John Wiley & Sons, 1995.
[19] N. Haghdadi, A. Zarei-Hanzaki, A. R. Khalesian, and H. R. Abedi, “Artificial neural network modeling to predict the hot deformation behavior of an A356 aluminum alloy,”Materials & Design, vol. 49, pp. 386–391, 2013.
[20] H.-Y. Li, X.-F. Wang, D.-D. Wei, J.-D. Hu, and Y.-H. Li, “A comparative study on modified Zerilli–Armstrong, Arrhenius-type and artificial neural network models to predict high-temperature deformation behavior in T24 steel,” Materials Science and Engineering A, vol. 536, pp. 216–222, 2012. [21] F. J. Humphreys and M. Hatherly,Recrystallization and Related
Annealing Phenomena, Elsevier, 2nd edition, 2004.
[22] J. Zhang, H. Di, X. Wang, Y. Cao, J. Zhang, and T. Ma, “Con-stitutive analysis of the hot deformation behavior of Fe-23Mn-2Al-0.2C twinning induced plasticity steel in consideration of strain,”Materials & Design, vol. 44, pp. 354–364, 2013. [23] G. Xiao, L.-X. Li, and T. Ye, “Modification of flow stress
curves and constitutive equations during hot plane compression deformation of 6013 aluminum alloy,”The Chinese Journal of Nonferrous Metals, vol. 24, no. 5, pp. 1268–1274, 2014.
Submit your manuscripts at
http://www.hindawi.com
Hindawi Publishing Corporation
http://www.hindawi.com Volume 2014
Mathematics
Journal ofHindawi Publishing Corporation
http://www.hindawi.com Volume 2014 Mathematical Problems in Engineering
Hindawi Publishing Corporation http://www.hindawi.com
Differential Equations
International Journal of
Volume 2014
Hindawi Publishing Corporation
http://www.hindawi.com Volume 2014 Hindawi Publishing Corporationhttp://www.hindawi.com Volume 2014
Hindawi Publishing Corporation
http://www.hindawi.com Volume 2014 Mathematical PhysicsAdvances in
Complex Analysis
Journal ofHindawi Publishing Corporation
http://www.hindawi.com Volume 2014
Optimization
Journal ofHindawi Publishing Corporation
http://www.hindawi.com Volume 2014
Combinatorics
Hindawi Publishing Corporation
http://www.hindawi.com Volume 2014
International Journal of
Hindawi Publishing Corporation
http://www.hindawi.com Volume 2014
Journal of
Hindawi Publishing Corporation
http://www.hindawi.com Volume 2014
Function Spaces
Abstract and Applied Analysis
Hindawi Publishing Corporation
http://www.hindawi.com Volume 2014 International Journal of Mathematics and Mathematical Sciences
Hindawi Publishing Corporation http://www.hindawi.com Volume 2014
The Scientific
World Journal
Hindawi Publishing Corporationhttp://www.hindawi.com Volume 2014
Hindawi Publishing Corporation
http://www.hindawi.com Volume 2014
Discrete Dynamics in Nature and Society Hindawi Publishing Corporation
http://www.hindawi.com Volume 2014
Hindawi Publishing Corporation
http://www.hindawi.com Volume 2014
Discrete Mathematics
Journal ofHindawi Publishing Corporation
http://www.hindawi.com Volume 2014 Hindawi Publishing Corporationhttp://www.hindawi.com Volume 2014