Evaluating the Relationship between the Structures and
Past Information with Capital Structure
Hoseien Heydari
Accounting & Management Department,
Kashan Branch of IAU, Iran
Dr. Hassan Ghodrati
Accounting & Management Department, Kashan Branch of IAU,
Iran
ABSTRACT
This study evaluates the relationship between the structure and past information with capital structure between the listed corporations on Tehran stock exchange. To do the study, a sample of 114 corporations from ones listed on exchange was selected by using the stratified random sampling. The study was done during 2007-2012 that 324 observations were totally used to research period. The statistical method Panel data regression was used in this study. For the purpose of study four hypotheses were proposed that all of them were approved. The results show that there is a direct relationship between profitability, book-to-market ratio, corporation size and the ratio of collateral assets with capital structure. It means that capital structure will be increased by increasing independent variables and vice versa.
Keywords:
Profitability, Corporation size, Book-to-market ratio, Capital structure.1.
INTRODUCTION
and uses of funds, why and how a particular source is selected according to the requirements of the external environment and also dominant phenomena and the internal characteristics are determined.
So the question that is proposed in this relation is this:
What is the relationship between the past information including profitability, corporation size, the ratio of M/B, and collateral assets and the dependent variable financial leverage?
2.
Review of the Literature
preferential and Static Trade-off theory. David Allen (2000) examined the capital structure of 48 corporations listed on the Australian stock exchange. The obtained results were consistent with the preferential theory based on considering financing resources and maintaining the appropriate capacity of debt but they didn’t support the prediction of Static Trade-off theory. Jensen and Mc Ling (1998) examined the managing behavior, agency costs, and ownership structure. They studied the reasons of selecting capital structure pattern from the perspective of agency theory and implicitly dealt with explaining "Static Trade-off theory". Based on this study, it can be possible to achieve an optimal ownership structure by creating a parallel between the benefits of debt and agency costs of debt. Mighani (2014) examined the relationship between financial flexibility and capital structure decisions. In this study, data related to 94 Iranian corporations were tested during 2005-2011. He showed that the marginal value of cash was positive in Farklando Wang method but it was not significant in Clarke method. The results of the second hypothesis suggest that there is a significantly inverse relationship between financial flexibility and debt ratio. Also, the results of the third hypothesis states that the marginal value of cash has the most impact on the capital structure decisions. Pourheidari (2012) examined the relationship between industry, size, profitability and collateral assets, and financial leverage of corporation. He showed that there was a significantly inverse relationship between the financial leverage and profitability and the relationship between the financial leverage and size was significant and direct. Based on this study, no significant relationship was seen between industry and collateral assets and financial leverage. Marmarchi (2010) examined the factors affecting the capital structure and financial leverage ratios in industrial corporations listed in Tehran stock exchange. He indicated that growth opportunities, corporation size and power of managers have a positive effect on financial leverage and past profitability has a strong negative effect on financial leverage. Also the corporation power to give collateral and its interest fluctuations has a positive effect on the financial leverage in long-term and it has a negative effect in short-term. Bagherzadeh (2008) examined the pattern of capital structure of listed corporations in Tehran stock exchange. He studied 158 manufacturing corporations and found that the there is a positive relationship between profit and the corporation's tangible fixed assets and the corporation size with debt ratio. The findings of this study reject the preferential theory and support the Static Trade-off theory.
3.
Research Hypothesis
The main hypothesis: there is a relationship between the structures and past information with capital structure.
Sub-hypotheses:
1. There is a relationship between profitability and capital structure.
2. There is a relationship between M/B and capital structure.
3. There is a relationship between the size of corporation and capital structure.
4. There is a relationship between the ratio of collateral assets and capital structure.
4.
Methodology:
A Sample and Sampling
In this study the comparable manufacturing corporations listed in Tehran stock exchange were described as 114 corporations. Stratified random sampling method was used to sampling. To determine the sample size, firstly the random sample with size 15 was selected as pilot and based on its obtained variance the random sampling size of 54 corporations was measured by using the following formula:
S2= (𝑥𝑖− 𝑥) 2
𝑛 − 1
𝑛 ≥𝑡 2(𝛼
2, 𝑑𝑓)𝑠2 𝐷2
2.57062 * 0.08154 53.8815
0.01
B Methods and Tools for Data Analysis:
In this research, software, statisticaland non-statistical methodsfortheanalysisof data were used:
1) Descriptive Methods: mean statistical index, standard deviation, skew and kurtosis index were used to describe data.
2) Normality Test of Distributing Variables: Kolmogorov - Smirnov (KS) Test was used to assess the normality of distributing variables.
In this study, if the significance level is greater than 0.05, it has been considered as the normality of distributing variables.
3) Normality of Residuals: Durbin-Watson Test was used to determine the independence of the estimated model errors. If the test statistic is usually from 1.5 to 2.5 indicates that the estimated model errors are not autocorrelated.
3) Normality of Residuals: Durbin-Watson Test was used to determine the independence of the estimated model errors. If the test statistic is usually from 1.5 to 2.5 indicates that the estimated model errors are not autocorrelated.
4) Test of Evaluating that Model's Effects are fixed or Variable: evaluating that model's effects are fixed or variable was done based on F Leamer test. If the significance level is greater than 0/05 in this study, the integration method is used and if the significance level is less than 0/05, the painting method is used to estimate the model.
5) Randomness Test of the Estimated Model Errors: Hausman test was done to estimate the randomness of regression model errors. If the null hypothesis is accepted, the fixed effect model is used otherwise the random effect model is used.
6) Evaluation of Linear Independence of the Independent Variables: with regard to the need to establish an additivity presupposition in the compound linear analysis, the linear correlation analysis based on the Pearson
7) Determining the Relationships between Variables: in order to determine the relationship between
independent and dependent variables, the compound linear regression with panel data approach was used.
In other words, based on historical data related to the dependent and independent variables during 5 year parameters of the linear relationship between variables were estimated.
8) Validation of the Estimated Correlation: the coefficient of determination or R2 was used for this purpose. In this assessment, if the estimated value of the coefficient is closer to one or hundred percent, more percentage of the actual changes is related to the actual and independent variables that are expressed based on the estimated
relationship, also there is a strong linear relationship between the variables.
9) Generalized Methods: Student's t-test was used to evaluate the possibility of generalizing the relationship between every independent variable with dependent variable or the significance of the estimated linear gradient.
In addition, Fisher test was used to evaluate the significance of the estimated linear relationship.
C) Research Model:
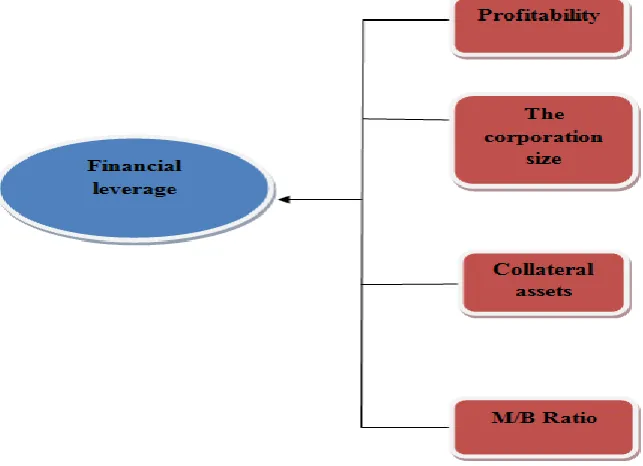
In this study, the total relationship between the variables is defined as follows:
Y=f(x1, x2, x3, x4)
In this equation: Y or BL is dependent variable of capital structure, X1 or BEP is profit, X2 or M / B is book-to-stock market ratio, X3 or size of corporation, X4 or IGP is collateral assets.
Variables are measured as follows:
1) Financial Leverage: this variable defined as the dependent variable was calculated from the following equation:
𝐵𝐿𝑖,𝑡 = 𝐵𝐷𝑖,𝑡 𝑇𝐴𝑖,𝑡
Where BL I, t is the financial leverage based on book for corporation i at time t. BD I, t is book value of debt for corporation i at time t. TA I, t is total assets for corporation i at time t, respectively.
2) Profitability: this variable defined as one of the independent variables was calculated from the following equation:
𝐵𝐸𝑃𝑖,𝑡= 𝐸𝐵𝐼𝑇𝑖,𝑡
𝑇𝐴𝑖,𝑡
Where: 𝑬𝑩𝑰𝑻𝒊,𝒕 is earnings before interest deduction and tax for corporation i at time t. TA I, t is total assets for corporation i at time t, respectively.
3) Book-to-Market Ratio: this variable is defined as one of the independent variables and was calculated from the following equation:
𝑀 𝐵 𝑖,𝑡=
Where BD I, t is book value of debt for corporation i at time t and ME I, t is market value of equity for corporation i at time t and TAI, t is total assets for corporation i at time t, respectively. 4) Size of Corporation: it is determined as one of the other independent variables based on the corporation sale logarithm or Size= lns.
5) Collateral Assets: this variable defined as one of the other independent variables that were calculated from the following equation:
𝐼𝐺𝑃𝑖,𝑡 = 𝐼𝑔𝑃𝑖,𝑡
𝑇𝐴𝑖,𝑡
Where Ig p I, t is the fixed tangible asset of corporation i at time t. TA I, t is total assets for corporation i at time
t.In this study, the relationship between variables has been defined in a parametric linear equation:
𝐵𝐿 = ∝ + 𝛽1𝐵𝐸𝑃 + 𝛽2 𝑀
𝐵 + 𝛽3𝑆𝑖𝑧𝑒 + 𝛽4𝐼𝐺𝑃 + 𝜀.
That the values of independent and dependent variables were determined based on historical data relating to the performance of corporations in the random sample and parameters of this equation including α, β2, β3 and β4
were evaluated by using compound linear regression. Besides, the research model is depicted graphically in Figure 1:
Figure 1: Conceptual model of research
In this research, SPSS and EVIEWS were used for data analysis and statistical calculations and EXCELL software was used for initial processing of data and sorting them. Moreover, Rahavard-e novin software was applied to use stock data and information.
5.
Findings of the Study:
In this section, the findings' description was firstly presented and after proposing the presuppositions of compound linear regression the results related to analyzing relationships between the variables were presented.
A) Describing Findings:
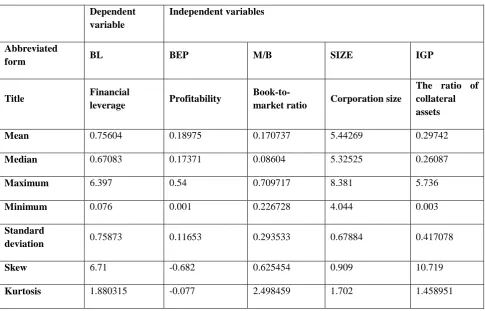
The results of describing findings were summarized in the form of evaluating the statistical indexes of variables in table (1).
Table (1) Description of Findings
Independent variables Dependent variable IGP SIZE M/B BEP BL Abbreviated form
The ratio of collateral assets Corporation size Book-to-market ratio Profitability Financial leverage Title 0.29742 5.44269 0.170737 0.18975 0.75604 Mean 0.26087 5.32525 0.08604 0.17371 0.67083 Median 5.736 8.381 0.709717 0.54 6.397 Maximum 0.003 4.044 0.226728 0.001 0.076 Minimum 0.417078 0.67884 0.293533 0.11653 0.75873 Standard deviation 10.719 0.909 0.625454 -0.682 6.71 Skew 1.458951 1.702 2.498459 -0.077 1.880315 Kurtosis
Skew shows the asymmetry of distribution with respect to a given index (usually towards mean). If the coefficient of skew is negative, the skew is to the left. In the above table it can be seen that except the corporation's profit variable that the skew is to the left in other variables the skew is to the right. Kurtosis of all variables except the profit variable is higher than the normal distribution (because their kurtosis coefficient is positive). Financial leverage variable has the maximum 6.397, the minimum 0.076, with the median 0.75604, and standard deviation 0.75873.
Profitability variable has the maximum and minimum 0.54 and 0.001and the median 0.18975 with standard deviation 0.11653 and other information that can be seen in the above table.
With regard to the use of compound linear regression to estimate the relationships between variables in this section, presuppositions of using this method have been assessed.
1) Investigating the Normality of Variables: to do regression analysis, the normality test of variables is firstly examined by K-S test. In this test, the null hypothesis or the statistical assumption is the normality of variables' distribution. This test was done to all dependent and independent variables and its results were summarized in table (2):
Table (2) Kolmogorov - Smirnov (KS) Test
Independent variables Dependent variable IGP SIZE M/B BEP BL Abbreviated form
The ratio of collateral assets Corporation size Book-to-market ratio Profitability Financial leverage Title 324 324 324 324 324 The number of samples 0.29742 5.44269 0.17084 0.1898 0.75604 Mean 0.417078 0.67884 0.293533 0.1165 0.75873 Standard deviation 0.244 0.116 0.498 0.075 0.406 The maximum absolute deviation 0.194 0.116 0.498 0.075 0.406 The maximum positive deviation -0.244 -0.063 -0.475 -0.054 -0.273 The maximum
negative deviation 3.534 1.677 11.436 1.092 5.886 The Z score
0 0.007 0 0.184 0 Significant level
According to Table (2), as the significance level in variables is lower than 0.05 except for profitability and corporation size variables, H0 hypothesis is rejected and H1 accepted. In other words, other data are not normally distributed. To normalize variables, square logarithm was used and normality test was repeated again.
2) Reliability Test of Variables: Fisher ADF test was used to evaluate the reliability of the variables in the regression estimation. The results of this evaluation are presented in Table (3):
Table (3) Fisher ADF Test
Score Probability
Abbreviated form Title
Type of variable
82.9125 0
LNBL Financial leverage
Dependent variable
195.305 0
BEP Profitability
Independent variables
653.065 0
LNM/B Book -to-market
ratio
130.856 0
SIZE Corporation size
56.656 0
LNIGP The ratio of
collateral assets
As it can be seen in all dependent, independent, and adjusted variables, the P-Value is less than 0.05 in unit root tests and it indicates that the variables are reliable. This means that the mean and the variance of variables and their covariance had been constant over time and during different years, respectively. So using these variables in model does not create false regression.
3) Durbin-Watson Test:
Durbin-Watson test was used to investigate the normality of residuals.
Table (4) Models' Durbin-Watson Coefficients
4 3
2 1
Model
2.12680 1.692019
2.39563 1.83025
Durbin-Watson coefficient
According to Table (4) since the calculated Durbin-Watson for all variables is from 1.5 to 2.5 thus there is no autocorrelation in the model. In other words, since the value of Durbin-Watson is from 1.5 to 2.5 for all
variables the assumption of lack of correlation between the errors is not rejected and regression can be used.
4) Coefficient of Determination Test (R2-test):
Coefficient of determination and the adjusted coefficient of determination were used to investigate the relationship between the variables. Results show the following cases.
Table (5) Models' Coefficient of Determination and the Adjusted Coefficient
5.1 Adjusted coefficient of determination (adjusted R2)
The coefficient of determination shows the explanatory power of the independent variables. Table (5) shows that how much variation in the dependent variable is expressed by the independent variable. For example, in model (1) the independent variable is able to explain the variations of the dependent variable about %77/5.
D) Determining the Relationships between Variables:
With regard to the establishment of the evaluated presuppositions in the previous section, in this section the relationships
between the variables were examined by using the compound regression method.
1) Determining the Relationship between Profitability and Financial Leverage: the results of this relationship have been described in Table (6) by using the compound linear regression: Table (6) Regression Evaluation of the Relationship between Profitability and Financial Leverage
𝐵𝐿𝑖𝑡 =. 𝟕𝟐𝟐+. 𝟔𝟖𝟏 ∗ 𝐵𝐸𝑃𝑖𝑡
T-test probability T-test statistic
Standard error The estimated
coefficient Variables
0.0000 10.35370
0.228 0.681
Profitability
0.0000 2.401554
045.0 722.0
Constant value
0.774 Adjusted R2
0.775 R2
2.12680 Durbin-Watson
criteria
1. Based on the table, interception and the slope of variable are 0.722 that by replacing in the related linear equation the relationship between profitability and financial leverage is as follows:
𝐵𝐿𝑖𝑡 =. 𝟕𝟐𝟐+. 𝟔𝟖𝟏 ∗ 𝐵𝐸𝑃𝑖𝑡
2. The above equation shows a direct relationship between profitability and financial leverage.
3. The coefficient of determination (R2) shows the explanatory power of the independent variables that are able to explain the variability of the dependent variable about %77.5.
4. Because Durbin-Watson value is from 1.5 to 2.5 so there is no autocorrelation in model.
5. Probability of F shows that the model is statistically significant (because the probability of F is less than 0.05). So the first hypothesis is confirmed with 95% confidence .It means there is a relationship between profitability and financial leverage.
2) Determining the Relationship between the Ratio of Collateral Assets and Financial Leverage: The results of this relationship have been summarized by using the compound linear regression in Table (7):
0.774 0.775
5.4 1
0.928 0.930
5.5 2
0.801 0.804
5.6 3
0.532 0.568
Table (7) The estimated regression of the relationship between book-to market ratio and financial leverage
𝐵𝐿𝑖𝑡 =. 𝟔𝟏𝟐+. 𝟎𝟑𝟎 ∗ 𝑀/𝐵𝑖𝑡
T-test probability T-test statistic
Standard error The estimated
coefficient Variables
0.0000 4.54850
0.019 0.030
Bok-to-market ratio
0.0000 8.61160
0.144 0.612
Constant value
0.928 Adjusted R2
0.930 R2
1.692019 Durbin-Watson
criteria
1. Based on the table, interception and the slope of variable are 0.612 that by replacing in the related linear equation the relationship between profitability and financial leverage is as follows:
𝐵𝐿𝑖𝑡 =. 𝟔𝟏𝟐+. 𝟎𝟑𝟎𝑀/𝐵𝑖𝑡
2. The above equation shows a direct relationship between profitability and financial leverage. 3. The coefficient of determination (R2) shows the explanatory power of the independent variables that are able to explain the variability of the dependent variable about %93. 4. Because Durbin-Watson value is from 1.5 to 2.5 so there is no autocorrelation in model. 5. Probability of F shows that the model is statistically significant (because the probability of F is less than 0.05).So the second hypothesis is confirmed with 95% confidence .It means there is a relationship between book-to-market ratio and financial leverage.
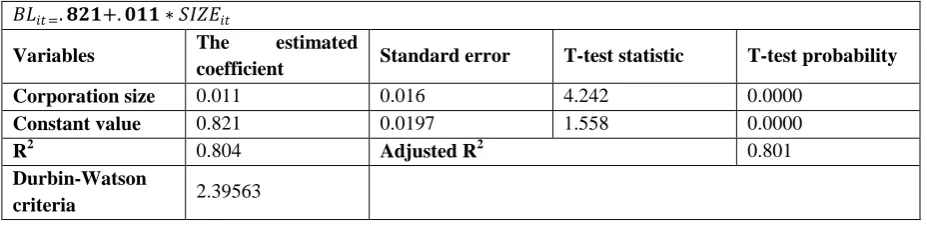
3. Determining the relationship between corporation size and financial leverage: the results of this relationship have been summarized by using the compound linear regression in Table (8): Table (8) The estimated regression of the relationship between corporation size and financial leverage
𝐵𝐿𝑖𝑡 =. 𝟖𝟐𝟏+. 𝟎𝟏𝟏 ∗ 𝑆𝐼𝑍𝐸𝑖𝑡
T-test probability T-test statistic
Standard error The estimated
coefficient Variables
0.0000 4.242
0.016 0.011
Corporation size
0.0000 1.558
0.0197 0.821
Constant value
0.801 Adjusted R2
0.804 R2
2.39563 Durbin-Watson
criteria
1. Based on the table, interception and the slope of variable are 0.821 that by replacing in the related linear equation the relationship between profitability and financial leverage is as follows:
2. The above equation shows a direct relationship between profitability and financial leverage. 3. The coefficient of determination (R2) shows the explanatory power of the independent variables that are able to explain the variability of the dependent variable about %80.4. 4. Because Durbin-Watson value is from 1.5 to 2.5 so there is no autocorrelation in model. 5. Probability of F shows that the model is statistically significant (because the probability of F is less than 0.05). So the third hypothesis is confirmed
with 95% confidence .It means there is a relationship between Corporation size and financial leverage.
4. Determining the Relationship between the Ratio of Collateral Assets and Financial Leverage: the results
of this relationship have been summarized by using the compound linear regression in Table (9):
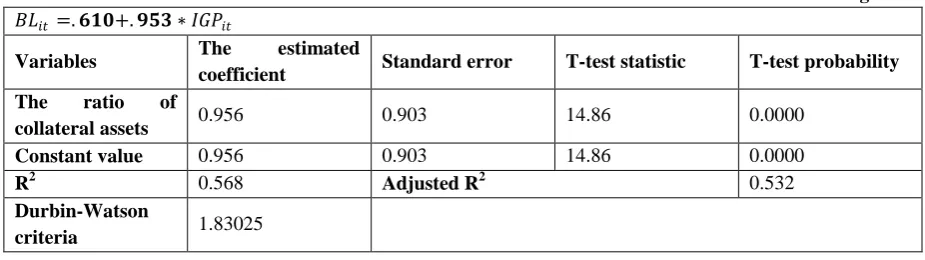
Table (9) The estimated regression of the relationship between the ratio of collateral assets and financial leverage
𝐵𝐿𝑖𝑡 =. 𝟔𝟏𝟎+. 𝟗𝟓𝟑 ∗ 𝐼𝐺𝑃𝑖𝑡
T-test probability T-test statistic
Standard error The estimated
coefficient Variables
0.0000 14.86
0.903 0.956
The ratio of collateral assets
0.0000 14.86
0.903 0.956
Constant value
0.532 Adjusted R2
0.568 R2
1.83025 Durbin-Watson
criteria
1. Based on the table, interception and the slope of variable are 0.610 that by replacing in the related linear equation the relationship between profitability and financial leverage is as follows:
𝐵𝐿𝑖𝑡 =. 𝟔𝟏𝟎+. 𝟗𝟓𝟑𝐼𝐺𝑃𝑖𝑡
2. The above equation shows a direct relationship between profitability and financial leverage. 3. The coefficient of determination (R2) shows the explanatory power of the independent variables that are able to explain the variability of the dependent variable about %56.8. 4. Because Durbin-Watson value is from 1.5 to 2.5 so there is no autocorrelation in model. 5. Probability of F shows that the model is statistically significant (because the probability of F is less than 0.05). So the fourth hypothesis is confirmed with 95% confidence .It means there is a relationship between the ratio of collateral assets and financial leverage.
6.
Conclusion
In this study the relationships between variables were assessed using compound linear regression that the results briefly showed that:
1. There is a significant relationship between profitability and financial leverage. This direct relationship has been assessed by the estimated coefficient. The coefficient of determination (R2) showed that %77.5 of the variations of variables have been expressed by the estimated relationship that shows a strong linear relationship between variables.
2. There is a significant relationship between book-to-market ratio and financial leverage. Considering the estimated coefficient this relationship is direct. The coefficient of determination showed that %93 of the variations of variables has
3. There is a significant relationship between corporation size and financial leverage. Considering the estimated coefficient this relationship is direct. The coefficient of determination showed that %80.4 of the variations of variables
has been expressed by the estimated relationship that shows a strong linear relationship between variables.
4. There is a significant relationship between the ratio of collateral assets and financial leverage. Considering the estimated coefficient this relationship is direct. The coefficient of determination showed that %56.8 of the variations of variables has been expressed by the estimated relationship that shows a strong linear relationship between variables.
7.
References
[1] F. Abdollahzadeh and A. Modares: Financial management, Sepidar publication, 2nd edition. 1994, pp. 194-196.
[2] Gh. Afsharmehr, "Investigating the relationship between capital structure and the stock return of listed corporations in Tehran Stock Exchange", Master thesis, Shahid Beheshti University, 1999.
[3] M. Ahmadzadeh, et al, "The investigation of capital structure and financial resources of Keshavarzi Bank and offering the appropriate methods to optimize it", Journal of the Accounting and Auditing Review,
2005, Vol. 19, No.29. pp. 146-197.
[4] Azar and M. Momeni, "Statistics and its application in management", 2006. Najm, Samt publication, 5edition, Vol. 2, pp.71-72.
[5] S. Bagherzadeh, "Explaining the capital structure's pattern of listed corporations in Tehran Stock Exchange", Financial studies, 2003, No.16.
[6] A. Bevan and J. Danbolt, "Capital structure and its determinants in the UK: A decomposition Analysis”, apply finance economics, 2002, Vol. 12, No.3, pp.159-170.
[7] Bradley, M., Jarrell, G. A and Kim, E, "On the existence of an optimal capital structure: Theory and evidence", the journal of Finance, Vol. 39, No.3, pp. 857-878.
[8] R. Brealeyi and S. Myers, "Principals of corporate finance", Mc Graw Hill, 1991, pp.857-878.
[9] K.H, Change, "Asset characteristic and Corporate Policy: An Empricial Test", Journal of Finance&Accounting, 1993, pp.83-100.
[10]J. Ferdosen and B. Vaikey, "Financial management 2", Ailarpublication, 1996.
[11]M. Ferri and W. Jones, "Determinants of Financial Structure Mathodological Approach", Journal of Financial Management, 1979, pp.631-644.
[12]E.F. Fima and K.R.French, "The cross-section of expected stock returns", Journal of finance, 1992, Vol.47, No.2, pp.427-465.
[13]H. Ghalibafasl, "Studying the effect of capital structure on the systematic risk of common stock of listed corporations in Tehran Stock Exchange", Master thesis in management, University of Tehran, 1994.
[14]Jahankhani and A.Parsaeeian, "Stock Exchange", Modiriat publication., University of Tehran, 1edition, 1995, pp.262-295.
[15]Jahankhani and A.Parsaeeian, "Investment management and evaluation of securities", Faculty of management publication, University of Tehran., 1997.
[17]M. Jesen and W. Meckling, "Theory of the corporation": Financial Economics, 1976.
[18]S. Khoshnoud, "Investigating the effective factors on capital structure of listed corporations in Tehran Stock Exchange", Master thesis, Shahid Beheshti University, 2005.
[19]T. Mayers, "The capital structure puzzle", Journal of finance, 1997, Vol.39, pp.575-592.
[20]D. Miller and J. Puthenpurackal, "The costs,determinants,and wealth effects of international capital rising:
[21]Evidence from public Yankee bonds", Journal of financial inter mediation, 2002. Vol.11, pp.455-485.
[22]F. Modigliani and M.H. Miller, "Corporate income taxes and the cost of capital: a correction", American Economic Review.June, 1963.
[23]R. Mohammadi, "Studying the determinants on capital structure of listed corporations in Tehran Stock Exchange", Master thesis, Alzahra University, 2005.
[24]M. Namazi and Z. Shooshtarian, "Studying the efficiency of Tehran Stock Exchange", financial studies, 1995, Vol.2, No.7 and 8, pp. 82-104.
[25]M. Namazi and J. Shirzadeh, "Studying the relationship between capital structure and profitability of listed corporations in Tehran Stock Exchange (accentuating on the type of industry)", Accounting and auditing studies, 2005, Vol.12, No.42, pp. 75-95.
[26]M. Namazi and M. Heshmati, "Studying the effect of structures and past information on capital structure of listed corporations in Tehran Stock Exchange", Journal of the Accounting and Auditing Review, 2007, Vol.14, No.49, pp. 139-160.
[27]H. Nikoomaram, et al, "Principals of financial management", Termeh publication., 2edition, 2009.
[28]Pourheidari, "Studying the determinants of financial structure of listed corporations in Tehran Stock Exchange", Master thesis in management, University of Tehran, 1995.
[29]N. Rahimian, "An introduction to the methods of financing resources in economic units, the accountant", 2001, No.146, pp. 28-36.
[30]G. Rajan Raghuram and l. Zingales, "What do we know about capital structure? Some evidence from international data.” Journal of finance, 1995, Vol.50, No.5, pp.1421-1460.
[31]R. Shabahang, "Financial management, specific research center of accounting of auditing organization", 2005, 8edition, Vol.2, pp.194-196.
[32]Shapiro, "Long-term financing strategy of corporations", Financial studies., 1994.
[33]M. Sheikholmolouki, "Studying the effect of capital structure's changes to the value of manufacturing corporations", Master thesis, Islamic Azad University, Arak branch, 2007.
[34]C. Smit, "Alternative Methods for rising capital", Journal of financial economics, 1977, vol.5, pp.237-307.
[35]S. Titman and R. Wesseles, "The determinants of capital structure choice", Journal of finance, 1988, pp.1-20.
[36]S. Titman, "The effect of capital Structure on a Corporations liquidation decision", Journal of financial economics, 1984, Vol.8, pp.137-151
[37]H. Vakilifard, "Decision making in financial issues", Jungle publication, 2009, 1edition, pp.1-257.