Where people shop is not associated with the nutrient quality of
packaged foods for any racial-ethnic group in the United States
1,2Dalia Stern,3Jennifer M Poti,3Shu Wen Ng,3,5,6Whitney R Robinson,4,5Penny Gordon-Larsen,3,5and Barry M Popkin3,5*
Departments of3Nutrition and4Epidemiology, Gillings School of Global Public Health, and5Carolina Population Center, University of North Carolina at
Chapel Hill, Chapel Hill, NC; and6USDA Duke-University of North Carolina Collaborative Center for Behavioral Economics and Healthier Food Choice
Research (BECR), Durham-Chapel Hill, NC
ABSTRACT
Background:In the literature, it has been suggested that there are race-ethnic disparities in what Americans eat. In addition, some studies have shown that residents of African American and low-income neighborhoods have less access to grocery stores and super-markets, which tend to stock healthier foods. However, it is unclear whether differences in food shopping patterns contribute to the poorer nutrient profile of food purchases made by racial-ethnic minorities. Objectives: We examined whether the mix of food stores where people shop (i.e., food-shopping patterns) was associated with the nutrient profile of packaged food purchases (PFPs) and the types of foods and beverages purchased, and we determined whether these associations differ across racial-ethnic groups.
Design:We used PFPs by US households (Nielsen National Con-sumer Panel) from 2007 to 2012 and implemented a cluster analysis to categorize households according to their food-shopping patterns. Longitudinal random-effects linear regression models were used to examine the association between food shopping patterns and the nutrient qualities and types of packaged foods and beverages pur-chased by race-ethnicity in US households.
Results:Shopping primarily at grocery chains was not associated with a better nutrient profile of household PFPs or the food and beverages that households purchased than was shopping primarily at mass merchandisers (value-oriented stores that sell merchandise lines in multiple departments) or at a combination of large and small stores. These results were consistent across racial-ethnic groups. Regardless of where households shopped, non-Hispanic African American house-holds purchased foods with higher energy, total sugar, and sodium densities than did non-Hispanic white and Hispanic households. Conclusion: Policy initiatives that focus on increasing physical access to stores or helping stores sell healthier products to encour-age healthier purchases may be ineffective because other factors may be more important determinants of food and beverage pur-chases than where people shop or what is available in the store. Am J Clin Nutr2016;103:1125–34.
Keywords: disparities, food purchases, store type, US, food environment
INTRODUCTION
The literature has suggested that there are race-ethnic dis-parities in what Americans eat (1). In US adults, non-Hispanic
African Americans have a poorer dietary quality than do non-Hispanic whites and Mexican Americans (2). The literature has also shown that residents of non-Hispanic African American and low-income neighborhoods have less physical access to food stores that sell healthy foods (i.e., grocery stores or supermarkets) and more physical access to convenience or small stores (3–6). On the basis of these findings, it has been suggested that the type of stores at which people shop for food influences what people eat (7, 8).
With the assumption that differential food access might un-derlie nutritional disparities, programs and policies at state and national levels (9–12) have focused on building grocery stores or supermarkets in food deserts or areas with poor access to healthy foods to improve dietary quality and reduce health disparities. These strategies have relied on the assumption that people who shop at larger retail stores (e.g., grocery stores) purchase foods with a better nutrient profile because grocery stores sell a greater variety of foods with a higher nutritional quality at lower prices than in other stores (e.g., convenience stores), and larger stores have more capacity to handle perishables (13). However, im-proving the retail food infrastructure of neighborhoods (14–17) may not produce the desired changes in food purchasing and consumption patterns.
Most studies that have looked at the food environment and its association to diet and health have focused on the physical access to food stores (5, 18–20) but have not collected data on where people shopped for food and what they actually purchased and have not examined the nutrient profiles of these purchases (3, 4, 21). Therefore, it is unclear whether shopping at grocery stores is associated with a better nutrient profile of food purchases than is shopping at other types of stores and whether there are
1Supported by the Robert Wood Johnson Foundation (grants 67506,
68793, 70017, and 71837), the NIH (grants R01DK098072 and DK56350), the Carolina Population Center (grant P2C HD050924), and the Mexican Council “Consejo Nacional para la Ciencia y Tecnologia” (scholarship 309902; to DS).
2
Supplemental Materials 1 and 2 and Supplemental Tables 1–3 are avail-able from the “Online Supporting Material” link in the online posting of the article and from the same link in the online table of contents at http://ajcn. nutrition.org.
*To whom correspondence should be addressed. E-mail: [email protected]. Received August 18, 2015. Accepted for publication January 14, 2016. First published online February 24, 2016; doi: 10.3945/ajcn.115.121806.
differences by race-ethnicity. Moreover, evidence has suggested that people shop for food outside their residential neighbor-hoods (22, 23). In addition, food-environment studies have made inferences about the types of stores where people shop for food and associations with diet without directly linking the foods and beverages consumed to the stores where the foods and beverages were purchased (24). Another gap is that policy strategies that aimed to address food disparities were informed by studies that focused primarily on shopping at a single store rather than looking at the combination of stores where people shop for food. The objectives of this study were to examine whether the mix of food stores where people shop, which we refer to as food-shopping patterns, were associated with the nutrient profile of packaged food purchases (PFPs) and the types of foods and beverages purchased and to determine whether these associations differ across race-ethnicity. We hypothesized that households who primarily shop at chain grocery stores will have a better nutrient profile and a healthier mix of food and beverage purchases than if they shopped at other stores.
METHODS
Study design and population
We used PFP (i.e., all foods and beverages with barcode and nutrition information) data from the US National Consumer Panel data set from 2007 to 2012 (25), which was a longitudinal national survey of US households. Participating households were given bar-code scanners, and household members were instructed to scan the barcodes on all purchased items on returning home after every shopping trip. Scanning occurred continuously through the year and included products purchased from the following types of stores: warehouse clubs, mass merchandisers, supermarkets and groceries, convenience stores, drug stores, and dollar stores. The names of the stores were reported by participants.
The National Consumer Panel uses an open-cohort study design; households were allowed to exit the study at any time, and new households were enrolled to replace dropouts and rebalance the panel to match demographic and geographic targets and maintain national representativeness (26). For a household to be included in the panel, the household needed to report purchases for$10 mo. Demographic characteristics and household sizes were collected with the use of a questionnaire. From 2007 to 2012, the length of follow-up ranged from 10 mo to 6 y (mean: 3.1 y). Households were sampled from 76 markets, which were defined as 52 metropolitan and 24 nonmetropolitan geographical areas.
This study included households in the data set from 2007 to 2012 (n= 368,934 household-year observations). To ensure that we captured usual purchases, we excluded household-quarter observations that were deemed unreliable (i.e.,,$135 worth of PFPs in a 4-wk period for$2-member households and,$45 for single-member households) and household-year observations in-cluding more than one unreliable quarter, which resulted in the exclusion of 3.34% of household-year observations. The final analytic sample included 356,611 household-year observations.
Store-type categorization
For every shopping occasion made in a year, all households reported the names of the stores where they shopped for food.
We defined the store type as the different types of stores where each household reported purchasing food for each shopping occasion made in a year. We developed our own classification to categorize store types into 7 mutually exclusive categories as follows:1) warehouse club (e.g., Costco and Sam’s);2) mass merchandisers and supercenters [hereafter referred to as mass merchandisers (e.g., Walmart and Super Target)];3) grocery chains ($10 units; e.g., Kroger and Safeway);4) nonchain grocery stores (,10 units);5) convenience, drug, or dollar stores [here-after referred to as convenience stores (e.g., 7-Eleven, CVS, Dollar General, and gas stations]; 6) ethnic and specialty stores (e.g., Compare Foods and Whole Foods Market); and7) others stores (e.g., department stores and book stores) (27).
Nutrient information and food and beverage groups
To determine the nutritional content of household PFPs, each barcoded product captured in the National Consumer Panel was linked with Nutrition Facts Panel data. The methodology for this process has been described elsewhere (28, 29). Nonpackaged foods (i.e., foods without barcodes or without nutrition in-formation) were not included. Examples include loose produce, meats sold by weight, bakery items, and prepared foods. How-ever, produce and meats that were packaged were included (e.g., a bag of apples, a bagged salad, and frozen meats). Information on ingredient lists and product attributes for each barcoded product were used to categorize all foods and beverages pur-chased in the National Consumer Panel into 52 food and 14 beverage groups (26) (Supplemental Table 1).
Food-shopping patterns
We used a cluster analysis to group households by their food-shopping patterns. We defined food-food-shopping patterns as the mix of food stores where US households shop on the basis of the amount of PFPs by store type (30, 31). We ran a cluster analysis with the use of the volume of household PFPs by store type for every year. We entered the volume of PFPs as a percentage of the volume from each store type relative to the total volume of PFPs to account for the different amounts purchased at different store types (30). We performed a cluster analysis with the use of the SAS FASTCLUST procedure (SAS version 9.3; SAS Institute Inc.). Thisk-means procedure used Euclidean distances, which were computed from input variables, to assign a cluster mem-bership by minimizing the distance in members in a cluster while maximizing the distance between clusters in an iterative process with the use of 1000 replications and randomly selected seeds (32). Iterations that produced the largest R2 values in-dicated the best fit for the data and maximized the intercluster-to-intracluster variability ratio (32, 33). To determine the most appropriate number of clusters, we examined the pseudo–F statistic (34) for each number of cluster solutions, with increases from 2 to 5 clusters. A higher pseudo–F-statistic value indicated better intracluster homogeneity and intercluster heterogeneity. If the more complex cluster solution generated meaningful sub-groups, the more complex cluster solution was chosen as long as the pseudo–F-statistic value was comparable (35).
purchased the majority of their packaged foods and beverages at grocery chains (e.g., Kroger and Safeway);2) a primary mass-merchandiser cluster, which was characterized by households who purchased the majority of their packaged foods and bev-erages at mass merchandisers (e.g., Walmart and Super Target); and3) a combination cluster, which was characterized by house-holds who purchased their packaged foods and beverages at a combination of store types such as a warehouse club, an ethnic or specialty store, a nonchain grocery, a grocery chains, and a mass merchandiser (Table 1).
Covariates
The self-reported race-ethnicity of the household head was categorized as non-Hispanic white, Hispanic, non-Hispanic African American, or other Hispanic. Because other non-Hispanic represented a very heterogeneous group, results were not focused on this group. The ratio of the family income to the poverty threshold was calculated from the self-reported house-hold income and was used to categorize househouse-holds according to the percentage of the Federal Poverty Level as low (#185%), middle (.185% to ,400%), or high ($400%). The self-reported highest educational attainment of the male or female head of the household was categorized as less than high school, completed high school, some college, graduated from college, or postcollege graduate. We created household-composition vari-ables with the use of the number of males and females by the following age categories: 2–5, 6–12, 13–18, 19–29, 30–39, 40– 49, 50–59, 60–69, and $70 y. We created market year–level, store type–specific food and beverage price indexes to control for the fact that some store types may have offered the same products at lower prices (Supplemental Material 1). Con-sidering foods and beverages separately, we identified a standard basket of packaged foods and beverages that were sold across store types, markets, and years. With the use of information on prices paid by participant households, we cre-ated store type–market year–level food and beverage price indexes. The year and market were entered as a set of indicator variables.
Statistical analysis
All analyses were performed with the use of Stata 14 software (StataCorp LP). For descriptive analyses, we used survey com-mands to account for the study design and weighting to generate nationally representative results. We calculated univariate de-scriptive statistics for the total sample and by food shopping patterns from 2007 to 2012.
Outcome specification
As primary outcomes, we used continuous measures of the nutrient profile of household PFPs from foods and beverages separately as follows: energy density and nutrient density (g total sugars, mg Na, and g saturated fat) per 1000 g. As secondary outcomes, with foods and beverages considered separately, we used the proportion of calories from food groups relative to total food purchases and the proportion of calories from beverage groups relative to total beverage purchases. We used yearly mea-sures of purchases to better capture usual shopping habits.
Exposure specification
Our main exposures were food shopping patterns derived from the cluster analysis and included primary grocery, primary mass-merchandise, and combination clusters.
Model specification
We used longitudinal random-effects models (Supplemental Material 2) to investigate the association between food shop-ping patterns and the nutrient profile of total household PFPs and food and beverage groups purchased over the period studied. We used longitudinal random-effects models to account for the fact that we had multiple year observations per household. We estimated separate models for foods and beverages. To assess whether the association between food shopping patterns and the nutrient profile of household PFPs and food and beverage groups purchased differed by race-ethnicity or by income, we conducted Wald chunk tests for the joint significance of the income–food shopping pattern interaction terms and for the race-ethnicity–food shopping pattern interaction terms withP, 0.05 considered significant. All models were adjusted for the maximum level of education, income, household composition, store type–specific food and beverage price indexes, year, and market. To aid interpretability, we used the margins command in Stata to predict the mean6 SE energy and nutrient den-sities of PFPs and the mean6SE proportions of calories from key food and beverage groups for each food shopping pattern by race-ethnic group. These predictions were based on the model coefficients of the main exposures plus additional ad-justments performed in the model. Within each race-ethnicity group, we used the primary grocery cluster as the referent food shopping pattern. We tested for significant differences with the use of Student’sttests. A 2-sidedP= 0.001 was set to denote significance to account for multiple comparisons and a large sample size.
RESULTS
Sociodemographic characteristics
From 2007 to 2012, households from the National Consumer Panel were predominantly non-Hispanic white, highly educated, and in the middle- and upper-income categories. The average household size was,3 individuals, and the majority of house-holds were composed of only adults. The primary grocery cluster was the largest, whereas the other clusters each rep-resented approximately one-quarter of the population. Socio-demographic characteristics of the food shopping patterns varied by household income, race-ethnicity, and household education. Compared with the primary grocery cluster and the combination cluster, the shoppers in the primary mass-merchandiser cluster were more likely to have a low income and a lower educational distribution. Compared with the primary grocery cluster and the primary mass-merchandiser cluster, combination-cluster shop-pers were less likely to be non-Hispanic whites with a greater representation of Hispanics, non-Hispanic African Americans, and others (Table 1).
energy density of foods as the outcome (P-interaction = 0.002) in our fully adjusted model. We did not find a significant in-teraction between food shopping patterns and income in our fully adjusted model. Predicted probabilities of the adjusted model were similar to the unadjusted results; therefore, we only present adjusted model results. Because we were studying
many nutrient outcomes (i.e., energy and nutrient densities and percentages of kilocalories from food and beverage groups), to be consistent across models, we included the main effect for ethnicity and an interaction term between race-ethnicity and food shopping-pattern exposures in all models (Supplemental Tables 2 and 3).
TABLE 1
Volume by store type and sociodemographic characteristics by food shopping patterns of US households participating in the 2007–2012 National Consumer Panel1
Primary grocery
Primary mass
merchandiser Combination Total
Total households,n(%) 182,345 (51.1) 80,855 (22.7) 93,411 (26.2) 356,611 Volume of household PFPs2by store type,3%
Warehouse club 4.6 4.3 21.2 8.9
Convenience store 4.1 3.3 7.6 4.9
Ethnic/specialty 0.8 1.4 13.7 4.3
Grocery chain 76.0 18.0 21.1 48.5
Mass merchandiser 9.5 67.3 12.0 23.2
Nonchain grocery 2.3 3.3 15.2 5.9
Others 2.6 2.3 9.2 4.3
Household income,4n(%)
Low 33,215 (18.2) 18,405 (22.8) 16,196 (17.3) 67,816 (19.0) Middle 76,839 (42.1) 37,900 (46.9) 38,468 (41.2) 153,207 (43.0) High 72,291 (39.7) 24,550 (30.3) 38,747 (41.5) 135,588 (38.0) Household race-ethnicity,5n(%)
Non-Hispanic white 151,231 (82.9) 68,874 (85.2) 71,656 (76.7) 291,761 (81.8)
Hispanic 8898 (4.9) 3107 (3.8) 6083 (6.5) 18,088 (5.1)
Non-Hispanic African American 14,868 (8.2) 6214 (7.7) 9907 (10.6) 30,984 (8.7) Non-Hispanic other 7348 (4.0) 2660 (3.3) 5765 (6.2) 15,773 (4.2) Household education,6n(%)
Less than high school 2231 (1.2) 1181 (1.5) 1137 (1.2) 4549 (1.9) Graduated from high school 31,233 (17.1) 16,864 (20.9) 13,871 (14.9) 61,968 (17.38) Some college 52,406 (28.7) 26,086 (32.3) 27,086 (29.0) 105,578 (29.6) Graduated from college 64,502 (35.4) 26,646 (33.0) 33,287 (35.6) 124,435 (34.9) Postcollege graduate 31,973 (17.5) 10,078 (12.5) 18,030 (19.3) 60,081 (16.85) Household type,7n(%)
Single 50,571 (27.7) 18,503 (22.9) 23,713 (25.4) 92,787 (26.0) Adults, no kids 89,376 (49.0) 40,783 (50.4) 48,909 (52.4) 179,068 (50.2) Adult(s) and kid(s) 42,398 (23.3) 21,569 (26.7) 20,789 (22.3) 84,756 (23.8)
Household size,8n 2.3 2.4 2.3 2.4
1Data are from the 2007–2012 National Consumer Panel of household PFPs. The volume of household PFPs by store
type for the total sample and by food-shopping patterns is presented as the proportion of PFPs from a given store type relative to the total household PFPs over the period studied. The proportion of the number of households by food-shopping patterns is presented as row percentages. Household socioeconomic values for the total sample and by food-shopping patterns are presented as counts and column percentages, and the household size is presented as means. Calculations based in part on data reported by Nielsen through its Homescan Services (The Nielsen Company) for the food and beverage categories.
2
PFP, packaged food purchase.
3
We defined food shopping patterns as the combinations of store types that US households use to shop for food on the basis of the volume from PFPs by store type. We found 3 food-shopping patterns or clusters as follows:1) a primary grocery cluster, which was characterized by households purchasing the majority (w80%) of their packaged foods and beverages at grocery chains (e.g., Kroger and Safeway);2) a primary mass-merchandiser cluster, which was characterized by households purchasing the majority (w70%) of their packaged foods and beverages at mass merchandisers (e.g., Walmart and Super Target); and3) a combination cluster, which was characterized by households purchasing their packaged foods and beverages at a combination of store types such as grocery chains, mass merchandisers, warehouse clubs (e.g., Costco and Sam’s), and convenience stores (e.g., 7-Eleven and Walgreens).
4Ratio of family income to poverty threshold, which was calculated from self-reported household income, was used to
categorize income according to the percentage of the Federal Poverty Level [low (#185%), middle (.185% to,400%), or high ($400%)].
5Self-reported race-ethnicity of the household head. 6Household self-reported highest educational attainment.
7Children were all household members#18 y old. Adults were all household members.18 y old. 8
Associations between food shopping patterns and household PFPs
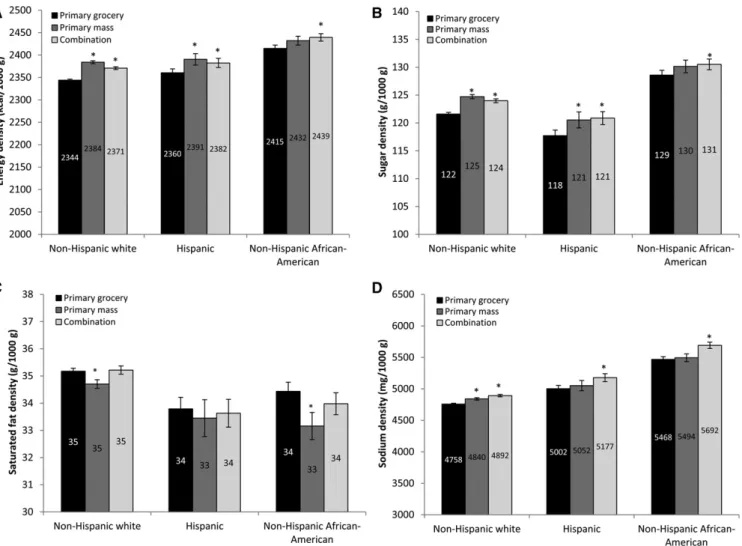
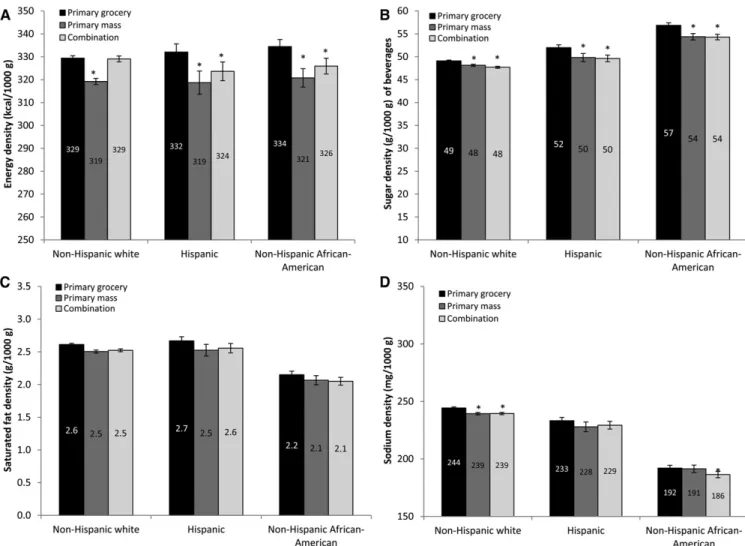
With foods and beverages considered separately, Figure 1 shows the nutrient profile of packaged foods by food shopping patterns across racial-ethnic groups. After adjustment for con-founders, we showed no nutritionally meaningful differences in energy, sugar, saturated fat, and sodium densities in food-shopping patterns overall despite some statistically signifi-cant differences. In addition, within racial-ethnic groups, we did not show differences in the relation between food shopping patterns and the nutritional profiles of foods purchased. Similar results were seen for the nutrient profiles of packaged beverages (Figure 2). Table 2 shows the mean proportion of calories purchased from key food and beverage groups by food shopping
patterns across racial-ethnic groups. Overall, after adjustment for confounders, we showed that food shopping patterns were not associated with differences in the proportion of calories purchased from key food and beverage groups across racial-ethnic groups. In other words, each racial-ethnic group purchased similar distri-butions of products regardless of where they shopped.
Racial-ethnic differences in the associations between food shopping patterns and household PFPs
Across the different food-shopping patterns, non-Hispanic African American households purchased packaged foods with higher energy, sugar, and sodium densities than did non-Hispanic white and Hispanic households. The saturated fat content of
packaged foods purchases did not appear to be higher in non-Hispanic African Americans than in non-non-Hispanic white and Hispanic households (Figure 1). In terms of beverage purchases, across the different food-shopping patterns, non-Hispanic Afri-can AmeriAfri-can households purchased packaged beverages with a higher sugar density and lower sodium density than did non-Hispanic white and Hispanic households (Figure 2). The different racial-ethnic groups purchased similar proportions of calories from food groups across the different food-shopping patterns. However, for beverage groups, the contribution of calories from sugar-sweetened beverages (SSBs) and fruit juices to total calories from beverages purchased across food shopping patterns was higher for non-Hispanic African American house-holds than for non-Hispanic white and Hispanic househouse-holds.
Non-Hispanic African American households also purchased a lower proportion of calories from plain milk (i.e., unsweetened and unflavored whole and low-fat milk) across food shopping patterns than did non-Hispanic white and Hispanic households (Table 2).
DISCUSSION
Our results suggest that, in the National Consumer Panel sample, shopping primarily at grocery chains was not associated with a better nutrient profile of household PFPs or food and beverage groups purchased than was shopping primarily at a mass merchandiser or a combination of small and large stores. From the perspective of the supply side, one study suggested that the
poor diets of many racial-ethnic groups are attributable to limited access to stores that sell healthy foods, especially grocery stores or supermarkets (37). Our study allowed us to examine a met-ric that reflected both the availability and demand. We showed that, no matter what food shopping pattern different racial-ethnic groups used, the nutrient profile of their purchases and what foods and beverages they purchased were very similar. In fact, households purchased the same proportion of calories from, e.g., salty snacks, grain-based desserts, candy, processed meat, and SSBs regardless of where they shopped. As other authors have
pointed out, the availability (38) and in-store marketing strategies (39) of less-healthy foods might be a stronger determinant of what is purchased rather than the availability of healthy foods.
Studies have suggested that, within a given store type, stores located in predominantly African American and lower-income neighborhoods have less availability of healthy foods (24) or a lower relative availability of healthier food alternatives (40) than do similar stores located in predominantly white and higher-income neighborhoods. However, a recent study (41) showed that, even when looking at purchases from the same store, low-income
TABLE 2
Predicted adjusted proportion of calories purchased from key food and beverage groups by food shopping pattern across racial-ethnic groups: the National Consumer Panel 2007–20121
Non-Hispanic white Hispanic Non-Hispanic African American
Primary grocery
Primary mass
merchandiser Combination
Primary grocery
Primary mass
merchandiser Combination
Primary grocery
Primary mass
merchandiser Combination
Food
Salty snacks 9.660.0 9.760.0 9.660.0 9.260.1 9.560.1 9.360.1 9.060.1 9.360.1 9.160.1 Breads and tortillas 7.960.0 7.760.0 7.760.0 8.960.1 8.560.1 8.560.1 7.360.0 7.160.1 7.060.0 Grain-based desserts 9.460.0 9.760.0 9.360.0 8.860.1 9.260.1 8.960.1 8.460.1 8.860.1 8.460.1 Candy and sweet snacks 6.260.0 6.760.0 6.860.0 5.560.1 6.260.1 6.060.1 5.060.1 5.460.1 5.660.1 Cheese 4.460.0 4.360.0 4.460.0 4.260.0 4.060.1 4.160.0 3.160.0 3.060.0 3.060.0 Processed meat 3.060.0 3.160.0 2.960.0 3.260.0 3.260.0 3.060.0 4.060.0 3.960.0 3.960.0 Vegetables
Unsweetened/unflavored 0.560.0 0.560.0 0.660.0 0.560.0 0.560.0 0.560.0 0.560.0 0.560.0 0.560.0 Canned 0.560.0 0.560.0 0.560.0 0.560.0 0.560.0 0.560.0 0.460.0 0.360.0 0.460.0 Nuts and nut butters,
sweetened/flavored
4.260.0 4.460.0 4.760.0 3.660.1 3.960.1 4.160.1 3.360.0 3.460.1 3.760.1
Ready-to-eat cereal 4.660.0 4.660.0 4.660.0 4.660.0 4.660.1 4.560.1 4.060.0 4.260.1 4.060.1 Beverage
SSBs 26.960.1 27.860.1 26.760.1 29.260.3 29.160.4 28.660.3 37.360.2 37.260.3 37.360.3 Plain milk 36.660.1 36.460.1 35.560.1 34.560.3 34.260.4 34.260.3 24.160.2 24.360.3 22.960.3 Fruit juices 12.560.0 12.160.01 12.160.1 13.660.2 13.760.3 13.560.2 16.860.1 16.960.2 16.960.2
1All values are predicted means6SEs. Data are from the 2007–2012 National Consumer Panel of household packaged food purchases (n= 356,611
households purchased foods that were less healthful than those purchased by high-income households. The relation between the food environment and people’s diet quality is complex and likely to be bidirectional. In addition, food preferences, budget constraints, differences in price sensitivities, car owner-ship, and food marketing likely influence food-shopping behav-iors. Moreover, qualitative research suggests that efforts to improve neighborhood food environments should address not only food availability and prices but also the physical and social barriers such as unfair treatment, deteriorated conditions, and a lack of safety at stores (42).
One of our key findings is that, even after different food shopping patterns are accounted for, there are race-ethnic dif-ferences in the nutritional profiles of PFPs. Specifically, across the 3 food shopping patterns, non-Hispanic African American households purchased foods with higher energy, total sugar, and sodium densities than did non-Hispanic white and Hispanic households. Non-Hispanic African American households also purchased a higher proportion of beverage calories from SSBs and juice drinks and fewer calories from plain milk. In terms of food groups, we showed no differences. The heterogeneity within food groups is a possible explanation for the observed differences in the nutrient profile of foods purchased but not in the food groups purchased by non-Hispanic African American households compared with other race-ethnic groups. It is possible that dif-ferent racial-ethnic groups purchased foods with better nutrient profiles (e.g., regular- compared with low-sodium canned vege-tables) or purchased different types of products within the same food group (e.g., potato chips compared with pretzels). Overall, our race-ethnic findings suggest that cultural factors, taste prefer-ences, and economic and time constraints might be more in-fluential to the nutrient profile of purchases and what foods and beverages people purchase than are shopping patterns. Therefore, additional actions need to be considered to improve the quality and types of foods and beverages purchased regardless of the store type, especially for non-Hispanic African Americans.
A major strength of our study is that it measured where households actually shopped for food as well as the foods and beverages purchased there. In addition, the study links PFPs to high-quality nutritional information. Moreover, the large samples of racial-ethnic minorities allowed us to study racial-ethnic differences regarding where households shopped for food and what they purchased. In addition, our analysis was focused at the household level, which is the primary unit at which food pur-chases are directed. Finally, we collected data for household PFPs during the course of an entire year, which reflected the usual purchases of households.
A key limitation of our study is that the location where in-dividuals choose to shop for food is a result of an individual choice and is a complex decision affected by many factors, both observable and unobservable, that overlap with the purchase decision. For example, product, price, promotion, and placement influence food-purchasing decisions (43–47) along with indi-vidual food preferences (48), transportation, and time (49, 50). These factors are known as self-selection (51), and although these are different types of selection mechanisms, at the end, the choice of where consumers shop for food (i.e., the type of store) and what foods and beverages they purchase are nonrandom. Because of these self-selection mechanisms, we expected an upward bias in the association between the primary
grocery-shopping pattern and the nutrient profile of PFPs. In other words, individuals who are highly motivated to eat a healthy diet may also be more likely to go to a store where they can purchase healthier foods and beverages. However, even with this hypoth-esized upward bias, we did not observe meaningful differences in the nutrient profiles of PFPs and what foods and beverages people purchased by food shopping patterns.
Our analysis focused on the calories, total sugars, saturated fat, and sodium of PFPs and not on consumption. In addition, these components did not capture all aspects of foods and beverages that affect dietary quality or health. Another limitation was our lack of food-purchase data for foods without barcodes or those that were not required to have Nutrition Facts Panel information. If differences in the nutrient profile of purchases across store types are due only to differences in purchases of fresh produce and other nonpackaged foods, these items that were missing from our study might explain the lack of association between food shopping patterns and the nutrient profile of purchases observed in our study.
Households who participated in the National Consumer Panel were required to scan all groceries at home. The process of recording might have been time consuming, which could have resulted in an underreporting of data. This outcome would have been a problem if households systematically and differently underreported PFPs from a specific store type or if misreporting differed by sociodemographic characteristics. In addition, we had access only to data for the products actually purchased by each household in a given store, and not the full variety of products offered at the store (41).
The National Consumer Panel sample does not perfectly match the US population on the basis of demographic characteristics. Despite the large sample size, households with low education and low income who were willing to participate in the panel may have shopped at stores with a greater availability of healthy foods and may have had greater access to higher-quality stores than did low-income households in the United States in general. Therefore, these results may not be generalizable to the US population.
In conclusion, we observed no meaningful differences in the nutrient profiles of purchased packaged foods and beverages and the food and beverage groups purchased by food shopping patterns. These null findings were consistent across racial-ethnic groups. However, non-Hispanic African Americans had a lower nutrient quality of foods purchased than did non-Hispanic whites and Hispanic households. Overall, the ubiquity of unhealthy packaged foods and beverages that are high in sugars, sodium, and fat, regardless of the store type, may thwart efforts to improve eating habits. In addition, policy initiatives that focus on in-creasing physical access to stores or helping stores sell healthier products to encourage healthier purchases may be ineffective because other factors may be more important determinants of food and beverage purchases than where people shop or what is available in the store.
We thank David K Guilkey for his contributions to reviewing and improv-ing this work, Donna Miles and Kuo-Pimprov-ing Li for exceptional assistance with the data management, and Emily Yoon for substantive and administrative as-sistance.
feedback on the manuscript development; and all authors: had primary re-sponsibility for the final content of the manuscript. None of the authors reported a conflict of interest related to the study.
REFERENCES
1. Satia JA. Diet-related disparities: understanding the problem and ac-celerating solutions. J Am Diet Assoc 2009;109:610–5.
2. Wang DD, Leung CW, Li Y, Ding EL, Chiuve SE, Hu FB, Willett WC. Trends in dietary quality among adults in the United States, 1999 through 2010. JAMA Intern Med 2014;174:1587–95.
3. Morland K, Wing S, Diez Roux A, Poole C. Neighborhood charac-teristics associated with the location of food stores and food service places. Am J Prev Med 2002;22:23–9.
4. Powell LM, Slater S, Mirtcheva D, Bao Y, Chaloupka FJ. Food store availability and neighborhood characteristics in the United States. Prev Med 2007;44:189–95.
5. Moore LV, Diez Roux AV. Associations of neighborhood characteris-tics with the location and type of food stores. Am J Public Health 2006; 96:325–31.
6. Zenk SN, Schulz AJ, Israel BA, James SA, Bao S, Wilson ML. Neighborhood racial composition, neighborhood poverty, and the spatial accessibility of supermarkets in metropolitan Detroit. Am J Public Health 2005;95:660–7.
7. Cummins S, Macintyre S. Food environments and obesity–neighbourhood or nation? Int J Epidemiol 2006;35:100–4.
8. Story M, Kaphingst KM, Robinson-O’Brien R, Glanz K. Creating healthy food and eating environments: policy and environmental ap-proaches. Annu Rev Public Health 2008;29:253–72.
9. Executive Office of the President of the United States, White House Task Force on Childhood Obesity. Solving the problem of childhood obesity in a generation: report to the president [Internet]. Washington (DC): Executive Office of the President of the United States in Washington DC. 2010 [cited 2014 Sep 29]. Available from: http:// www.letsmove.gov/sites/letsmove.gov/files/TaskForce_on_Childhood_ Obesity_May2010_FullReport.pdf.
10. The White House, Office of the First Lady. First Lady Michelle Obama announces nationwide commitments to provide millions of people access to healthy, affordable food in underserved communities. [In-ternet]. Washington (DC): The White House, Office of the First Lady in Washington DC. 2011 [cited 2014 Sep 29 ]. Available from: http:// www.whitehouse.gov/the-press-office/2011/07/20/first-lady-michelle-obama-announces-nationwide-commitments-provide-milli.
11. Food Policy Task Force by the New York City Departments of Health and City Planning and the New York City Economic Development Corporation. Food Retail Expansion to Support Health (FRESH) pro-gram [Internet]. New York: Mayor’s Food Policy Task Force in New York City. 2013 [cited 2014 Sep 29]. Available from: http://www.nyc. gov/html/misc/pdf/going_to_market.pdf.
12. The Healthy Food Financing Initiative (HFFI). An innovative public-private partnership sparking economic development and improving health [Internet]. Washington (DC): Obama Administration in Wash-ington DC. 2014 [cited 2014 Sep 29]. Available from: http://www. healthyfoodaccess.org/sites/default/files/updated-hffi-fact-sheet.pdf. 13. Zenk SN, Schulz AJ, Hollis-Neely T, Campbell RT, Holmes N, Watkins
G, Nwankwo R, Odoms-Young A. Fruit and vegetable intake in African Americans income and store characteristics. Am J Prev Med 2005;29:1–9. 14. Elbel B, Moran A, Dixon LB, Kiszko K, Cantor J, Abrams C, Mijanovich T. Assessment of a government-subsidized supermarket in a high-need area on household food availability and children’s dietary intakes. Public Health Nutr 2015;18:2881–90.
15. Wang MC, MacLeod KE, Steadman C, Williams L, Bowie SL, Herd D, Luluquisen M, Woo M. Is the opening of a neighborhood full-service grocery store followed by a change in the food behavior of residents? J Hunger Environ Nutr 2007;2:3–18.
16. Cummins S, Flint E, Matthews SA. New neighborhood grocery store increased awareness of food access but did not alter dietary habits or obesity. Health Aff (Millwood) 2014;33:283–91.
17. Dubowitz T, Ghosh-Dastidar M, Cohen DA, Beckman R, Steiner ED, Hunter GP, Florez KR, Huang C, Vaughan CA, Sloan JC, et al. Diet and perceptions change with supermarket introduction in a food desert, but not because of supermarket use. Health Aff (Millwood) 2015;34: 1858–68.
18. Morland K, Wing S, Diez Roux A. The contextual effect of the local food environment on residents’ diets: the atherosclerosis risk in com-munities study. Am J Public Health 2002;92:1761–7.
19. Drewnowski A, Aggarwal A, Hurvitz PM, Monsivais P, Moudon AV. Obesity and supermarket access: proximity or price? Am J Public Health 2012;102:e74–80.
20. Jiao J, Moudon AV, Ulmer J, Hurvitz PM, Drewnowski A. How to identify food deserts: measuring physical and economic access to su-permarkets in King County, Washington. Am J Public Health 2012; 102:e32–9.
21. Morland K, Diez Roux AV, Wing S. Supermarkets, other food stores, and obesity: the atherosclerosis risk in communities study. Am J Prev Med 2006;30:333–9.
22. LeDoux TF, Vojnovic I. Going outside the neighborhood: the shopping patterns and adaptations of disadvantaged consumers living in the lower eastside neighborhoods of Detroit, Michigan. Health Place 2013; 19:1–14.
23. Hillier A, Cannuscio CC, Karpyn A, McLaughlin J, Chilton M, Glanz K. How far do low-income parents travel to shop for food? Empirical evidence from two urban neighborhoods. Urban Geogr 2011;32: 712–29.
24. Franco M, Diez-Roux AV, Nettleton JA, Lazo M, Brancati F, Caballero B, Glass T, Moore LV. Availability of healthy foods and dietary pat-terns: the Multi-Ethnic Study of Atherosclerosis. Am J Clin Nutr 2009; 89:897–904.
25. The Nielsen Co. Nielsen Consumer Panel and retail measurement. [Internet]. United States: The Nielsen Company. [cited 2014 Sep 29]. Available from: http://www.nielsen.com/content/corporate/us/en/ solutions/measurement/retail-measurement.html.
26. Poti JM, Mendez MA, Ng SW, Popkin BM. Is the degree of food processing and convenience linked with the nutritional quality of foods purchased by US households? Am J Clin Nutr 2015;101: 1251–62.
27. Stern D, Ng SW, Popkin BM. The nutrient content of US household food purchases by store type. Am J Prev Med 2016;50:180–90. 28. Ng SW, Popkin BM. Monitoring foods and nutrients sold and
con-sumed in the United States: dynamics and challenges. J Acad Nutr Diet 2012;112:41–5.e4.
29. Ng SW, Slining MM, Popkin BM. Use of caloric and noncaloric sweeteners in US consumer packaged foods, 2005-2009. J Acad Nutr Diet 2012;112:1828–34.e1–6.
30. Carlson A, Kinsey J, Nadav C. Consumers’ retail source of food: a cluster analysis. Fam Econ Rev 2002;14:11–20.
31. Carlson A, Gerrior S. Food source makes a difference in diet quality. J Nutr Educ Behav 2006;38:238–43.
32. Zubair N, Kuzawa CW, McDade TW, Adair LS. Cluster analysis re-veals important determinants of cardiometabolic risk patterns in Fili-pino women. Asia Pac J Clin Nutr 2012;21:271–81.
33. Poti JM, Duffey KJ, Popkin BM. The association of fast food con-sumption with poor dietary outcomes and obesity among children: is it the fast food or the remainder of the diet? Am J Clin Nutr 2014;99: 162–71.
34. Calinski T, Harabasz J. A dendrite method for cluster analysis. Com-mun Stat Theory Methods 1974;3:1–27.
35. Smith LP, Ng SW, Popkin BM. No time for the gym? Housework and other non-labor market time use patterns are associated with meeting physical activity recommendations among adults in full-time, seden-tary jobs. Soc Sci Med 2014;120:126–34.
36. Stern D, Robinson WR, Ng SW, Gordon-Larsen P, Popkin BM. US household food shopping patterns: dynamic shifts since 2000 and so-cioeconomic predictors. Health Aff (Millwood) 2015;34:1840–8. 37. Treuhaft S, Karpyn A. The grocery gap: who has access to healthy food
and why it matters: PolicyLink; 2010.
38. Bodor JN, Rose D, Farley TA, Swalm C, Scott SK. Neighbourhood fruit and vegetable availability and consumption: the role of small food stores in an urban environment. Public Health Nutr 2008;11: 413–20.
39. Ghosh-Dastidar B, Cohen D, Hunter G, Zenk SN, Huang C, Beckman R, Dubowitz T. Distance to store, food prices, and obesity in urban food deserts. Am J Prev Med 2014;47:587–95.
41. Handbury J, Rahkovsky I, Schnell M. What drives nutritional dispar-ities? Retail access and food purchases across the socioeconomic spectrum. No. w21126. National Bureau of Economic Research; 2015. 42. Zenk SN, Odoms-Young AM, Dallas C, Hardy E, Watkins A, Hoskins-Wroten J, Holland L. “You have to hunt for the fruits, the vegetables”: environmental barriers and adaptive strategies to acquire food in a low-income African American neighborhood. Health Educ Behav 2011;38: 282–92.
43. Cheadle A, Psaty BM, Curry S, Wagner E, Diehr P, Koepsell T, Kristal A. Community-level comparisons between the grocery store environ-ment and individual dietary practices. Prev Med 1991;20:250–61. 44. Andreyeva T, Long MW, Brownell KD. The impact of food prices on
consumption: a systematic review of research on the price elasticity of demand for food. Am J Public Health 2010;100:216–22.
45. Childs NM. In-store marketing to children: US food retailer practices abating childhood obesity. Portuguese Journal of Marketing 2012;27:78.
46. Nestle M. Food marketing and childhood obesity—a matter of policy. N Engl J Med 2006;354:2527–9.
47. Glanz K, Bader MD, Iyer S. Retail grocery store marketing strategies and obesity: an integrative review. Am J Prev Med 2012;42:503–12. 48. Walker RE, Keane CR, Burke JG. Disparities and access to healthy
food in the United States: a review of food deserts literature. Health Place 2010;16:876–84.
49. Hirsch JA, Hillier A. Exploring the role of the food environment on food shopping patterns in Philadelphia, PA, USA: a semiquantitative comparison of two matched neighborhood groups. Int J Environ Res Public Health 2013;10:295–313.
50. Krukowski RA, Sparks C, DiCarlo M, McSweeney J, West DS. There’s more to food store choice than proximity: a questionnaire development study. BMC Public Health 2013;13:586.