See related Commentary on page 469
Multi-Institutional FASTQ File Exchange as a
Means of Pro
fi
ciency Testing for Next-Generation
Sequencing Bioinformatics and Variant Interpretation
Kurtis D. Davies,*Midhat S. Farooqi,yMike Gruidl,zCharles E. Hill,xJulie Woolworth-Hirschhorn,{Heather Jones,x
Kenneth L. Jones,kAnthony Magliocco,zMidori Mitui,yPhilip H. O’Neill,kRebecca O’Rourke,kNirali M. Patel,**Dahui Qin,z Erica Ramos,yMichael R. Rossi,xThomas M. Schneider,xGeoffrey H. Smith,xLinsheng Zhang,xJason Y. Park,yand
Dara L. Aisner*
From the Departments of Pathology* and Biochemistry and Molecular Genetics,kUniversity of ColoradoeAnschutz Medical Campus, Denver, Colorado; the Department of Pathology,yChildren’s Health & UT Southwestern Medical Center, Dallas, Texas; the Pathology Department,zH. Lee Moffitt Cancer Center, Tampa, Florida; the Department of Pathology and Laboratory Medicine,xEmory University School of Medicine, Atlanta, Georgia; the Department of Pathology and Laboratory Medicine,{Medical University of South Carolina, Charleston, South Carolina; and the Department of Pathology and Laboratory Medicine,** University of North Carolina School of Medicine, Chapel Hill, North Carolina
Accepted for publication March 14, 2016.
Address correspondence to Dara L. Aisner, M.D., Ph.D., Department of Pathology, Uni-versity of ColoradoeAnschutz Medical Campus, 12631 E. 17th Ave., Mail Stop B-216, L15-2215, Aurora, CO 80045. E-mail:dara.aisner@ucdenver. edu.
Next-generation sequencing is becoming increasingly common in clinical laboratories worldwide and is revolutionizing clinical molecular testing. However, the large amounts of raw data produced by next-generation sequencing assays and the need for complex bioinformatics analyses present unique chal-lenges. Proficiency testing in clinical laboratories has traditionally been designed to evaluate assays in their entirety; however, it can be alternatively applied to separate assay components. We developed and implemented a multi-institutional proficiency testing approach to directly assess custom bioinformatics and variant interpretation processes. Six clinical laboratories, all of which use the same commercial library preparation kit for next-generation sequencing analysis of tumor specimens, each submitted raw data (FASTQfiles) from four samples. These 24file sets were then deidentified and redistributed tofive of the institutions for analysis and interpretation according to their clinically validated approach. Among the laboratories, there was a high rate of concordance in the calling of single-nucleotide variants, in particular those we considered clinically significant (100% concordance). However, there was significant discordance in the calling of clinically significant insertions/deletions, with only two of seven being called by all participating laboratories. Missed calls were addressed by each laboratory to improve their bioinformatics processes. Thus, through our alternative proficiency testing approach, we identified the bioinformatic detection of insertions/deletions as an area of particular concern for clinical laboratories performing next-generation sequencing testing.(J Mol Diagn 2016, 18: 572e579; http://dx.doi.org/10.1016/j.jmoldx.2016.03.002)
As the number of genetic alterations with known predictive, prognostic, or diagnostic clinical significance increases, there is an increasing need for robust clinical assays that detect multiple alterations simultaneously.1Next-generation sequencing (NGS) technology is uniquely positioned to meet this increasing demand attributable to the ability to generate nucleic acid sequence data on multiple analytes in parallel, with the potential for high clinical throughput. As a result, NGS is becoming the platform of choice in many clinical settings. However, in contrast to traditional genetic
assays that are designed to detect only one or a few genetic variants, NGS assays involve multifaceted workflows and produce massive amounts of raw data that require complex bioinformatics (BI) handling and analysis.
Supported by institutional funding with additional support provided by the Colorado Center for Personalized Medicine (University of Colorado).
K.D.D. and M.S.F. contributed equally to this work.
J.Y.P. and D.L.A. contributed equally to this work as senior authors. Disclosures: D.L.A. has received consulting fees from Oxford Oncology and Casdin Capital and honoraria from AstraZeneca and Clovis Oncology.
NGS testing of clinical samples is typically divided into several distinct subprocesses. Initially, evaluation of the specimen by a pathologist often guides enrichment of the desired tissue type, which is then subjected to nucleic acid extraction. Extracted nucleic acids are then made ready for sequencing through various library preparation techniques, with libraries subsequently being quantified and pooled accordingly. Pooled libraries are then sequenced on an NGS sequencing instrument via unique chemical processes, depending on the platform. Sequencing is followed by a highly computationally dependent workflow that includes conversion of raw signals to base calls and short sequence reads (usually performed by on-instrument software), demultiplexing of pooled data (also typically by on-instrument software), alignment/mapping of the reads to the reference genome, calling of variants that differ from the reference genome, and annotation of the identified vari-ants.2,3 Involved in all of these computational steps are filters and quality control (QC) cutoffs that remove poor quality data and reject data deemed to be erroneous or artifactual. This system of BI tools and QC measures is often called the BI pipeline, and it can vary markedly among laboratories owing to the different software components used for each step, customization of these programs, and the different QC metrics used. Finally, the large amount of variant data produced is often manually interpreted with the aid of available databases and other resources, and, again, these manual steps can be dissimilar among different laboratories. Validation of the postsequencing processes (computational and interpretation steps) is part of any NGS assay validation; however, external metrics for assuring quality of BI pipelines and interpretation procedures can be challenging to identify. Nevertheless, it is critical that the performance of postsequencing steps is evaluated as part of ongoing laboratory quality management.3
Proficiency testing (PT) is a vital aspect of clinical lab-oratory quality management.4Although PT is common for wet-bench procedures and usually includes the entire assay process, it is less widespread for the postsequencing steps of NGS because of the nascent nature of this technology.5We determined the feasibility of a postsequencing-focused PT approach and assessed differences in the performance of BI pipelines and interpretative processes used by different in-stitutions. Twenty-four raw data (FASTQ) file sets gener-ated by NGS analysis of samples processed using a common library preparation kit were aggregated, deidentified, and distributed to five institutions. These files were then analyzed by each institution’s validated postsequencing procedures, and each institution reported variants as they would for a clinical case. Concordance offindings was then assessed and discordant variants explored further. The identification of single-nucleotide variants (SNVs), in particular those that are clinically significant (cs-SNVs), was concordant among all institutions, with highly consistent reported variant allele frequencies (VAFs). However, the identification of clinically significant insertions/deletions
(cs-indels) was substantially less concordant, with many instances of such variants being missed by some BI pipe-lines. Thus, we demonstrate the feasibility of FASTQ file exchange as a means of performing PT and highlight key areas of concern for clinical BI pipelines.
Materials and Methods
Study Sites
All six clinical laboratories that participated in this study are Clinical Laboratory Improvement Amendments certified (Centers for Medicare & Medicaid Services) and accredited by the College of American Pathologists (CAP). The sequencing assay examined in this study was independently validated and implemented by each laboratory. All labora-tories registered their NGS activity with CAP.
Library Preparation
The TruSight Tumor (TST) library preparation kit (Illumina, San Diego, CA) was separately clinically validated and implemented by all institutions in this study. TST is an amplicon-based assay designed to selectively amplify hot-spots, exons, or entire coding regions of 26 genes important for prognosis or therapy selection for patients with cancer. Each amplicon is generated via an extension-ligation process that links two primers that are complimentary to the same strand. The assay uses a dual strand approach by which both strands of every region of interest are amplified in separate library preparations, giving rise to two pools: A and B. These pools are uniquely indexed and can be distinguished from each other on the sequencing run. The presence of a variant in both pools increases the reliability of the variant calls and aids infiltering out artifacts (eg, those due to formalinfixation or PCR errors). All sites performed sequencing on the Illumina MiSeq instrument using V2 sequencing chemistry and paired-end 121-bp reads. FASTQ files were generated via on-board MiSeq Control software versions 2.0, 2.0.5, and 2.5.0.5 (Illumina), and MiSeq Reporter software versions 2.3, 2.4.1.3, 2.4.6, and 2.5.1.3 (Illumina).
File Submission, Redistribution, and Analysis
indicated the sample type (eg, formalin-fixed, paraffi n-embedded), tumor histology, tumor location, estimated sample tumor percentage, and percentage of necrosis for each sample. The 24 FASTQfile sets (96 totalfiles because each case was represented by A and B pools and each pool represented by R1 and R2 reads) were deidentified by an individual not associated with this project and then redis-tributed via the secure File Transfer Protocol site along with a reporting template that listed the sample-specific infor-mation stated above (including whether thefile set was from a calibrator/reference sample). One site (site 6), which contributed two of the indel cases, including the EGFR
duplication and theERBB2duplication, was not equipped to analyze externally provided FASTQ files and did not participate in any of the analytical components of this study. Thefive participating institutions were asked to analyze all thefiles (including thefiles, now deidentified, that they had submitted) via their own BI pipeline and to report all vari-ants that would be reported for a clinical case. Participvari-ants were also asked to provide their determined VAF for each identified variant, regardless of whether this is part of their usual reporting practice. A summary of all reported variants per sample was then generated and redistributed to the sites, which were then asked to provide an explanation for every
Table 1 Survey Characteristics
Characteristic
Site
1 2 3 4 5 6*
Samples perflow cell (combined A and B pools)
8 4 8 maximum 10 2e10 Up to 13
Required minimum depth of coverage (combined pools)
500 1000 2000 1000 1000 1000
VAF cutoff for inclusion in report
5%y 5% 3%y 5% 5% 5%
Indel size limit (bp) 40 Not determined 15 Not determined 30 25 Alignment software GSNAP version
7.20.2012
NextGENe version 2.4.1
(SoftGenetics, State College, PA), MiSeq Reporter version 2.4.60
NovoAlign version 3.02.00 (NovoCraft Technologies, Selangor, Malaysia)
BWA-MEM version 0.7.12 (Broad Institute, Cambridge, MA)
NextGENe version 2.4.1, MiSeq Reporter version 2.4.1.3
MiSeq Reporter version 2.3
Variant calling software
Freebayes version 0.9.14
NextGENe version 2.4.1, MiSeq Reporter version 2.4.60
SNVseVarScan version 2.3.6 (Washington University, St. Louis, MO) IndelseFreebayes
version 0.9.7
GATK version 3.4 (Broad Institute)
NextGENe version 2.4.1, MiSeq Reporter version 2.4.1.3
MiSeq Reporter version 2.3
Variant annotation ANNOVAR version 10.23.2012, dbNSFP version 2.0b4
Geneticist Assistant version 1.1.5 (Softgenetics)
Clinical Genomicist Workstation version 2.1.3 (PerianDX, St. Louis, MO)
ANNOVAR version 3.22.15
Variant Studio version 2.1 (Illumina), NextGENe version 2.4.1
Variant Studio version 2.1
Databases for variant interpretation
COSMIC, ClinVar, My Cancer Genome, cBioPortal, MD Anderson PCT, CanDL
HGMD, COSMIC, My Cancer Genome, ClinVar
COSMIC, ClinVar, Clinical Genomicist Workstation
COSMIC, cBioPortal, My Cancer Genome, ClinVar
HGMD, COSMIC, My Cancer Genome, ClinVar
HGMD, COSMIC, My Cancer Genome, ClinVar, MD Anderson PCT
Databases for polymorphism determination
1000 Genomes, dbSNP
1000 Genomes, NHLBI ESP
dbSNP, NHLBI ESP 1000 Genomes 1000 Genomes, NHLBI ESP
1000 Genomes, NHLBI ESP
ANNOVAR is available athttp://annovar.openbioinformatics.org/en/latest/misc/credit; GSNAP,http://research-pub.gene.com/gmap; Freebayes,http://arxiv. org/abs/1207.3907; dbNSFP,https://sites.google.com/site/jpopgen/dbNSFP.
*Site did not participate infile analysis.
variant that they did not report but that at least one other institution did report. Additional information was solicited regarding BI improvements made as a result of this PT.
Results
The six institutions that participated in this study all use the Illumina TST library preparation kit in combination with the Illumina MiSeq instrument for molecular analysis of clinical tumor samples. The TST kit amplifies selected hotspots, exons, or entire coding regions of 26 genes that have clinical relevance for various cancer types.6,7 Although this com-mon library preparation method was used, some differences in the wet-bench components of the assay existed among the institutions, most notable of which were dissimilarities in the number of samples included on each sequencing run (range, 2 to 13 samples per run) (Table 1). Each of the six institutions submitted FASTQfiles [generated via on-board MiSeq instrument software (see Materials and Methods) from raw image data] for four samples previously run in-house, resulting in file sets for 24 samples (96 separate FASTQ files because each sample has separate A and B pools and each pool is represented by R1 and R2 reads). Of these, 21 were derived from clinical tumor samples (from a variety of cancer types) and three from commercially available calibrator/reference samples (Figure 1, A and B). The institutions were encouraged to submit at least one case that contained an indel because these variants are known to be particularly challenging for BI pipelines.3,8 The 24 file sets were then deidentified and distributed to five of the institutions. One site (site 6) did not participate infile analysis because it uses on-board MiSeq Reporter software version
2.3 and Variant Studio version 2.1 exclusively and was not equipped to analyze externally provided FASTQfiles.
Each of the five participating institutions then analyzed all 24 file sets via their own BI pipeline and interpretive processes. The components of the pipelines differed among the institutions with various combinations of tools for alignment (GSNAP, NextGENe, MiSeq Reporter, Novo-Align, BWA-MEM), variant calling (Freebayes, NextGENe, MiSeq Reporter, VarScan, GATK), and variant annotation (ANNOVAR, dbNSFP, Geneticist Assistant, Clinical Genomicist Workstation, Variant Studio, NextGENe) used (Table 1). In addition, each institution used its own QC metric cutoffs, most notably for minimum read depth (range, 500 to 2000for the combined A and B pools, with some institutions also using per pool minimums) and VAF threshold for positive variant identification [range,<3% (at the medical director’s discretion) to 5%] (Table 1). Finally, the resources and databases used for variant inter-pretation and polymorphism determination varied among the institutions (Table 1). Thus, there were marked differ-ences among the institutions in regard to the BI pipeline components, QC metrics, and interpretive tools used.
After analysis, the institutions were asked to report vari-ants as they would for a clinical case based on the tumor type information provided. These reports were then com-bined to generate a complete list of called variants to be used for concordance analysis. To simplify this analysis and because of feasibility constraints, synonymous and intronic variants were excluded. The range of total reported non-synonymous and exonic variants per sample for all 24 samples is shown inFigure 1C.
Among the 21 clinical cases, a total of 48 variants were included in calls by thefive institutions. Of these, 16 were Clinical sample (FFPE)
Clinical sample (Diff-Quik slide)
Calibrator
A
B
C
0 2 4 6 8 10
0 1 2 3 ≥4
Number of
Samples
Number of Variants Reported for Sample
Lung adenocarcinoma (or adenosquamous) Melanoma
Colorectal cancer Glioblastoma
Gastrointesnal stromal tumor Cholangiocarcinoma
Figure 1 Sample characteristics.A:Of the 24 samplefile sets used in
deemed to be clinically significant variants, whereas 32 were deemed variants of uncertain significance (VUSs). Clinical significance was determined on a variant by variant basis, taking disease type into account, and this determina-tion was based on a consensus opinion of study leaders to avoid an additional layer of complexity in reporting the data. One of the institutions applied a QC metric that deemed an entire sample a QC fail if any targeted region within the assay was covered by<1000for the combined pools or by <300 for either of the individual pools. When this occurred, this institution was not included in the concor-dance assessment for a particular variant (ie, the denomi-nator was changed from 5 to 4). A total of 38 SNVs were reported, 31 of which (81.6% concordance) were called by all participating sites (Table 2). All nine cs-SNVs were called by allfive institutions (100% concordance). Of the 29 VUS SNVs, 22 were called by all participating sites (75.9% concordance). For the remaining seven VUS SNVs, there were four for which one participating site did not call, one for which two sites did not call, and two for which three sites did not call (Table 2). In addition, 10 indels were re-ported, with only two being called by all participating sites (20% concordance). Seven of the indels (all of which were >10 bp) were deemed clinically significant, and only two of the seven were called consistently (28.6% concordance). Of note, only two of the five sites (sites 1 and 4) reported all seven cs-indels. For several of these, orthogonal testing confirmed the presence of the indel. Three VUS indels were
also reported (all<10 bp), two of which were not called by one participating site and one of which was not called by two sites (Table 2).
Concordance of variant calls from calibrator samples (all of which were SNVs and small indels) is also listed in
Table 2. The calibrator samples included in this study were NA12878 (Coriell Institute, Camden, NJ), HD129 (Horizon Discovery, Cambridge, UK), and HD200 (Horizon Dis-covery), for which there were 0, 4, and 16 combined vari-ants calls, respectively. Of these, 13 varivari-ants were called by allfive sites, three variants were called by four offive sites, two variants were called by three of five sites, one variant was called by two of five sites, and one variant was called by one offive sites.
Including clinical samples and calibrator samples, there were 68 total variants reported. Two of these 68 variants, a
KIT c.1676T>C SNV (reported at 3% VAF) and aMSH6
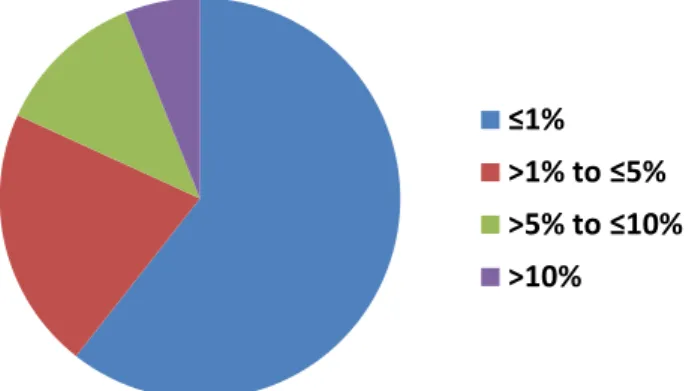
c.3254dupC (described by three sites as a persistent assay artifact), were only reported by one institution, but the remaining 66 were assessed for VAF concordance by calculating the range of reported VAFs (highest reported minus lowest reported). Remarkably, this range was 1% for 40 (60.6%) and 5% for 54 (81.8%) of the variants reported (Figure 2). Eight variants (12.1%) were reported at ranges>5% and10%, and only four variants (6.1%) were reported at VAF ranges >10%. The largest VAF range observed for a variant was 34% to 52% (range of 18%), which was seen for a PIK3CA c.3140A>G mutation re-ported by allfive institutions. The explanation for this large range in percentage of VAF likely involves the fact that this position is at a primer binding site in the TST assay.
After the concordance analysis, a summary of all variants identified for each sample was then redistributed to each site. The sites were then asked to provide an explanation for every call that they did not make but that at least one other site made. Explanations were limited to a drop-down menu of choices, including failed QC, below VAF cutoff, persistent assay artifact, technical concern, SNP (meaning an SNV deemed to be benign based on inherited allele
≤1%
>1% to ≤5%
>5% to ≤10%
>10%
Figure 2 Variant allele frequency (VAF) concordance. The range of VAF
(highest reported minus lowest reported) was calculated for all variants reported by at least two institutions (66 variants total). The distribution of these ranges is shown. The VAF range was5% for most variants (81.8%).
Table 2 Summary of the SNVs
Alteration type
No. (%) of sites that made call (if sample passed QC)
All clinically significant SNVs* (nZ9) All 5/5 (100)
SNVs with uncertain clinical significance (nZ29)
22 Variants called by all sites 4/4 or 5/5 (100)
4 Variants for which 1 site did not call 3/4 or 4/5 (75 or 80)
1 Variant for which 2 sites did not call 2/4 or 3/5 (50 or 60)
2 Variants for which 3 sites did not call 1/4 or 2/5 (25 or 40)
Clinically significant insertions/deletions* (nZ7)
KITc.1729_1746dupCCTTATGATCACAAATGG 2/4 (50)
EGFRc.2240_2257delTAAGAGAAGCAACATCTC 4/5 (80)
EGFRc.2235_2249delGGAATTAAGAGAAGC 5/5 (100)
EGFRc.2235_2249delGGAATTAAGAGAAGC 3/4 (75)
EGFRc.2235_2249delGGAATTAAGAGAAGC 4/4 (100)
EGFRc.2304_2318dupCGTGGACAACCCCCA 2/5 (40)
ERBB2c.2311_2322dupGCATACGTGATG 4/5 (80)
Indels with uncertain clinical significance (nZ3)
2 Variants for which 1 site did not call 3/4 (75)
1 Variant for which 2 sites did not call 3/5 (60)
Variants in calibrator samples (SNVs and indels) (nZ20)
13 Variants called by all sites 5/5 (100)
3 Variants for which 1 site did not call 4/5 (80)
2 Variants for which 2 sites did not call 3/5 (60)
1 Variant for which 3 sites did not call 2/5 (40)
1 Variant for which 4 sites did not call 1/5 (20)
*Variants were deemed clinically actionable if known to influence clinical decision for stated disease type.
frequency and protein coding effect), or variant not identi-fied by BI algorithm. For the 21 clinical cases, the reasons given for noncalls are tabulated inTable 3. Twelve instances of failed QC for a variant noncall were reported. However, as detailed above, all 12 were reported by a single institution that rejected the sample as a whole if any region did not meet minimum coverage metrics (in other words failed QC indicates rejection of all the data for the sample and does not necessarily indicate that the variant itself was not detected). Aside from these failed QC cases, there were four instances of noncalls due the variant being below VAF cutoff, three instances of technical concern, eight instances of a variant being deemed SNP, and nine instances of variant not identified by BI algorithm. Importantly, for the clinical samples, the only instances of discordance that could be strictly attributed to manual interpretation of the data were the eight occasions in which a variant was deemed an SNP. Reasons for discordance in the calibrator samples are also listed in Table 3.
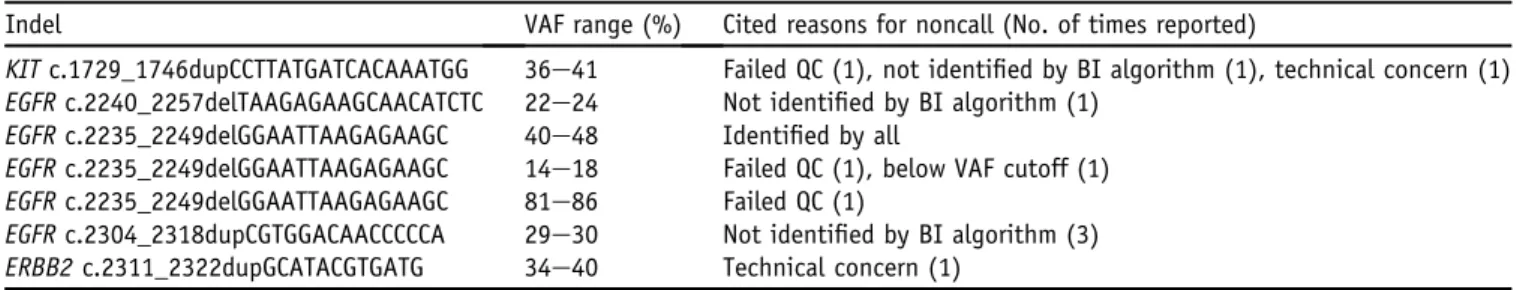
Because the reporting of cs-indels was highly discordant among the institutions, we explored the reasons behind these discrepancies in greater detail (Table 4). The KIT
c.1729_1746dupCCTTATGATCACAAATGG exon 11 insertion (which was confirmed by Sanger sequencing) was only called by two institutions (at 36% and 41% VAF). One site did not call the variant due to failed QC for the sample as a whole. Another site reported the noncall as a technical concern. When this institution investigated this case further, it was discovered that the duplication was present but being
called as substitutions by the pipeline. Furthermore, there was a low number of reads harboring the duplication, and these were of low quality (suggesting that perhaps many of reads were eliminated before mapping). The other institution that missed this variant reported it as variant not identified by BI algorithm. On further investigation it was discovered that the pipeline technically detected the insertion but that stringent BI filters resulted in it not being reported. With adjustment of these filters, the insertion was detected and reported.
Four of the seven cs-indels were EGFR exon 19 de-letions. One of these, c.2240_2257delTAAGAGAAGCA-ACATCTC, was called by four of thefive institutions with the remaining institution citing variant not identified by BI algorithm. This false-negative result prompted the insti-tution, which uses the NovoAlign alignment tool, to update to a newer version of the software and modify the indel detection scripts. After these changes were made, the indel was detected by the institution’s BI pipeline. The remaining three EGFRexon 19 deletions were all c.2235_2249delG-GAATTAAGAGAAGC. For one of these (reported VAF range, 40% to 48%), allfive institutions detected the variant. For another (VAF range, 81% to 86%), the presence of which was confirmed by pyrosequencing, one institution reported failed QC for the entire sample, but the remaining four institutions detected the variant. In the third instance, the VAF range was 14% to 18%, and the deletion was confirmed by Sanger sequencing. Again, one institution reported failed QC for the entire sample. Another institution did not report the variant because of it being below the VAF cutoff (10%). In this instance, the variant was observed at 9% VAF, but this indel was not established within the in-stitution’s pipeline as a hotspot variant. In this particular pipeline, designation as a hotspot effectively increases sensitivity by reducing the VAF threshold for the variant. Adding this deletion as a hotspot in the pipeline resulted in its identification.
Another particularly challenging cs-indel in this study was an EGFR exon 20 duplication (c.2304_2318dupCG-TGGACAACCCCCA), which was confirmed by Sanger sequencing. Only two of thefive institutions identified the variant, which was detected at 29% and 30% by the two pipelines. The remaining three institutions all cited variant not identified by BI algorithm. One of these institutions added that for unknown reasons the indel was only observed in one
Table 4 Summary of the Reasons for Noncall
Indel VAF range (%) Cited reasons for noncall (No. of times reported)
KITc.1729_1746dupCCTTATGATCACAAATGG 36e41 Failed QC (1), not identified by BI algorithm (1), technical concern (1) EGFRc.2240_2257delTAAGAGAAGCAACATCTC 22e24 Not identified by BI algorithm (1)
EGFRc.2235_2249delGGAATTAAGAGAAGC 40e48 Identified by all
EGFRc.2235_2249delGGAATTAAGAGAAGC 14e18 Failed QC (1), below VAF cutoff (1) EGFRc.2235_2249delGGAATTAAGAGAAGC 81e86 Failed QC (1)
EGFRc.2304_2318dupCGTGGACAACCCCCA 29e30 Not identified by BI algorithm (3) ERBB2c.2311_2322dupGCATACGTGATG 34e40 Technical concern (1)
BI, bioinformatics; QC, quality control; VAF, variant allele frequency.
Table 3 Summary of the Reasons for Noncall and Discordance
Cited reason for noncall No. of instances
Clinical samples
Failed QC 12
Below VAF cutoff 4
Technical concern 3
SNP 8
Variant not detected by BI algorithm 9 Calibrator samples
Below VAF cutoff 3
Persistent assay artifact 3
SNP 1
Variant not detected by BI algorithm 7
strand and that afilter rule change allowed it to be detected. Another site indicated that on exploration of this noncall it was discovered that it was likely a limitation in their alignment software (the insertion was observed through manual in-spection but most of the reads containing the duplication were apparently not mapped and thus discarded). In the third instance, no explanation could be determined.
Finally, an ERBB2 exon 20 duplication (c.2311_2322 dupGCATACGTGATG) was detected by four of five in-stitutions with a VAF range of 34% to 40%. The institution that did not call this variant explained it as a technical concern in the discordance report. The insertion was also not observed after manual review of the data, but the institution cited known problems with the alignment and variant calling tools being used in terms of indel detection.
Discussion
Although PT of wet-bench processes for clinical molecular assays is routine, it is less common for BI and interpretative processes. However, performing PT on individual assay components, in this case the postsequencing steps, can help to isolate potential sources of error. Although usually assessed during initial assay validation, these quality man-agement activities are also critical to perform in an ongoing fashion to ensure assay quality. The findings of this study exemplify the need for focused postsequencing PT and demonstrate its feasibility.
The clinical need for postsequencing PT was also high-lighted by a recent effort spearheaded by CAP to distribute FASTQ files based on two commonly used library prepa-ration methods.9 This pilot study demonstrated the feasi-bility of using existing FASTQ files (in which additional alterations were manually introduced) for PT and is the basis for a more widespread availability of this PT option through CAP. However, this option focused only on two library preparation methods (the TST kit used in this study was not one of them), thereby limiting the degree to which laboratories not using said preparations may be able to effectively participate. As PT in the arena of BI reaches increased maturity, additional mechanisms for providing more widespread approaches will be necessary. This may include formalized mechanisms for FASTQfile sharing (as in this study), introduction of variants into existing FASTQs, and/or distribution of entirely synthetic data for analysis.
A key component of our PT was the common use of a single library preparation kit and sequencing method by all participating sites. This ensured that all variants covered and reported for any institution would also be variants covered by the other institutions, thereby eliminating difficulties in determining whether a noncall was due to a postsequencing process deficiency or assay design. Another key element of this study was the use of data generated from actual clinical tumor specimens. As stated above, an alternative approach
to postsequencing process PT is to use in silico generated data in which variants are manually added to existing sequence reads in the FASTQfiles. However, in this study, because sites were asked to report variants as they would for clinical cases, using data derived from clinical specimens provided a more realistic basis for the PT and more accu-rately reflected the spectrum of issues that arise during BI and interpretative process analysis.
It is perhaps not surprising that, among six institutions using the same library preparation method, six unique ap-proaches to bioinformatics analysis and variant interpreta-tion were used. Within the field of NGS bioinformatics, numerous tools exist for each technical step (Table 1). Within these tools are options for customizing parameters that can affect variant identification. Therefore, even in-stitutions using similar software components likely use different settings within these programs, making each BI pipeline unique in terms of its strengths and weaknesses.
In this study, the reporting of SNVs, particularly those deemed clinically significant, was highly concordant across all institutions. However, the reporting of cs-indels was highly discordant. This finding is consistent with previous studies that have found significant challenges in the NGS detection of indels.3,8 Nevertheless, in no instance was it discovered during this study that a patient was adversely affected, because parallel testing procedures for indel detection are in place at the participating institutions (including parallel BI pipelines that could not be applied to the externally generated FASTQ files in this study). An encouraging finding in this study was the low variance of reported VAF for detected variants. More than 60% of variants were reported with a range of 1%, and >80% were reported with a range of5%. Only four variants (6%) had VAF ranges >10%. Of the two cs-indels identified by all participating sites (excluding failed QC samples), one had a VAF range of 5% and the other had a range of 8%. For the cs-indels with a higher discordance rate among laboratories, when the indel was identified, the VAF range was <10% for all cases. These findings suggest that the variations in BI processes may often lead to an all or nothing effect in which the variant is either not reported at all by the BI pipeline or reported at a consistent VAF. In the few instances of >10% VAF ranges, these findings may be directly attributable to specific pipeline differences. For example, the range of 18% (the largest reported in this study) observed for a PIK3CA c.3140A>G mutation ap-pears to be directly attributed to whether sites removed primer sequences from reads for variant calling purposes (so that the primer read would not dilute the variant read). Notably, it has previously been found that variability exits between BI methods in terms of detection of low frequency variants.10
weakness that is well documented in the literature and was the basis for requesting indel cases from all sites. As a result of these discordances being identified, several corrective actions were implemented, including adjustment of filters, adjustment of detection scripts, and changing of VAF cut-offs, all of which resulted in improvement in indel detection on reanalysis. However, it should be noted that reducing stringency in BI pipeline components may have the unwanted effect of reducing specificity (increasing the false-positive rate). Therefore, adjustments to pipeline compo-nents designed to improve detection of one type of variant should always be followed by a revalidation process to fully characterize the effect of the adjustment across the spectrum of samples and variant types.
Several solutions to the challenging detection of indels in NGS data have been proposed. For example, a parallel pipeline designed specifically for indel detection can be implemented. A recently published example of an alterna-tive pipeline that is specific for amplicon-based library preparation methods directly queries the length of each amplicon in the assay.11In theory, an amplicon between two primers should be an invariable length unless it contains an insertion or deletion. Changes in amplicon length (longer for an insertion or shorter for a deletion) are indicative of indels, flagging the reads to be examined by an indel-specific annotation program.11
In this study, two sites (sites 1 and 4) identified all cs-indel cases in the cohort of samples evaluated. Although it may seem intuitive to suggest that the BI tools used by these two sites represents a potential for best practices, repro-duction of simply the tool schemes does not guarantee high variant detection rates. Within each toolset, customizable parameters exist, and altering one parameter in one component may require a compensatory alteration in a different component. Thus, caution is urged when evalu-ating the value of individual bioinformatics tools or as-semblies of tools because careful customization can often be required. Similarly, pipelines composed of alternate toolsets can be significantly improved through the custom adjust-ment of parameters. Therefore, this study in no way estab-lishes any guidance on the use of individual pipeline tools or aggregated tools to form a pipeline, although proposed best practices regarding NGS have been published elsewhere.12 This study also highlights the need for professional so-ciety guidelines with regard to validation of NGS-based assays for somatic conditions. Assuredly, the use of well-designed and high-quality reference materials could be a foundation for assay validation, and development of such materials is well under way for a variety of disease types (eg, through the Genome in a Bottle Consortium). However, it is inconceivable that any individual or group of reference standards could be designed to identify every possibleflaw in every possible assay design. Therefore, even with strin-gent validation criteria, the importance of ongoing PT cannot be understated. Furthermore, a cornerstone of maintaining quality in these complex assays is the ability to
adapt based on weaknesses identified through PT. Thus, ongoing national-level conversations regarding approaches for oversight of laboratory testing must account for the inability to validate every plausible alteration in these as-says. These conversations must also consider the need for ongoing flexibility for laboratories to adapt to changing technology, new information, and feedback from PT.
In conclusion, we reveal the feasibility of applying PT directly to the postsequencing analysis of NGS data. Through this process, we identified the detection of clini-cally significant indels as a particular weakness in several custom BI pipelines. In many cases, this led directly to pipeline improvements that enabled the indels to be detected on reanalysis. Thus, PT based on FASTQ exchange is an ideal method to assess the performance of BI pipelines and interpretative processes.
References
1. Pfeifer JD: Clinical next generation sequencing in cancer. Cancer Genet 2013, 206:409e412
2. Oliver GR, Hart SN, Klee EW: Bioinformatics for clinical next gen-eration sequencing. Clin Chem 2015, 61:124e135
3. Daber R, Sukhadia S, Morrissette JJ: Understanding the limitations of next generation sequencing informatics, an approach to clinical pipeline validation using artificial data sets. Cancer Genet 2013, 206:441e448
4. Kalman LV, Lubin IM, Barker S, du Sart D, Elles R, Grody WW, Pazzagli M, Richards S, Schrijver I, Zehnbauer B: Current landscape and new paradigms of proficiency testing and external quality assess-ment for molecular genetics. Arch Pathol Lab Med 2013, 137:983e988
5. Schrijver I, Aziz N, Jennings LJ, Richards CS, Voelkerding KV, Weck KE: Methods-based proficiency testing in molecular genetic pathology. J Mol Diagn 2014, 16:283e287
6. Quinn AM, Hickson N, Adaway M, Priest L, Jaeger E, Udar N, Keeling C, Kamieniorz M, Dive C, Wallace A, Byers RJ, Newman WG, Nonaka D, Blackhall FH: Diagnostic mutation profiling and validation of non-small-cell lung cancer small biopsy samples using a high throughput platform. J Thorac Oncol 2015, 10:784e792
7. Fisher KE, Zhang L, Wang J, Smith GH, Newman S, Schneider TM, Pillai RN, Kudchadkar RR, Owonikoko TK, Ramalingam SS, Lawson DH, Delman KA, El-Rayes BF, Wilson MM, Sullivan HC, Morrison AS, Balci S, Adsay NV, Gal AA, Sica GL, Saxe DF, Mann KP, Hill CE, Khuri FR, Rossi MR: Clinical validation and implementation of a targeted next-generation sequencing assay to detect somatic variants in non-small cell lung, melanoma, and gastrointestinal malignancies. J Mol Diagn 2016, 18:299e315
8. Hasan MS, Wu X, Zhang L: Performance evaluation of indel calling tools using real short-read data. Hum Genomics 2015, 9:20
9. Duncavage EJ, Merker JD, Bodner JB, Voelkerding KV, Pfeifer JD: A model study of in silico proficiency testing for clinical next-generation sequencing (AMP 2015 Meeting Abstracts). J Mol Diagn 2015, 17:797
10. Spencer DH, Tyagi M, Vallania F, Bredemeyer AJ, Pfeifer JD, Mitra RD, Duncavage EJ: Performance of common analysis methods for detecting low-frequency single nucleotide variants in targeted next-generation sequence data. J Mol Diagn 2014, 16:75e88
11. Kadri S, Zhen CJ, Wurst MN, Long BC, Jiang ZF, Wang YL, Furtado LV, Segal JP: Amplicon indel hunter is a novel bioinformatics tool to detect large somatic insertion/deletion mutations in amplicon-based next-generation sequencing data. J Mol Diagn 2015, 17: 635e643