INFORMATION PROCESSING AND THE INSTABILITY OF POLITICAL OUTCOMES
Derek A. Epp
A dissertation submitted to the faculty of the University of North Carolina at Chapel Hill in partial fulfillment of requirement for the degree of Doctor of Philosophy in the Department of Political Science.
Chapel Hill 2015
Approved by:
Frank R. Baumgartner Virginia Gray
ii © 2015 Derek A. Epp
iii ABSTRACT
Derek A. Epp: Information Processing and the Instability of Political Outcomes. (Under the direction of Frank R. Baumgartner)
Studies in public policy document what is described as a ‘punctuation equilibrium’ pattern of change, where negative feedback forces that act to maintain the status-quo are
occasionally disrupted, leading to brief and dramatic changes before a new equilibrium is rapidly established. The causal process that explains this pattern rests on fundamental limitations to human cognition and institutional capacity and as such, is thought to be widely applicable across organizational structures. From this perspective, punctuations are inevitable to the policymaking process, rather than rare, idiosyncratic events. In this dissertation, I search for the limits of the punctuated equilibrium framework by identifying conditions under which proportional, as
opposed to punctuated, change is possible. I identify variance across organizations in their ability to process and respond to new information and by leveraging this variance, interrogate the causal mechanism behind punctuated equilibrium; using data from U.S. government budgets with corporate and financial data points as reference. I identify two factors as having a powerful effect on the stability of outputs– the scope of organizational focus and the degree to which
organizations take a decentralized, or market-based, approach to decision-making. When organizations are sufficiently limited in scope or decentralize decision-making, output
iv
ACKNOWLEDGEMENTS
I would like to thank Frank Baumgartner. The best decision I made in graduate school was asking Frank to be my advisor. I was tipped off that he would be a good choice by a wall in his office that is covered with teaching accolades. He lived up to his reputation. Frank has obviously established himself as a terrific political scientist, what makes him a good mentor is that he is a terrific person – thoughtful, generous, and unfailingly supportive.
v
TABLE OF CONTENTS
LIST OF TABLES………...v
LIST OF FIGURES………vi
CHAPTER ONE: INTRODUCTION………..………....1
Background ……….3
What Does Information Processing Mean? ………5
Accessing Information ………....6
Considering Information ……….…....7
Comprehending Information ……….………..9
Punctuated Equilibrium………...11
Empirical Methods ………12
Theoretical Expectations ………...17
CHAPTER TWO: PREDICTING PUNCTUATIONS……….……….25
Budget Punctuations – The Depending Variable ………..26
Honeymoons, Learning, and Government Control ………...31
Direct Measure of Inputs ………...35
Predicting Punctuations ………40
Discussion ……….45
CHAPTER THREE: HOW ROBUST ARE DISTRIBUTIONAL FINDINGS OF PUNCTUATED EQUILIBRIUM IN PUBLIC BUDGETS?………47
vi
Identifying Punctuations ………...49
Measuring Sustained Punctuations in the U.S. Budget ……….56
Are Previous Findings Robust? ………63
Discussion ……….66
CHAPTER FOUR: REVENUE POLICY: A CASE STUDY IN COMPLEXITY……….……..68
Revenue Distributions ………...69
From Economic Fundamentals to Revenues ……….73
From Revenues to Expenditures ………...75
Predicting Stability in Government Expenditure ………..77
Discussion ……….81
CHAPTER FIVE: PUBLIC INFOMRAITON PROCESSING………..………...82
Opinion Formation ………84
Public Information Processing ………..86
Data and Analysis ……….88
Measuring the Public Agenda ………...91
Discussion ……….97
CHAPTER SIX: THE PRIVATE SECTOR, MARKETS, AND THE SEARCH FOR STABILITY ………...99
Collective Outputs ………..100
Exchange Rates, the RGGI, and Airline Deregulation ………...104
The Private Sector ………...111
The Union Pacific Railroad ………...114
Discussion ………...117
vii
APPENDIX 2.A: ALTERNATIVE MODE SPECIFICATIONS.………...…...123 APPENDIX 5.A: LEXISNEXIS KEYWORDS.………..……...124 APPENDIX 5.B: COMPARING DEFINITIONS FOR “HIGHLY COVERED”.………..125 APPENDIX 5.C: AN ALTERNATIVE MEASURE OF MEDIA COVERAGE: THE NEW
YORK TIMES FRONT PAGE.………...126
viii
LIST OF TABLES
Table 2.1 – Punctuations by OMB Subfunction………29
Table 2.2 – Punctuations in the First Budget Year of a Presidency………..32
Table 2.3 – Punctuations by Party Control………34
Table 2.4 – Logistic Regression Predicting the Occurrence of Budget Punctuations…………...42
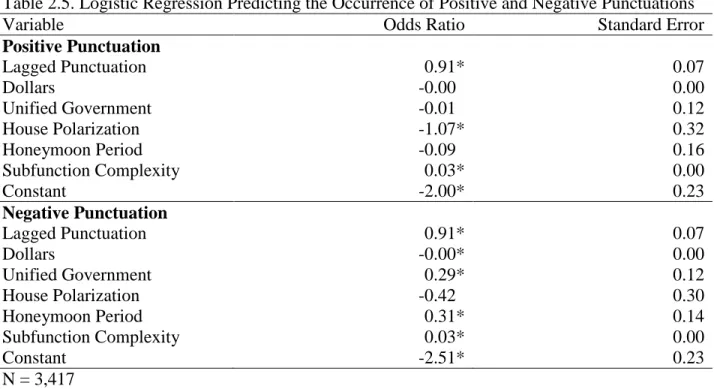
Table 2.5 – Logistic Regression Predicting the Occurrence of Positive and Negative Punctuations………...44
Table 3.1 – How many Puncutations see Reversals between 10 and 90% within 4 years?...58
Table 3.2 – Total Punctuations and Punctuations Sustained by at least 50% over 4 Years, by OMB Subfunction………61
Table 3.3 – Kurtosis of U.S. Budget Distribution with Stochastic and Mandatory Series Excluded, 1947 to 2012………...64
Table 4.1 – Predicting L-kurtosis of State Expenditure Distributions………...80
Table 5.1 – Mean Magnitude of Opinion Change by Media Saliency………..95
Table 5.2 – Predicting Magnitude of Opinion Change………..97
Table 6.1 – Predicting the L-kurtosis of Exchange Rate Distributions………...107
Table 2.1A – Predicting Budgetary Change………123
Table 5.1A – Coverage of Policy Topics in The New York Times from 1980-2010, with LexisNexis Keywords………124
Table 5.2A – Comparing Changes in Public Policy Mood during Periods of Low and High Media Coverage across Four Definitions of High Coverage…………125
Table 5.3A – TheNew York Times Front Page Articles………..127
ix
LIST OF FIGURES
Figure 1.1 – Percent Change in Federal Transportation Outlays, 1947 – 2012……….14 Figure 1.2 – Distribution of Annual Percentage Changes Across
OMB Subfunctions, 1947 to 2012……….………15 Figure 1.3 – Relationship between Information Processing and Output Distributions………….16 Figure 1.4 – U.S. Population Age 65 and Older………18 Figure 1.5 – Normalized Hurricane Damages………...19 Figure 2.1 – Identifying Punctuations in the Distribution of Annual Changes
in Federal Outlays………..28 Figure 2.2 – Rate of Positive and Negative Punctuations by Year of Presidential Term………..33 Figure 2.3 – Comparing Age Demographics and Federal Outlays on Social Security…………..37 Figure 2.4 – Comparing Unemployment and Federal Outlays
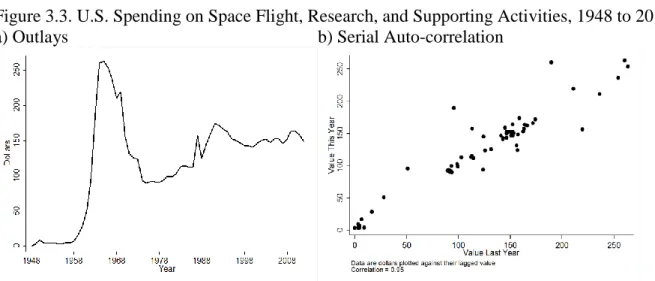
on Unemployment Compensation...38 Figure 2.5 – Comparing Hurricane Damages and Federal Outlays to Disaster Relief…………..39 Figure 2.6 – The Number of Agencies by Subfunction……….41 Figure 3.1 – The Classic Punctuation: Media Coverage of Pesticides………..50 Figure 3.2 – Serial Auto-correlation in Coverage of Pesticides, 1900 to 1988……….52 Figure 3.3 – U.S. Spending on Space Flight, Research,
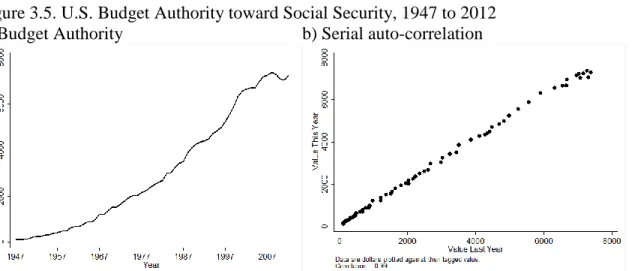
and Supporting Activities, 1948 to 2012………...53 Figure 3.4 – U.S. Outlays toward Disaster Relief and Insurance, 1951 to 2012………...54 Figure 3.5 – U.S. Budget Authority toward Social Security, 1947 to 2012………..55 Figure 3.6 – Identifying Punctuations in the Distribution of Annual Changes
in Federal Budget Authority, 1947 to 2012………...56 Figure 3.7 – Hypothetical Budget Series with Punctuations
that are Reversed by 10% in 4 years………..59 Figure 3.8 – Hypothetical Budget Series with Punctuations
x
Figure 3.9 – Tracking the Annual Inter-quartile Range and L-kurtosis
of Percent Changes Values in the U.S. Budget, 1947 to 2009………66
Figure 4.1 – Federal Government Revenues, 1934 to 2011………..69
Figure 4.2 – L-kurtosis of Revenue Distributions for the 50 States, 1965 to 2008………...71
Figure 4.3 – Leptokurtosis of State Taxes……….72
Figure 4.4 – Comparing the Shape of Economic and Revenue Distributions for the 50 States and the Federal Government………74
Figure 4.5 – Comparing the Shape of Expenditure and Revenue Distributions for the 50 States and the Federal Government………77
Figure 5.1 – Public Policy Mood for Mass Transportation and Assistance for Low-income Families………...89
Figure 5.2 – Annual Changes in Public Policy Mood, 1946 to 2012………90
Figure 5.3 – Comparing trends in Media Coverage and Public Policy Mood for Health Care Reform, 1980-2010………...94
Figure 5.4 – Probability Density Distributions of Aggregate Changes in Public Policy Mood, by Media Coverage………...95
Figure 6.1 – Average Monthly Temperature in Los Angeles, CA from 1881 through 2006…..101
Figure 6.2 – Average Monthly Atmospheric CO2 Levels from 1959 through 2012………102
Figure 6.3 – Average Monthly Number of Air Travelers from 1990 through 2006………103
Figure 6.4 – Average Monthly Border Crossings into the United States from 1995 through 2006………103
Figure 6.5 – Aggregate Changes in Exchange Rates across Three Categories of Currency Manipulation………106
Figure 6.6 – Comparing Changes in CO2 Emissions Before and After the RGGI………..109
Figure 6.7 – Comparing Changes in Airline Yield Before and After Deregulation of the Industry………110
xi
Figure 6.9 – Monthly Freight Shipped by Rail in the United States
from 2000 through 2013………...115 Figure 6.10 – Aggregate Changes in Expenditures
1
CHAPTER ONE: INTRODUCTION
President Eisenhower was dismissive. Having been briefed on the R-7 Semyorka, the Soviet Union’s powerful new rocket, he was well aware that the U.S.S.R. was capable of putting a satellite into orbit. In a press conference shortly after Sputnik’s 1957 launch, Eisenhower attempted to reassure the American people, conceding that the Soviets had “put one small ball in the air,” but quickly adding “I wouldn’t believe that at this moment you have to fear the
intelligence aspects of this.” Later, his chief of staff Sherman Adams would liken the satellite launch to “one shot in an outer-space basketball game.” What the Eisenhower Administration had underestimated was the deep almost visceral reaction Americans had to news of the satellite. It was disconcerting on two levels. First, it was clearly inconsistent with the prevailing notion that the Soviet Union was a technological backwater, incapable of matching the United States’ economic or scientific prowess. Second, people were skeptical of Eisenhower’s assurance that they had nothing to fear. Radio stations had broadcast the satellite’s signal as it traveled over America and it seemed obvious that something that so easily violated transnational boundaries presented security risks.
2
By 1961 when President Kennedy gave his famous speech about putting an American on the moon, U.S. outlays toward space flight and technology, a budget category that scarcely existed in the early 1950s, had already increased 10-fold from their 1957 levels. Altogether, from the launch of Sputnik to the moon-landing in 1969, U.S. outlays toward space technology would increase by almost 5,000 percent.
Dramatic in size and the speed with which they are enacted, spending “punctuations” of the kind described above are actually very common to government budgets. Look at almost any U.S. budget category for the last 50 years and you will encounter at least one massive
adjustment, where the amount of money the government is spending changes by upward of 75 percent from one year to the next. These adjustments are not always toward increases in spending. Returning to the space flight example, NASA directors, triumphant over their recent successes, must have been chagrin in the early 1970s when, with the space race decisively won for America, politicians in Washington cut NASA’s budget more than 50 percent. Budget instability works in both positive and negative directions.
What causes these punctuations? Further, why are punctuations non-constant across policy domains so that some policies persist, remaining the status quo for decades, while others undergo frequent adjustments? It is tempting to treat each punctuation as an isolated, one-off event. Surely, the best way to explain the dramatic increases in spending on science and
3
provides such an explanation by describing the causes of political instability. It focuses on the information processing capacity of governments and mass publics, which determine their ability to respond promptly and sufficiently to societal issues. The key finding is that instabilities vary substantially along two dimensions – the scope of governmental focus and the degree to which governments take a decentralized, or market-based, approach to decision-making. When governments are operating in comparatively simple policy domains or decentralize decision making, public policies tend to endure and change is a smooth, gradual process. When issues are complex or decision making is highly centralized, policy change is stochastic and punctuations abundant.
Background
The first large-scale study to investigate the causes of political instabilities is The Politics
of Attention, where Bryan Jones and Frank Baumgartner (2005) show that government spending
follows a ‘punctuated equilibrium’ pattern of change. By this they mean that annual adjustments to government spending are predominantly small (ranging between -3 and 3 percent), but that occasionally the government undertakes enormous spending reallocations. This pattern is seen as a direct consequence of disproportionate information processing. The idea is that limitations to governmental attention inevitably cause over-attention to a relatively small number of items and under-attention to the bulk of issues that fail to cross some threshold of urgency and therefore gain attention. Over time, as issues rise and fall in urgency, individual and institutional attention shift not slowly and proportionately, but in jumps and starts. If policymaking follows the
4 where some urgency or crisis seems apparent.
By this logic, political instability can be closely linked to information processing. In a political system that processes information proportionally, there would be neither under nor over-attention to issues. Instead, issues would be addressed comprehensively, receiving attention in exact relation to the size of the underlying problem. As issues would not be ignored, or slip through the cracks, there would be no need for massive policy adjustments to correct issues that have worsened through inattention. Of course, a government that could process information at this high level is unlikely, even difficult to imagine. It comes as no surprise that the punctuated equilibrium pattern Jones and Baumgartner describe appears to be widely applicable, aptly characterizing the distribution of outputs from a wide variety of organizational decision making processes. In fact, the reasons to expect disequilibria are so strong that Jones and Baumgartner developed the General Punctuation Hypothesis (2005), which simply states that the outputs of any complex human decision making process will feature punctuations.
While fully proportional, or comprehensive, information processing may be unattainable we can still expect considerable variance across governments and organizations in their ability to process and respond to new information. The dissertation leverages this variance to interrogate the causal mechanism of the punctuated equilibrium framework. If policy instabilities result from attention scarcities, then when attention is less scarce, policy making should stabilize. This basic prediction has undergone little in the way of systematic testing. The General Punctuation
5
identifying the conditions under which proportional, as opposed to punctuated, change is possible. In doing so, it seeks to provide a rigorous test of the applicability and explanatory power of the General Punctuation Hypothesis.
What Does Information Processing Mean?
Information processing is a prerequisite of decision making and takes place over two distinct stages. The first involves receiving new information and the second requires
comprehension of that information. Basic requirements for information processing are therefore: a) access to information b) time to consider the information and c) the expertise or intellect to comprehend the information. Individuals or organizations with a high capacity to process information easily meet the requirements. On the other hand, a low capacity to process information results from difficulty meeting one or all three requirements. For example, as
6 decision making process to the next.
A political system, as I use the term, refers to the combination of the mass public and the institutions within a country that affect political outcomes. Exploring the causes of instability in the U.S. political system requires accounting for the information processing capacity of both the government and the public. The chapter proceeds by reviewing literature that addresses the ability of the U.S. political system to meet each of the three information processing
requirements. Next, I explain the logic and key findings of the punctuated equilibrium framework, including the empirical evidence and methods associated with the subfield. I
conclude by presenting the theoretical contributions of the dissertation and outlining the chapters to follow.
Accessing Information
Is relevant political information available to the government and public? An economic perspective would emphasize that, like any consumer good, information comes with costs. For individuals to be informed about politics they may have to subscribe to a newspaper or pay a cable subscription fee. In the Downsian account of democracy, information costs are a key driver of political inequality (Downs 1957). For its part, the government has clearly devoted
considerable fiscal resources to information-gathering through the development of organizations such as the Congressional Research Service and Congressional Budget Office.
In fact, information is often plentiful and increasingly the costs of accessing quality information are shrinking, so finding time to sort through and prioritize information relevant to a decision is often more troublesome than accessing the information in the first place. In his 1996
Participation in Congress, Richard Hall writes that “policy-relevant information is abundant,
7
in retrospect often appear less random, even predictable. One of the more disturbing findings of the 9/11 Commission is that there was actually good evidence that a hijacking plot was in the works and that this evidence was available to the CIA. Of course, the advantage of hindsight is that we know how information should have been prioritized, but in the crush of current events critical information can be lost or ignored. It is often the case that too much, not too little, information is the problem.
Considering Information
Access to information is the first step in information processing. For that information to be useful it must be prioritized. That is, institutions or individuals must be able to consider and deliberate over the information they have received. Consideration takes time and agenda space, both of which are scarce commodities. Herbert Simon, writing about governance, notes that “the environment makes parallel demands on the system, but the system can only respond serially” (1977, 157). In other words, problems requiring legislative action will often occur
simultaneously and in no predictable or convenient order, but governments can only address them one at a time. Many scholars have remarked on the overwhelming complexity of
governance and noted that national agendas tend to be limited to a few highly salient topics only, at the expense of many seemingly important issues (Sigelman and Buell 2004, Walgrave and Nuytemans 2009, Green-Pedersen and Mortensen 2010, Baumgartner et al. 2011). In many ways, governance is not a carefully planned endeavor, but a reactive enterprise with the pressing concerns of the day dominating the agenda.
8
Ideologically these are not actions typically associated with the Republican Party, but they were seen as reasonable, if not necessary, responses to the September 11th attacks and the 2007 financial crises. Agendas, carefully planned and promoted during elections, are quickly
sidetracked by the demands of responsible governance, with particularly significant events, such as wars or recessions, occupying an inordinate amount of agenda space.
Beyond changing political and economic realities, to which parties must respond
regardless of ideology, there are system-level factors that constrain political agendas. Much has been written about the institutional “rules of the game” and their effect on agendas. One clear example is the closed-primary system, which contributes to polarization and gridlock in Congress, therefore limiting the number of issues to which the government can attend. Other constraints include the dual-chambered legislature, congressional gatekeepers, the presidential veto, and a demanding election schedule (Bish 1973; Buchanan and Tullock 1962; Cox and McCubbins 2005; Koger 2006; Oleszek 2010). In each case, these factors limit the overall ‘carry-capacity’ of the system. For the most part, the U.S. government moves as it was designed to do by the founders: slowly.
9
information that is relevant to a particular decision, people selectively weigh only a few key factors.
George Miller famously characterized the extent of the problem: “There is a clear and definite limit to the accuracy with which we can identify absolutely the magnitude of a
unidimensional stimulus variable. I would propose to call this limit the span of absolute judgment, and I maintain that for unidimensional judgments this span is usually somewhere in the neighborhood of seven” (1956, 90). Put simply, Miller’s point is that people can only process around seven unique stimuli at a time. In all, during any decision making process a great deal of pertinent information is never actively considered (Simon, 1947, 1999; Jones, 1994, 1999, 2001). For these reasons, finding the agenda space to attend to information can be seen as a more
problematic requirement of information processing than accessing information in the first place.
Comprehending Information
10
Divisions of labor that allow for parallel-processing come with both financial and, in the case of the U.S. government many would argue, normative costs. One consequence is that members of Congress have incentives to form close relationships with interest group lobbyists who, having made a career working in a certain industry, have developed a great deal of specific knowledge, which they are happy to share with members. Together members of Congress and lobbyists will develop “policy subsystems” – small groups of political actors who monopolize the discussion over a particular issue (Griffith 1961; Redford 1969; Walker 1983; Chubb 1985). (Such arrangements are also known as iron triangles, policy networks, subsystem politics, and policy whirlpools.) The tendency for policy making to devolve into the purview of isolated subgroups has been seen as a problematic feature of modern democracy. If most policy decisions are made behind closed doors, with little public input, it raises questions about whose interests are being represented by government (Schattschneider 1960). Policy subsystems can be seen as a direct and inevitable consequence of a system that requires the comprehension of a vast array of information. If running the national government were less complicated, there would be no need for the divisions of labor that encourage subsystem development.
Parallel-processing allows organizations to skirt the limits of attention, but at some point those limits will be confronted. Bureaucracies are designed to process routine decisions, but major new initiatives or decisions about controversial topics will have to be decided by a central governing authority. This is when organizations shift from parallel to serial-information
11
centralized decision-making, either by the President or party leaders in Congress. At this point, the cognitive limits of people in leadership positions come into play. In sum, attention can be stretched by bureaucratic divisions of labor, but only so far. Even for complex organizations, attention is a scarce commodity.
Punctuated Equilibrium
What happens in a political system where attention can be allocated to only a very small subset of issues at any given time? What will policy change look like? McCubbins and Schwartz (1984) popularized the term “fire-alarm oversight” to characterize the nature of governance under conditions of attention scarcity. The idea is that policymakers only have time to deal with crises. Anything less than a full-blown crisis and the issue will be left off the agenda, as in most modern societies there are enough crises to fully occupy the government’s limited attention. Of course, there are many issues that might not rise to crisis-level, but would still benefit from government attention. These issues will be ignored, and worsen through inattention, until they become crises in their own right. Note that there is nothing objective about assigning urgency to some issues over others. History is full of examples where governments took unprecedented steps to alleviate a perceived crisis that in retrospect looks trivial or nonexistent. Likewise, some contemporary issues look very urgent, but are still being ignored. Regardless of the selection mechanism, because agenda space is limited, issues must displace each other as they rise and fall in urgency.
12
attention is focused. Absent any attention, it is hard to imagine how or why large shifts would be enacted. This dichotomy, or threshold effect, is the basis of the punctuated equilibrium model. Without attention, policies change only marginally from year to year, but when attention is focused policy punctuations are possible.
The punctuated equilibrium model was originally developed to explain policy change at the national level, but the model’s theoretical roots are grounded in a basic understanding of human cognition. Certainly attention can be considered an important prerequisite for change in many contexts and taking the implications of bounded rationality seriously suggests attention scarcities are widespread. This led Jones and Baumgartner to formulate the General Punctuation Hypothesis, which predicts that the result of any complex human decision making process will be punctuated. A broad prediction, subsequent scholarship has supported the hypothesis, finding evidence of disequilibria across a wide range of political time series, including congressional hearings, bill passages, media coverage, and the budgets of city and local governments (Jordan 2006; Breunig and Koski 2006; Jones et.al. 2009; Boydstun 2013).
Empirical Methods
13
literature is government budgets, which provide a good approximation of the relative importance governments place on different issues. The added benefit is that for many Western democracies budget data is plentiful, facilitating international comparison.
What does a punctuated equilibrium pattern of change look like? Figure 1.1 shows annual percentage changes in spending on public transportation by the federal government, from 1947 through 2012. There are substantial reallocations in the early 1950s, corresponding to
14
Figure 1.1. Percent Change in Federal Transportation Outlays, 1947 – 2012
Of course, the federal government allocates money to many different programs besides transportation. Figure 1.2 shows the distribution of annual percentage changes in spending across all 67 Office of Management and Budget (OMB) categories (called subfunctions in OMB
15
Figure 1.2. Distribution of Annual Percentage Changes Across OMB Subfunctions, 1947 – 2012
Clearly this distribution is not normal, but instead can be described as leptokurtic. (Superimposed over the budget distribution is a normal distribution, for comparison.) Leptokurtic change distributions are considered a key indicator of a government that is processing information disproportionately. This type of distribution has much wider tails and higher central peaks than would be produced by a normal data-generating process, and the “shoulders”, or mid-range changes, are missing. The high central peak is caused by widespread under-attention to issues, which leads to incremental budgeting, and the wide tails result from decisive government reallocations on issues where there is a sense of urgency. The l-kurtosis statistic measures the degree to which a distribution displays leptokurtosis. A normal distribution has an l-kurtosis of 0.123, with increasing values indicating leptokurtosis and lower values playkurtosis. Note that the budget distribution in the figure has an l-kurtosis value of around 0.620, indicating that it deviates substantially from the Normal (Jones et.al. 2009).
16
punctuated equilibrium model assumes that annual changes to the overall inputs associated with governing are normally distributed, from the Central Limit Theorem. In this way the budget distribution tells us something about how efficiently the government is at processing and responding to problem, as we can expect that a perfectly efficient government would adjust spending proportionally to inputs, thus generating a normal spending distribution.
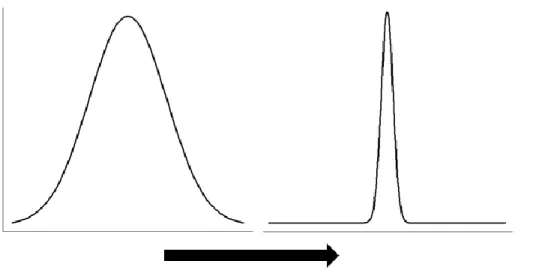
The dissertation employs a multitude of methods, but a key analytic approach will be to compare the shape of output distributions. If punctuations result from attention scarcities, then in conditions where attention is less scarce, output distributions should trend toward the normal. Figure 1.3 illustrates the expected dynamic. When attention is scarce and narrowly focused the dichotomy between marginal drift and policy punctuations should be especially acute;
corresponding to a higher central peak and wider tails. As information is processed more proportionally, organizational outputs will more closely resemble the distribution of relevant inputs, which is assumed to be normally distributed.
Figure 1.3. Relationship between Information Processing and Output Distributions
17
dataset, hypotheses are derived and tests conducted to determine how political instability varies with attention.
Theoretical Expectations
Given what we know about information processing and how it affects policymaking, what factors are most likely to condition the stability of organizational outputs? That is, what factors will be the biggest contributors to punctuations? The preceding scholarship offers some clues. First, returning to studies on bounded rationality, while there are clearly upper limits to human cognition, there are also lower limits. If it takes 6 or more stimuli to overwhelm human cognition, forcing people to fall back on heuristics, where decisions feature fewer than 6 alternatives, people should be able sort through those alternatives in a fairly comprehensive manner. At issue, in other words, is complexity. When decisions are very simple, comprehensive information processing is not so prohibitive.
18 Figure 1.4. U.S. Population Age 65 and Older
19 Figure 1.5. Normalized Hurricane Damages
If climate models were vastly superior, then policymakers might have forewarning about particularly powerful hurricanes years in advance, allowing them to budget for these disasters incrementally. Of course, the complexities of weather events are such that accurately predicting next week’s weather is challenging; to say nothing of predicting specific hurricanes years before they happen. Faced with such complexity, what do policymakers do? They cross their fingers and hope that no major disasters take place on their watch and when a disaster does occur, they allocate spending to address the crisis. We can consider instability that results from natural complexity to be reactive, in the sense that policymakers are forced to quickly respond to an unforeseen, or newly discovered, crisis.
20
but are ultimately fragile. When new ideas or issue frames come to dominate thinking about a particular problem, large policy changes can result, as the government readjusts its focus. This type of complexity, famously described by Kingdon’s “three streams approach”, is a major focus in the agenda setting literature.
As discussed, given institutional constraints and the restrictive boundaries of human cognition, finding a government that comprehensively processes all the information relevant to policymaking is unlikely. But the General Punctuation Hypothesis makes claims beyond just the public sector, predicting that the results of any human decision making process will be
punctuated. Might there be organizations whose focus is so narrow that they can effectively process all the information relevant to their decision-making processes? It is an open question (one that the dissertation will pursue), but it seems likely given the wide range of organizational interests in today’s society.
Another factor that might powerfully affect the stability of organizational outputs is the degree to which organizations employ a decentralized, or market-based, decision-making process. Jones, Sulkin, and Larsen (2003) showed that distributions of changes in stock market returns were approximately normal. Markets returns are a common, and much lauded, product of human-decision making, so this finding represents an important caveat the General Punctuation Hypothesis. The hypothesis applies only to the outputs of people or organizations operating in isolation. Once we start aggregating across autonomous decision-making units, outputs appear to stabilize and punctuations become much less frequent. Why should this be the case? What is the distinction between market-based and centralized decision making?
21
considerably less than those seen in government. Most important, however, is that markets gain by aggregation. Each individual actor in a market system has an effect on the final outcome, so idiosyncratic or random behavior by actors who are uninformed averages out, leaving a clear, sophisticated signal from the actors who are reacting to some common stimuli. There is, in other words, a powerful empirical reason why market systems are better at processing information than individuals.
22
The ability of markets to process information at a very high level is well-known and often expressed in terms of the “efficient-market hypothesis”, which asserts that it is almost impossible to consistently ‘beat’ average market returns because prices on traded assets already reflect virtually all the information relevant to buying or selling (Samuelson 1965; Fama 1970). This does not mean markets are infallible – they do not operate with perfect information and a ‘herd-mentality’ can occasionally lead to speculative economic bubbles (Basu 1977). Still, while the degree to which markets are perfectly efficient is debated, we can reasonably expect that an open market system will process information more completely than isolated organizations.
Markets are certainly a central part of social life in modern democracies. What about the role of market-based decision making within government? To what extent are market
mechanisms used to determine policy outcomes? In fact, market structures are not uncommon to policymaking. Much of monetary policy, a substantively important component of governance, is based on market interactions, and many social policies also feature market components. A recent example is the Affordable Care Act, which establishes a marketplace to determine the price of health insurance. We can expect that policies where outcomes are generated by a market will see fewer punctuations than those where outcomes are determined exclusively by a central decision-making unit.
In sum, there are good reasons to think that these two factors –complexity and the centralization of decision-making – will powerfully predict the stability of political outcomes. The dissertation proceeds to test this reasoning as follows: Chapter 2 revisits the federal budget, the focus of Jones and Baumgartner’s original work, to investigate the specific causes of
23
dependable and stable information flows, while others are much more erratic, so the occurrence of disequilibria in the federal budget is not constant but varies by spending type. By directly measuring the distribution of inputs relevant to particular areas of policymaking, the chapter avoids making assumptions about how those inputs may be distributed, allowing for a more direct testing of the General Punctuation Hypothesis. This exploration informs the specification of a logistic regression model and a key contribution is to predict the occurrence of punctuations in budgetary time series.
Informed by these results, Chapter 3 investigates the robustness of punctuation equilibrium theory as an explanation for instability in public budgets. It explores potential artifactual causes of punctuations, controls for them, and revaluates distributions of budget data when they are eliminated from the analysis. A key theoretical development is to distinguish between punctuations that are sustained over many years, versus those that frequently reversed. Using U.S. federal budget data as the test case, I find only small differences in the shape of spending distribution when budget series prone to temporary punctuations are eliminated. Chapter 4 expands the scope of the analysis to the 50 states and looks at revenue policies. The availability of revenues can obviously be an important input when making policy decisions. Meanwhile, an important input to revenues is the underlying economy, I measure through GSP. The chapter considers: a) how instability in revenues streams lead to punctuations in outlays b) how the difficulty of decision-making processes can affect the shape of output distributions c) how the composition of tax portfolios affects the stability of revenue distributions.
24
rationality to mass publics suggests that public attention is a scarce and disproportionately allocated commodity. Causal analysis of opinion data in relation to media coverage finds that large shifts in opinion are much more likely when attention is highly concentrated, but for the many issues where attention is absent, opinions drift only marginally. Public opinion is very much a ‘sleeping giant’ – predominantly static and at the same time prone to sudden and dramatic bursts.
Chapter 6 looks at corporate and market data to determine the applicability of the
punctuated equilibrium framework to the private sector. Conventional wisdom is that the private sector is much more efficient than government. This chapter explores how this is and is not true. Markets, based on the collective actions of millions of people, are highly efficient, but
corporations work under the same cognitive constraints as governments (or any other
25
CHAPTER TWO: PREDICTING PUNCTUATIONS
Scholarship shows instabilities in outputs from governments around the world, but the original finding was for the U.S. national government. This is where the dissertation’s search for variance begins. It is well-understood that aggregate changes to U.S. government policies display frequent punctuations, however, this general finding masks what may be considerable variance across policy domains. There is no reason to expect that the government will process information in the exact same way, or with the same aptitude, across domains as diverse as Social Security is to emergency management. Part of the methodology of this chapter will be an attempt to directly measure various inputs that may be relevant to the policymaking process in order to determine if instability in the inputs is associated with more punctuations in the outputs, as would be
expected.
Studies in agenda setting have for the most part avoided measuring inputs directly, instead relying on the assumption that they will be normally distributed in the aggregate. This avoidance is due primarily to uncertainly as to what the appropriate inputs are; the decision-making theory at the core of punctuated equilibrium is that decision-makers are never using a complete model of reality, and therefore that they may occasionally update their approach. This means changing the series of input indicators they consider relevant to a particular issue. Further, many of the indicators decision-makers may use will be qualitative and informal.
Still, there are clear limitations to the general approach. It necessitates drawing
26
the punctuated equilibrium framework - inputs into a political system are acted upon by cognitive and institutional limitations, resulting in punctuated outputs. But where exactly do those punctuations come from? Some areas of policy making might be more prone to instability than others. Some governing conditions, such as single party government, may result in
punctuations more frequently than periods of divided control. How much of the instability observed in the federal budget can be attributed to political complexity caused by deliberations over the merits of competing inputs, versus natural complexity that the government simply reacts to? These questions motivate this chapter’s approach: a return to the U.S. federal budget with the goal of unpacking the black box at the center of the punctuated equilibrium model. In doing so, it offers an extension of the model, by describing the occurrence of punctuations over a range of policy domains and conditions, but also a test. Without a firm measure of underlying inputs, a key finding in the literature is based on an assumption (albeit a strong one). The chapter, by directly measuring inputs, allows a side-by-side comparison of input and output distributions, providing a direct test of the General Punctuation Hypothesis.
Budget Punctuations – The Dependent Variable
27
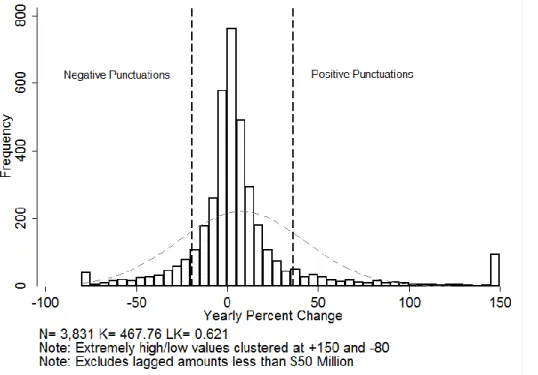
Before proceeding to subsequent analysis the chapter establishes a definition for what constitutes a budget punctuation. Figure 2.1 shows aggregate changes in government spending across OMB subfunctions from 1947 to 2012, repeating Figure 1.2 from Chapter 1. The goal here is to explain the punctuations in Figure 2.1 and there are various ways to distinguish between those cases far in the tails and those not considered to be punctuations. Analysis of the causes of punctuations proves to be highly robust with respect to where the line is drawn between a punctuated change and one that is closer to the bulk of the observations. For simplicity, I draw that line at the top and bottom ten percent of the observed changes, and the figure illustrates this with vertical lines. With 3,831 observations in the overall distribution, 783 then are identified as punctuations, half on the negative side and half on the positive side. Note, as is standard in the literature, the presentation of the data is truncated by clustering all extremely high positive changes at +150 percent and negative changes at -80 percent.1
1 More complicated definitions of what constitutes a punctuation, such as those beyond the point where the observed distribution passes the hypothetical Normal distribution with similar
variance, or controlling for changes in overall variability across time, generate results highly similar to those we present here, so for simplicity, but with knowledge that our results are robust, we choose a very simple definition of punctuation here. Various authors have drawn these lines differently: Jones, Baumgartner and True (1998) drew them at +20 and -15; Breunig and Koski (2006) have used quintile regression to analyze separately the tails from the center of the
28
Figure 2.1. Identifying Punctuations in the Distribution of Annual Changes in Federal Outlays
How are the punctuations in Figure 2.1 distributed across policy domains? Christian Breunig and collaborators showed strong differences in levels of punctuation across policy domains in the U.S. federal budget (with l-kurtosis scores ranging from 0.2 for interest on the public debt to 0.6 for Medicare) and the Danish national budget (with l-kurtosis scores ranging from close to zero for welfare and 0.6 for waterways). Further, they showed that for the cases where the budgets could be compared, the same issue-domains tended to have low or high l-kurtosis scores in both countries (Breunig, Koski, and Mortensen 2010). Finally, Breunig and Koski (2012) showed similar results looking at a different set of policy comparisons in the 50 US states (and also when comparing annual budget totals from state to state); they found education spending to be at the low end of the l-kurtosis scale, with parks at the top.
29
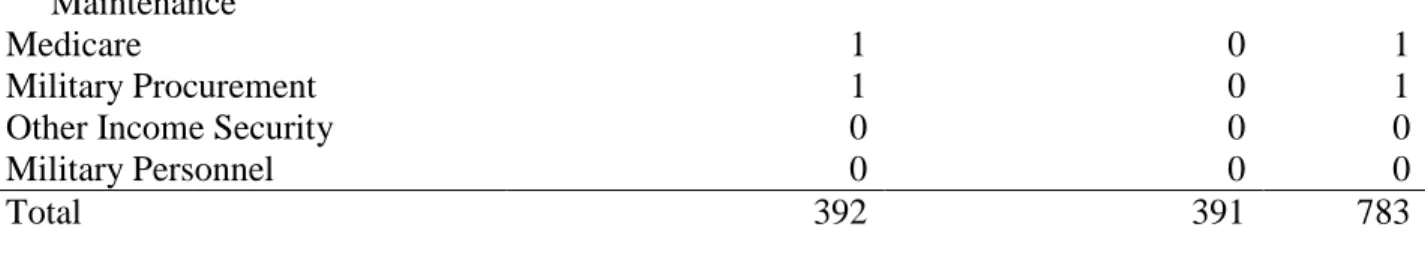
positive, and 391 negative punctuations. Here, we see that topics driven by exogenous shocks tend to have the most punctuations (disaster relief, farm support), while those topics associated with mandatory programs have fewer (Social Security, Medicare).
Table 2.1. Punctuations by OMB Subfunction
OMB Subfunction Positive Punctuations Negative Punctuations Total
Disaster Relief and Insurance 21 22 43
Military – Other 16 19 35
Farm Income Stabilization 14 19 33
General Property and Records
Management 16 16 32
Other Advancement of
Commerce 13 16 29
Other General Government 13 13 26
Veterans Education, Training,
and Rehabilitation 9 18 26
International Security Assistance 12 14 26
Community Development 13 12 25
Higher Education 15 10 25
Housing Assistance 12 12 24
International Development and
Humanitarian Assistance 13 11 24
Area and Regional Development 9 15 24
Unemployment Compensation 12 9 21
Training and Employment 12 9 21
Defense-related Activities 12 9 21
Criminal Justice Assistance 8 9 17
Ground Transportation 8 7 15
General Purpose Fiscal
Assistance 7 7 14
Research and General Education
Aids 7 7 14
Emergency Energy Preparedness 5 9 14
Water Resources 5 8 13
Elementary, Secondary, and
Vocational Education 7 6 13
Space Flight, Research, and
Supporting Activities 9 4 13
Military Construction 4 9 13
Pollution Control and Abatement 6 6 12
General Retirement and
Disability 4 7 11
Atomic Energy Defense
30 Conservation and Land
Management 5 6 11
Executive Direction and
Management 7 4 11
Recreational Resources 7 4 11
General Purpose Management 5 5 10
Energy Information, Policy, and
Regulation 3 7 10
Energy Conservation 3 7 10
General Science and Basic
Research 7 3 10
Air Transportation 5 4 9
Social Services 6 2 8
Health Care Services 5 3 8
Conduct of Foreign Affairs 4 4 8
Food and Nutrition Assistance 7 0 7
Other Labor Services 2 5 7
Federal Law Enforcement
Activities 4 2 6
Federal Employee Retirement
and Disability 3 2 5
Other Veterans Benefits and
Services 3 2 5
Water Transportation 2 3 5
Legislative Functions 3 2 5
Military (1947-1956) 2 2 4
Military Family Housing 0 4 4
Federal Correctional Activities 3 1 4
Other Natural Resources 3 1 4
Foreign Information and
Exchange Activities 0 3 3
Income Security for Veterans 2 1 3
Other Transportation 1 2 3
Consumer and Occupational
Health and Safety 2 0 2
Health Research and Training 1 1 2
Agricultural Research and
Services 0 2 2
Military Research, Development,
Test, and Evaluation 2 0 2
Central Fiscal Operations 1 1 2
Social Security 1 0 1
Medical Care for Veterans 0 1 1
Federal Litigative and Judicial
Activities 1 0 1
31 Maintenance
Medicare 1 0 1
Military Procurement 1 0 1
Other Income Security 0 0 0
Military Personnel 0 0 0
Total 392 391 783
Table 2.1 provides reassurance on two counts: first, that there is considerable variance in the occurrence of punctuations across budget categories to explain, and second that complexity is a plausible avenue for exploring that variance. Figures 1.4 and 1.5 from Chapter 1 looked at annual changes to age demographics and hurricane damages, making clear that some inputs series are much less stable than others. It therefore is not no surprising in Table 2.1 to see that budget categories based on age demographics have the fewest punctuations, while spending on disaster relief and insurance has the most. I turn to a series of considerations of the conditions where we might see more and fewer punctuations, with the aim of developing a relatively fully specified model of instability in budgetary time series.
Honeymoons, Learning, and Government Control
32
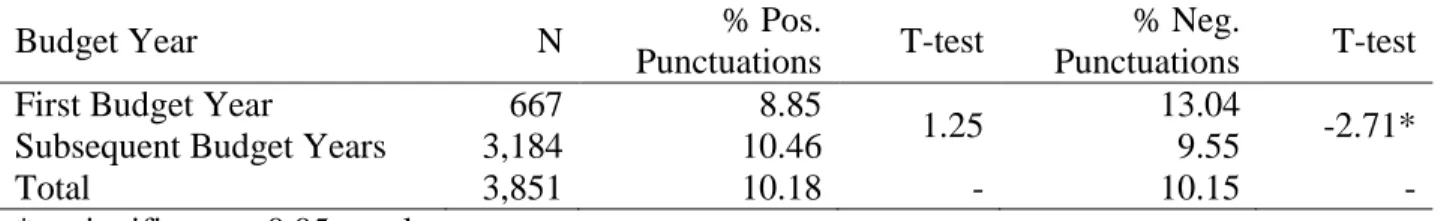
According to the learning hypothesis, presidents can be expected to achieve greater legislative success later in their terms, as they have more experience with the office and negotiating with Congress (Neustadt 2001; Light 1999). Table 2.2 looks at the honeymoon idea and Figure 2.2 considers the learning hypothesis.
Table 2.2. Punctuations in the First Budget Year of a Presidency
Budget Year N % Pos.
Punctuations T-test
% Neg.
Punctuations T-test
First Budget Year 667 8.85
1.25 13.04 -2.71*
Subsequent Budget Years 3,184 10.46 9.55
Total 3,851 10.18 - 10.15 -
* = significant at 0.05 p-value
If new presidents were systematically making their mark in the first year when they had the opportunity to do so, there should be a high percentage of budget punctuations in that first year. Table 2.1 provides some support for this idea, showing that negative punctuations are slightly more common in a president’s first budget2. Positive punctuations, however, are slightly less likely, although not to a statistically significant degree. This suggests that new presidents are more inclined to make dramatic cuts to the budget during their first year in office than increases; perhaps in an effort to reverse policies associated with their predecessor. Will Jennings and Peter John (2010) explored a similar idea using the British speech from the throne, finding that
speeches from new Prime Ministers immediately following their elections were somewhat more likely to show large differences from the previous year’s speech. The analysis offers modest support for their finding in the U.S. context.
What about subsequent years in office? Do presidents learn on the job? If presidents become more adept at working with Congress during their time in office, punctuations may be
33
more likely toward the end of a presidential term. Another possibility would be that second-term presidents are less risk adverse and more willing to sign their names to major policy initiatives. Figure 2.2 shows the percent of budget changes falling in the positive and negative tails of the overall distribution, by presidential year. That is, for all presidents, the figure looks at the occurrence of punctuations as a percentage of total reallocations in their first, second, third year in office, and so on.
Figure 2.2. Rate of Positive and Negative Punctuations by Year of Presidential Term
34
positive punctuations are more likely after a president’s first budget. Overall though, there does not appear to be any major trend in punctuations associated with presidential term year.
Another factor that might influence the occurrence of punctuations would be single party control of government. Majority parties under unified governments enjoy greater degrees of in-party cooperation and institutional leverage, which afford them greater success in implementing their legislative agenda (Cox and McCubbins 1991, Aldrich 1995, Coleman 1999). Further, periods of unified government may present majority parties with opportunities to pursue major policy initiatives; operating as a “release-valve” on pent-up issues that went unattended through political intractability. In turn, divided government imposes greater transaction costs on the president’s party, which can limit its productivity. Table 2.3 shows the occurrence of
punctuations across three levels of party control – divided and unified government, and unified government with a filibuster-proof majority in the Senate (the highest level of party control possible).
Table 2.3. Punctuations by Party Control
Government N % Punctuations
Divided 2,324 18.79
Unified 1,527 21.85
Unified & Filibuster Proof 591 21.63
35
Table 2.1 showed that punctuations vary substantially across budget categories. It would seem that the roots of variance in the instability of policy outcomes lies primarily with factors intrinsic to different policy domains, rather than general conditions relating to governance.
Direct Measure of Inputs
Measuring all the inputs relevant to governing is impossible, but for some government programs inputs may be relatively straightforward to assess. Spending on unemployment benefits are clearly related to actual unemployment levels, for example. Likewise, Social Security
payments are based on a formula that rests on changing age demographics, while spending on disaster relief and insurance is closely linked to the occurrence of weather related calamities. This section revisits Figures 1.4 and 1.5 from Chapter 1 - which looked at population
demographics and hurricane damages – and considers data on unemployment insurance in order to give a brief history of the inputs relevant to these different government programs. The purpose is to illustrate how the natural complexity associated with different policy domains interacts with political complexity as a powerful driver of the instability observed in government budgets.
The Social Security Act of 1935 was a broad response to the Great Depression, designed to guarantee a minimum standard of living to the nation’s elderly by providing old-age benefits payable upon reaching the age of 65. However, in 1939 the law was expanded to provide benefits to the widows and children of workers who died prematurely, in 1956 the law came to include benefits to disabled workers over the age of 50, and in 1972 Social Security added the
36
Age demographics are comparatively simple, changing by only small annual margins. The left panel of Figure 2.3 shows the number of people in the US over the age of 65 from 1947 through 2010, measured in millions of people. The slope of the increase is almost straight, indicating that the annual rate of change is fairly constant. If government spending on Social Security was tied directly to this population, as the original law provided, then government outlays to Social Security should match the rate of change observed in the population. This appears to be the case, as the right panel of Figure 2.3 makes clear. The figure shows outlays in billions of dollars by the Federal government toward Social Security and for the most part, government outlays match changes in the population; both steadily increase over time. The correlation between spending and population growth is 0.98.
Note however, that changes in spending are not quite as smooth or gradual as the population trend. With Social Security, the government implemented a program with a clear indicator in mind – the elderly population – but policymakers quickly reconsidered the scope of their focus. By expanding the population targeted for Social Security payments and the size of the payments themselves, the government was soon diverted from stable demographics to
37
Figure 2.3. Comparing Age Demographics and Federal Outlays on Social Security a) US Population Aged 65 and Over b) Social Security Outlays
Note: Correlation between spending and population = 0.98
Unemployment insurance is another government program where the relevant indicator would seem relatively straightforward to assess. Like Social Security, the unemployment
insurance system was enacted in response to the Great Depression. In fact, it was the same Social Security Act signed by President Roosevelt in 1935 that contained provisions directing the states to develop unemployment laws in partnership with the federal government. Unlike Social
Security, however, unemployment insurance is not based on stable age demographics. Rather, the number of unemployed follows the economic business cycle, which has less predictable dynamics.
38
volatility on display in the right-panel. Further, we can expect policymakers to under or over-react to unemployment levels, so spending adjustments are not necessarily proportional to changes in the unemployment rate. Still, the high correlation indicates that spending tracks unemployment quite closely, so we can surmise that variability in economic fundamentals is a powerful source of the instability in spending.
Figure 2.4. Comparing Unemployment and Federal Outlays on Unemployment Compensation a) The Number of Unemployed b) Unemployment Outlays
Note: Correlation between spending and unemployment = 0.83
39
trend and unemployment levels appeared cyclical, there is no apparent trend with hurricane damages. Instead, the size of the damage fluctuates widely from year to year.
Based on the left-panel of Figure 2.5, we can expect any program where spending is tied to the scale of natural disasters to undergo frequent punctuations. The right-panel of Figure 2.4, which shows annual inflation-adjusted outlays for disaster relief and insurance, confirms this expectation. Spending on disaster relief is highly erratic and, further, does not come close to matching the pattern of hurricane damages. In part, this discrepancy can be attributed to the fact that disaster relief includes many categories of natural disaster besides just hurricanes, but we can also expect the government to respond inefficiently to certain natural disasters; overspending in some cases and underspending in others. The larger point is that budget categories that are linked to stochastic input series show high levels of volatility, while those linked to more stable inputs show much less.
Figure 2.5. Comparing Hurricane Damages and Federal Outlays to Disaster Relief
a) Hurricane Damages b) Outlays to Disaster Relief and Insurance
Note: Correlation between spending and hurricane damages = 0.30
40
explaining the disparity. Age demographics change incrementally and predictably from year to year, unemployment levels follow the economic business cycle, but hurricane damages fluctuate wildly. By linking spending programs to these very different sets of indicators, policymakers ensure that the budget will undergo both incremental and extreme changes. However, the stability of indicators is not the whole story. Often there is uncertainty as to what indicators are the most appropriate measures to inform public policy and this was reflected in that fact that outlays for Social Security and unemployment insurance did not perfectly match either age demographics or unemployment levels.
Predicting Punctuations
The preceding analysis offers clues as to what factors are related to policy instability. Can we put it all together and predict the occurrence of a punctuation in budgetary time series?
Successfully predicting punctuations has largely eluded the agenda-setting literature, for the most part because the occurrence of punctuations is thought to be predominantly stochastic, making the specification of statistical models challenging. Undaunted, the chapter estimates a series of logistic regressions.
41
of complexity simply counts the number of unique agencies that have been linked to each subfunction. Figure 2.6 shows the cumulative frequencies of agencies to subfunctions. All 60 subfunctions that appear in the BEA data are associated with at least one agency; about 15 are linked to more than 10 agencies, and only 2 are associated with more than 20. The measure is a simple but effective operationalization because complexity should be especially acute where multiple agencies are involved as there will be more room for disagreement over the varying “solutions” that different agencies have to offer.
Figure 2.6. The Number of Agencies by Subfunction
Beyond complexity, the regressions include dichotomous variables for a honeymoon period and unified government, coded 1 if the reallocations were from the first budget of a new president or took place during unified government. The regressions also account for
42
sidetracked. To operationalize polarization the regressions includes a measure of House polarization adopted from Keith Poole and Howard Rosenthal’s DW-Nominate scores. From 1947 through 2012 the measure varies between 0.40 and 1.10, with lower values indicating less polarization. Finally, the regressions control for the amount of money allocated to each
subfunction in each year. A plausible concern would be that punctuations are more likely for small budget categories, as it is comparatively easy to make a large change to a small base value. Table 2.4 shows the results of the first model, predicting the occurrence of a punctuation in either the positive or negative direction.3
Table 2.4. Logistic Regression Predicting the Occurrence of Budget Punctuations
Variable Odds Ratio Standard Error
Lagged Punctuation 6.02* 0.57
Dollars 0.99* 0.00
Unified Government 1.08* 0.10
House Polarization 0.54* 0.13
Honeymoon Period 1.12* 0.13
Subfunction Complexity 1.03* 0.00
N = 3,405
Pseudo R2 = 0.126
* = significant at 0.05 p-value
The odds-ratios for all 6 variables are in the expected direction and 4 are statistically significant. Clearly dramatic changes cluster together in budgetary time series; a punctuation is 600% more likely if one occurred the previous year. Punctuations are less likely as budget categories increase in size, but as the dollar variable is coded in thousands, the effect is only very modest. As expected polarization is a strong predictor of policy instability. Moving from very low to very high polarization decreases the likelihood of a major policy shift by about 50%. We also see a strong, and highly significant, effect for subfunction complexity. Each additional
43
agency increases the chance for a punctuation by 3% and this variable ranges from 1 to 27, so moving from the least to the most complex budget category has a major effect. The odds-ratio for unified government and the first budget of a new president are above 1, as expect, but not significant. These effects may simply be drowned out when controlling for other factors. We can imagine, for instance, that the ability of presidents to inflect a budget with their own priorities will be highly contingent on polarization, regardless of any benefits incurred through a honeymoon period.
44
Table 2.5. Logistic Regression Predicting the Occurrence of Positive and Negative Punctuations
Variable Odds Ratio Standard Error
Positive Punctuation
Lagged Punctuation 0.91* 0.07
Dollars -0.00* 0.00
Unified Government -0.01* 0.12
House Polarization -1.07* 0.32
Honeymoon Period -0.09* 0.16
Subfunction Complexity 0.03* 0.00
Constant -2.00* 0.23
Negative Punctuation
Lagged Punctuation 0.91* 0.07
Dollars -0.00* 0.00
Unified Government 0.29* 0.12
House Polarization -0.42* 0.30
Honeymoon Period 0.31* 0.14
Subfunction Complexity 0.03* 0.00
Constant -2.51* 0.23
N = 3,417
Pseudo R2 = 0.077
* = significant at 0.05 p-value
Based on the large and statistically significant odds-ratio for lagged punctuations we can conclude that dramatic increases (or decreases) in spending often play out over multiple years. Note that the effect of congressional polarization and subfunction complexity are similar to what was seen with the full model in Table 2.4. The odds-ratio for dollars is no longer significant, suggesting that the size of budget categories does not alter their likelihood of seeing major increases in spending.
45
their first year in office to reverse the policies of their predecessors than to embark on their own initiatives. Subfunction complexity is again a strong predictor of major spending changes. This matches theoretical expectations; agencies assigned to the same budget function experience fiscal windfalls and hardships together.
Discussion
Previous research focuses generally on cognitive and institutional limitations as the primary cause of punctuations in outputs from various organizational decision-making processes. The goal in this chapter has been to unpack the black box these limitations have come to
represent and encourage a discussion of the factors that may explain variation in the degree of punctuations seen in various political outcomes. The advantage of this approach is that it directly measures relevant inputs, considering how variance in the stability of different input series can help explain the occurrence of punctuations. Budget categories which are tied to unstable inputs are much more likely to experience spending punctuations than are those categories linked to more stable input series. The other powerful predictor of punctuations was political complexity, which was operationalized in the model using the subfunction-complexity score. But governing conditions, including presidential term year and majority party control of government, apparently have little effect on the occurrence of punctuations. The exception to this was polarization, which greatly reduced the likelihood of punctuations in any direction.
Given these findings, we can reasonably expect that even a government operating without cognitive or institutional frictions would occasionally produce spending punctuations, so long as it was responsive to changing stochastic events. By tying large portions of the budgets to
46
47
CHAPTER THREE: HOW ROBUST ARE DISTRIBUTIONAL FINDINGS OF PUNCTUATED EQUILIBRIUM IN PUBLIC BUDGETS?
A curious finding from Chapter 2 was that many spending punctuations appear to be immediately followed by a dramatic change in the opposite direction. Negative punctuations were 900% more likely after a positive punctuation and positive punctuations 400% more likely after major spending cuts. This suggests that punctuations are often fleeting, with policymakers moving to reverse major shifts in spending after only one year. This temporary dynamic is hard to reconcile with punctuation equilibrium theory, which emphasizes competition between policy solutions as a key driver of political instability. The logic of this idea is that the negative
feedback forces that generate the equilibrium can occasionally be disrupted, creating a surge of self-reinforcing changes that rapidly achieve a new equilibrium. But if punctuations see major reversals after only one year, then it would be difficult to claim that some new equilibrium has been reached. That is, far from paradigm-shifts punctuations may indicate brief governmental interventions to address temporary and stochastic problems.
48
commitments to certain ideas – and the high central peak is caused by inattention to the majority of problems.
Concerns about what causes punctuations can be largely avoided using a historical, case-study approach, and indeed, this is the methodology that was employed by Baumgartner and Jones when developing their theory (1993). It continues to be an important tool in policy studies, but the distributional approach has gained widespread popularity because it offers both a
comprehensive perspective and facilitates international comparisons. There is in this case a tradeoff between generalizability and precision. In this chapter I ask if the tails and central peaks of budget distributions could be generated by factors inconsistent with the theory of punctuated equilibrium. I begin by exploring how often and how quickly punctuations see reversals and then assess the robustness of fat-tailed distributions controlling for relevant factors.
Background
My approach is informed by previous research that explores the nature of policy