Contrast Enhanced Superharmonic Imaging for Acoustic
Angiography Using Reduced Form-factor Lateral Mode
Transmitters for Intravascular and Intracavity Applications
Zhuochen Wang,
Department of Mechanical and Aerospace Engineering, North Carolina State University, Raleigh, NC 27695, USA
K. Heath Martin,
Joint Department of Biomedical Engineering, University of North Carolina and North Carolina State University, Chapel Hill, NC 27599, USA
Wenbin Huang,
State Key Lab of Mechanical Transmissions, Chongqing University, Chongqing, 400044, China
Paul A. Dayton, and
Joint Department of Biomedical Engineering, University of North Carolina and North Carolina State University, Chapel Hill, NC 27599, USA
Xiaoning Jiang [Member, IEEE]
Department of Mechanical and Aerospace Engineering, North Carolina State University, Raleigh, NC 27695, USA
Abstract
Techniques to image the microvasculature may play an important role in imaging tumor-related angiogenesis and vasa vasorum associated with vulnerable atherosclerotic plaques. However, the microvasculature associated with these pathologies is difficult to detect using traditional B-mode ultrasound or even harmonic imaging due to small vessel size and poor differentiation from surrounding tissue. Acoustic angiography, a microvascular imaging technique which utilizes superharmonic imaging (detection of higher order harmonics of microbubble response), can yield a much higher contrast to tissue ratio (CTR) than second harmonic imaging methods. In this work, two dual-frequency transducers using lateral mode transmitters were developed for superharmonic detection and acoustic angiography imaging in intracavity applications. A single element dual-frequency IVUS transducer was developed for concept validation, which achieved larger signal amplitude, better contrast to noise ratio (CNR) and pulse length compared to the previous work. A dual-frequency PMN-PT array transducer was then developed for superharmonic imaging with dynamic focusing. The axial and lateral size of the microbubbles in a 200 μm tube were measured to be 269 μm and 200 μm, respectively. The maximum CNR was calculated to be 22 dB. These results show that superharmonic imaging with a low frequency lateral mode transmitter is a
Declaration
HHS Public Access
Author manuscript
IEEE Trans Ultrason Ferroelectr Freq Control
. Author manuscript; available in PMC 2018February 01.
Published in final edited form as:
IEEE Trans Ultrason Ferroelectr Freq Control. 2017 February ; 64(2): 311–319. doi:10.1109/TUFFC. 2016.2619687.
A
uthor Man
uscr
ipt
A
uthor Man
uscr
ipt
A
uthor Man
uscr
ipt
A
uthor Man
uscr
feasible alternative to thickness mode transmitters when final transducer size requirements dictate design choices.
Keywords
Lateral mode transducer; dual-frequency; superharmonic; ultrasound transducer
I. Introduction
Imaging of microvessels with diameters ranging from 2 μm to 200 μm [1] can be used to detect the early phase of tumor development and may also aid in identifying atherosclerotic plaques which cause heart attacks and strokes [2–7]. Traditional B-mode ultrasound (2–20 MHz) is widely used in biomedical diagnostic imaging because of its relative low cost, portability, ease of operation and real-time imaging. However, blood is a poor ultrasound scatterer compared to the surrounding tissues, making it hard to image microvessels [8]. Thus, ultrasound contrast agents (UCAs) (e.g. microbubbles) are used to increase the scattering and thereby improve imaging of blood flow [9].
Although in standard fundamental B-mode imaging, UCAs can result in improved contrast from the blood pool, contrast with surrounding tissue is still limited. Blood is a poor scatterer at diagnostic frequencies (2–20 MHz) typically used in the clinic and vessels appear anechoic during imaging. When contrast agents are administered, the blood vessels opacify due to the increased echogenicity provided by the microbubbles, but the vessel are not easily discernable from the surrounding tissue which has similar backscatter, leading to poor contrast and low CTR [10]. Harmonic imaging of UCAs, transmitting at a lower frequency and receiving the signal from the second harmonic, can yield a higher CTR with less near field artifacts than fundamental B-mode imaging. This imaging technology may be used to improve the visualization and assessment of cavities, large vessels, and bulk blood flow in organs and tissues [11, 12]. Harmonic imaging technology was developed from conventional transabdominal and transthoracic echocardiography, and soon applied in smaller diagnostic transducers, for ophthalmic, urologic, and intravascular ultrasound purposes [13–19].
Most of the echo from the tissue is confined to the fundamental frequency and low order harmonics [20]. In contrast, superharmonic imaging, where higher order harmonics are detected, provides improved differentiation of UCAs from tissue and higher resolution in the resulting images [21]. Some work have been done to study the optimization of microbubble response, including varying pulse window and phase of the signal, changing the bubble size, adjusting the frame number, and controlling the peak negative pressure [22, 23]. Typically, for non-inertial cavitation superharmonic imaging, higher order non-linear responses are maximized by exciting microbubbles with a large peak negative pressure or at a frequency close to the resonant frequency of the microbubble. This resonant frequency depends primarily on bubble diameter, though many other physical factors also play a role in determining resonance [24, 25].
A
uthor Man
uscr
ipt
A
uthor Man
uscr
ipt
A
uthor Man
uscr
ipt
A
uthor Man
uscr
Studies have shown that lower frequency (1–3 MHz) acoustic waves can excite
microbubbles more effectively to generate non-linear responses from microbubbles that are necessary for contrast specific imaging. Kruse et al. received broadband microbubbles response exceeded 45 MHz with short pulses at 2.25 MHz [26]. Gessner et al. reported 3-D contrast imaging of in vivo microvasculature with a dual-frequency transducer (2.5 MHz/30 MHz) [27]. Lindsey et al showed that CTR of superharmonic imaging can be improved by detecting the non-linear high-frequency signal from microbubbles excited at lower frequencies [28]. Wang et al. reported preliminary superharmonic contrast imaging results with a lateral mode intravascular ultrasound (IVUS) cylindrical transducer array transmitter (2.25 MHz) and commercial piston receivers (15 MHz, 20 MHz and 25 MHz) [29].
Microvascular images produced with transmission between 2–4 MHz and detection between 15–45 MHz have demonstrated very high resolution and CTR, producing images similar to x-ray angiography, and images produced with this dual-frequency ultra-broadband contrast imaging approach have been referred to as “acoustic angiography” [30–33].
Small diagnostic transducers are important for extending the possibilities of intravascular, intracardiac, and transesophageal ultrasound [34]. Superharmonic imaging using a small single element intravascular ultrasound transducer has been demonstrated with a
transmission at 6.5 MHz [35], but it is likely that these results may be improved by using a lower transmission frequency (1–3 MHz). Miniaturization of the lower frequency transducer can be achieved by utilizing the lateral excitation mode in developed transducers. Some therapeutic IVUS catheters have been designed using lateral mode excitation for thermal ablation and drug delivery previously [36–38]. Transducer arrays have several benefits over single-element transducers, such as electrical scan and dynamic focusing, which can result in higher frame rates and decreased point spread functions, respectively [39]. Despite these advantages, early studies comparing commercial transducers favored single-elements over array designs in terms of image quality [40], suggesting array design in IVUS may be improved. Under the same input voltage, a lateral mode transducer having a smaller thickness between electrodes would have a higher electric field compared to a thickness mode transducer at the same frequency. Lateral mode transmitters are also suitable for developing an array.
In this work, two dual-frequency transducers with lateral mode, low frequency transmitters are demonstrated for superharmonic imaging (over 12th harmonic). First, a dual-frequency single element IVUS transducer with a lateral mode low frequency transmitter was developed for contrast enhanced intravascular ultrasound (CE-IVUS) imaging and to validate the concept. Next, a dual-frequency PMN-PT array using a lateral mode low frequency transmitter was developed for superharmonic imaging in larger cavities (e.g. intracardiac and transesophageal ultrasound). In both cases, the center frequency of the transmitters was selected to be 2.25 MHz to excite microbubbles effectively, while the center frequency of the receivers was 30 MHz. The dual-frequency transducers were used for superharmonic contrast testing and real-time superharmonic imaging.
A
uthor Man
uscr
ipt
A
uthor Man
uscr
ipt
A
uthor Man
uscr
ipt
A
uthor Man
uscr
II. Methods
A. Lateral mode transmitter
Low frequency (1–3 MHz) acoustic wave excitation is a promising method for contrast imaging because it can generate non-linear microbubbles responses more effectively from large bubbles by exciting them near their resonant frequency. However, low frequency transducers in conventional thickness mode require a large dimension in thickness and may not be suitable for some applications with limited accessible space (e. g. intravascular, intracardiac, and transesophageal). For example, a 2.25 MHz thickness mode transmitter
would require a thickness of approximately 1 mm for Pb(Mg1/3Nb2/3)O3]-x[PbTiO3]
(PMN-PT). This dimension would not suitable for an IVUS transducer (3 French = 1 mm) after integration with matching layer, backing layer and housing.
In addition to the thickness vibration mode, ultrasound transducers can be designed to operate in lateral vibration modes (Figure. 1). In a lateral vibration mode, the resonant frequency is determined by the width or length of the piezoelectric layer rather than the
thickness [35]. The coupling coefficients of lateral mode (k31=0.51) of PMN-PT is smaller
than the coupling coefficients of thickness mode (kt=0.62, and k33=0.91), leading to a
reduction in performance of the transducer in regards to sensitivity and bandwidth [41].
While because of high elastic compliance of PMN-PT ( ), the transverse
frequency coefficient (N31) of PMN-PT is much lower than the thickness frequency
coefficient (Nt) (721 vs 2002 m•Hz).
(1)
(2)
where N31 is the transverse frequency coefficient, Nt is the thickness frequency coefficient, ρ
is the density = 8050 kg/m3, is the elastic compliance, is the elastic stiffness = 129 GPa.
As a result, the lateral mode transducer can achieve a low resonant frequency with small dimensions in both thickness and width. Compared to the conventional thickness mode transducer, the aspect ratio (width/thickness) of a lateral mode transducer can be larger, resulting in lower electrical impedances at low frequencies. Furthermore, the electric field developed in a lateral mode transducer would be higher than a thickness mode transducer at same frequency due to the decreased dimension (thickness) between the electrodes.
Consequently, lower input voltages can be used to achieve the same electric field. Therefore, in order to develop a low frequency (e.g. 2 MHz) transmitter without increasing the size of the transducer, the lateral mode design approach was selected to achieve efficient low frequency ultrasound output.
A
uthor Man
uscr
ipt
A
uthor Man
uscr
ipt
A
uthor Man
uscr
ipt
A
uthor Man
uscr
B. Dual-frequency Single Element IVUS Transducer
1) Transducer Design and Characterization—The dual-frequency IVUS transducer consists of a low frequency transmitter (2.25 MHz) at the bottom and a high frequency receiver (30 MHz) layered on top of it (Figure. 2). As the elements were aligned overlapped in stack structure [42–44], the beam of both frequencies will overlap as well, making it suitable for superharmonic imaging. In the stack structure, the two active layers cannot be bonded together directly as this would cause aliasing echoes to be generated that can shift the resonant frequencies of both layers and impact the bandwidth [45]. In order to prevent this, a frequency-selective isolation layer that functions as a quarter wavelength anti-matching layer has to be placed in between the two elements in order to isolate the top layer from the bottom layer in the high frequency mode [46]. PMN-PT was selected as the active material because of its high coupling coefficients, high dielectric constant and low transverse frequency coefficient (Table I).
The isolation layer thickness and the material selection, as well as the pulse-echo response of the high frequency receiver, were designed using the KLM model [47]. For low frequency lateral mode transmitter, the frequency response of the electric impedance was simulated with COMSOL (COMSOL, Inc., Burlington, MA). After the transducer design and fabrication, the transducer was characterized by measuring electrical impedance, the pulse-echo response of the high frequency receiver, and the acoustic output of the low frequency transmitter. The detailed method of transducer design, fabrication, and transducer
characterizations can be found in [48].
2) Contrast Test—Contrast tests were conducted in a water tank using poly-dispersed (1– 10 μm diameter) lipid coated microbubbles, prepared in-house [49], at diluted concentrations (2 × 10⁷ MBs/mL). Microbubbles were pumped through a micro tube made of acoustically transparent material with a diameter of 200 μm. The distance between the transducer and the micro tube was matched to the depth used for pressure measurements (2 mm). The
experimental setup is depicted in Figure 3.
Microbubbles in the micro tube were excited by the low frequency transmitter using a 2.25 MHz, 1-cycle sine burst excitations generated by an arbitrary function generator (AFG3101, Tektronix Inc., Beaverton, OR) and a radio-frequency amplifier (Model 3200L, Electronic Navigation Industries Inc., Rochester, NY). The superharmonic non-linear responses from excited microbubbles were then detected by the high frequency receiver and recorded using an in-house LabVIEW (National Instruments Co., Austin, TX) data acquisition system and A/D card (Signatec PDA14, Corona, CA) at 100 MHz sampling rate. 24 dB of gain was applied on the high frequency response. The superharmonic signal, contrast to noise ratio (CNR) and pulse length of superharmonic echo were measured. The CNR of the single element IVUS transducer was measured as the ratio between maximum microbubble response and the mean noise level. Experimental results were recorded as a function of different excitation voltages (e.g. 20V, 40V, 60V and 80V).
A
uthor Man
uscr
ipt
A
uthor Man
uscr
ipt
A
uthor Man
uscr
ipt
A
uthor Man
uscr
C. Dual-Frequency Array Transducer
1) Transducer Design and Characterization—This dual-frequency array consists of 8 low frequency lateral mode transmission sub-elements and 32 high frequency receiving elements (Figure. 4). The center frequency of the transmitter was selected to be 2.25 MHz to excite microbubbles more effectively, while the frequency of the receivers was designed to be 30 MHz for high image resolution. The width to height aspect ratio of each layer is important for the lateral mode transducer. For the low frequency transmitter, the aspect ratio was designed close to 1 to enhance the lateral mode, by using COMSOL simulation; while the aspect ratio of the high frequency layer was designed to be greater than 2 to promote thickness mode operation, which was simulated by using KLM model. An acoustic isolation layer was also placed in between the two PMN-PT active layers to reduce the ringdown of the high frequency receiver layer and to improve the performance.
The pulse-echo response of high frequency receiving layer, acoustic pressure and acoustic mapping of low frequency transmitter were tested to evaluate the performance of the dual-frequency array. The detailed method of design, electrical and acoustical characterization of this dual-frequency array transducer were reported in [50].
2) Real-time Contrast Imaging—Real-time contrast imaging was conducted with the Verasonics programmable ultrasound system (Verasonics Vantage, Redmond, WA). The Verasonics sampling frequency (quadruple of the base frequency) was set to be 62.5 MHz (15.6 MHz as base frequency), which is the maximum frequency setting of our Verasonics System. Since the maximum sampling rate of the Verasonics system is 62.5 MHz, the upper band of the receiving signal is limited to 31.25 MHz. The contrast images were rendered using a proprietary Verasonics linear scan beamforming algorithm and a built-in bandpass filter (19–30 MHz). A plane wave generated from 8 low frequency sub-elements first excites the microbubble contrast agents; then higher order non-linear microbubble responses were collected with high frequency receivers; the position and amplitude information of
microbubble response were reconstructed with dynamic receive focusing of filtered signals. The constant f-number on the receivers was set to be 1.26. The maximum voltage of the low frequency transmitter is 55 V due to the limitation of the Verasonics system at the functional frequency.
Contrast tests were conducted in a water tank using lipid coated microbubbles (1–10 μm diameter) at diluted concentrations (1 × 10⁸ MBs/mL). Contrast agents were passed through a micro tube made of acoustically transparent material with a diameter of 200 μm. The flow rate was set to be 10 mL/hr. The distance between the transducer and the micro tube was set to be 5.5 mm (Figure. 5).
Microbubbles in the micro tube were excited by the low frequency transmitter with a 2.23 MHz, 1-cycle burst using either 55 V or 35 V excitation for comparison. The superharmonic non-linear responses from excited microbubbles were then detected by the high frequency receivers. The real-time contrast imaging, average of 10 images, was observed from the monitor and saved for later offline evaluation. The axial and lateral superharmonic image resolutions were calculated quantitatively from the axial and lateral profile of the microbubbles responses. The CNR of the array transducer was measured as the ratio
A
uthor Man
uscr
ipt
A
uthor Man
uscr
ipt
A
uthor Man
uscr
ipt
A
uthor Man
uscr
between maximum microbubble response and the mean of the noise in an area of 3 mm by 3 mm.
3) Electric Matching—The electrical impedance of the transducer at resonance is inversely proportional to the capacitance of the transducer or, in another words, the surface area of the piezoelectric element.
(3)
where Z is the electrical impedance, C is the capacitance, d is the thickness and A is the surface area of the piezoelectric element.
Since the aperture size of each high frequency receiver is small in the array design, the
electrical impedance of the high frequency receiver is large (~ 200 Ω) and not compatible
with most high frequency systems (50 Ω). Additionally, because of the high capacitive
reactance, the electrical impedance of the high frequency receivers is highly capacitive at resonance.
Transmission line theory allows a coaxial cable to function as an impedance transformer so that the device can be electrically matched to the electronics to avoid reflections and reduced power delivery [51]. Hence, a coaxial cable was used to connect the transducer array to the Verasonics system (Verasonics, Redmond, VA), and the electric impedance between the transducer element and the Verasonics system can then be matched [52].
III. Results and Discussion
A. Dual-frequency Single Element IVUS Transducer
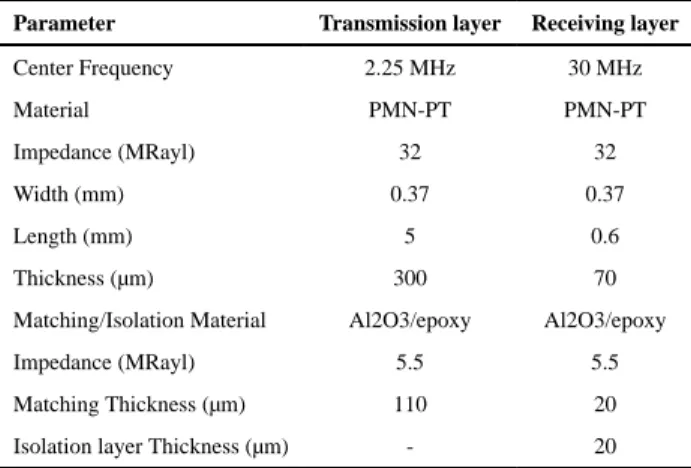
Based on the finite element analysis and KLM simulation, the material and dimension of the transducer was selected (Table II). The size of the low frequency transmitter was 5 mm × 0.37 mm × 0.3 mm. The high frequency receiver was designed with an aperture size of 0.5 mm × 0.37 mm × 0.07 mm with a 20 μm thick matching layer (Al2O3/Epo-tek 301 (Epoxy Technology Inc, Billerica, MA)). A 20 μm thick Al2O3/Epo-tek 301 layer for frequency selective isolation was placed in between the two piezoelectric layers. This suppressed the ringdown and aliasing echo of the high frequency receiver operating in pulse-echo mode. The presence of the isolation layer did not significantly alter the low frequency transmitted pressure because the isolation layer was thin compared to the wavelength of the low frequency mode (1244 μm) [53–55].
This IVUS transducer achieves low frequency transmission at a size that is applicable for use in interventional procedures and meets the size requirements for typical 3 Fr coronary catheters (Figure 6). The −6 dB fractional bandwidth of the high frequency receiver was measured to be 32 % with a center frequency of 32 MHz, covering a frequency span of 27 – 37.3 MHz [48]. When a 1 cycle burst excitation at 2.25 MHz was applied to the low frequency transmitter, the peak negative pressure at 2 mm reached 575 kPa at 80 V [48],
A
uthor Man
uscr
ipt
A
uthor Man
uscr
ipt
A
uthor Man
uscr
ipt
A
uthor Man
uscr
which is enough to excite the microbubbles. Further details of the transducer fabrication and characterization can be found elsewhere [48].
The high frequency response of microbubbles was successfully detected by the high frequency receiver with a CNR of 13 dB (Figure 7a). Microbubbles responses under different excitation voltages were compared in Figure 7b. Significant microbubbles
responses were detected with 1 cycle burst excitation of 60 V and 80 V. When the excitation voltage was lower than 40 V, no microbubble signal could be detected. The contrast signal with an amplitude of 45 mV under 24 dB gain (or 2.8 mV without gain) and an −6 dB pulse length of 150 μm (0.1 μs) were achieved.
Compared to our previous thickness mode dual-frequency IVUS transducer (6.5 MHz/30 MHz) [35], this dual-frequency IVUS transducer (2.25 MHz/30 MHz) with a lateral mode transmitter has improved performance in signal amplitude, CNR and pulse length of the superharmonic echo (Table III). Moreover, the required peak negative pressure to produce detectible nonlinear microbubble response has been cut in half to 450 kPa (under 60 V excitation), with a relative low mechanical index (0.3) [48].
The lower transmission frequency (2.25 MHz) can excite our standard microbubble population near resonance to produce more nonlinear signals at a given pressure than other frequencies. With lower excitation frequency (2.25 MHz vs 6.5 MHz), the receiver (30 MHz) can collect higher order harmonic responses, which isolates the UCA response with less tissue contamination, and achieves a higher CNR. Also, since the 2.25 MHz
transmission excited microbubbles more efficiently, the pulse length can be reduced.
With a lateral mode transmitter, the dual-frequency IVUS transducer achieved 2.25 MHz/30 MHz with a diameter less than 1 mm, which is suitable for IVUS application. The aperture size of this dual-frequency IVUS transducer is 3 mm by 0.37 mm. Because of our bonding capability, the rigid length of this prototyped transducer is enlarged to 5 mm, which is larger than commercial IVUS transducers, and may cause difficulty to navigate in some narrow vessels. The rigid length of the prototyped transducer is still less than Volcano Eagle Eye IVUS array, which is with 8 mm in the total rigid length. In the future work, we will reduce the size of bonding area to make the transducer smaller and more suitable for IVUS applications.
The results showed that this lateral mode dual-frequency IVUS transducer can be used to detect super-harmonic signals (12th to 15th harmonic) with a shorter pulse length, higher CNR and a relatively low mechanical index, suggesting a good potential for clinical applications.
B. Dual-frequency Array Transducer
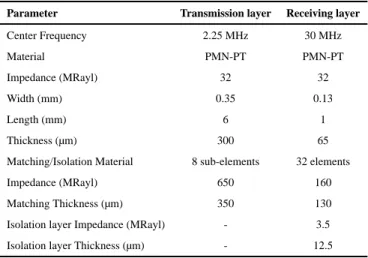
In order to achieve lateral mode transmission at 2.25 MHz, the element size of the low frequency layer was designed as 6 mm × 0.35 mm × 0.3 mm, with a pitch of 0.65 mm, which is smaller than one wavelength at 2.25 MHz. Each high frequency receiver was designed with dimensions of 1 mm × 0.13 mm × 0.06 mm to obtain a center frequency of 30 MHz. The pitch of high frequency receivers was design to be 160 micron, which is larger
A
uthor Man
uscr
ipt
A
uthor Man
uscr
ipt
A
uthor Man
uscr
ipt
A
uthor Man
uscr
than three wavelength at 30 MHz. This pitch size is an compromise of desired aspect ratio (> 2) and crystal volume fraction (80 %) based on our fabrication capability (Table IV).
A polyimide (PI) film based single layer flexible printed circuit (FPC) was used for both electrical connectivity and as the isolation layer of the high frequency receivers because of its low acoustic impedance. The thickness of the PI substrate is 12.5 μm and a 2 μm copper circuit was patterned on it. As mentioned previously, the isolation layer does not
significantly alter the low frequency transmission because the isolation layer is thin
compared to the wavelength of the low frequency mode. Similarly, it was expected that the 2 μm thick copper electrode would not impact the isolation function since it is negligibly thin compared to the wavelength of the receiving array in copper (170 μm).
The dual-frequency array transducer was prototyped as shown in Figure. 8. The flex circuits, PCB board, and additional wires were used for cable wiring between the elements and the
Verasonics connector (DL260, ITT Corporation, Santa Ana, CA). A 75 Ω multi-core coaxial
cable with a length of 2 m, would act as a quarter-wave impedance transformer at 30 MHz
and was used to match the impedance of the transducer to around 30 Ω for better electrical
impedance matching between the Verasonics system and the receiving layer of the transducer (Figure 9).
With a 2-meter coaxial cable (75 Ω), the −6 dB fractional bandwidth of the high frequency
receiver was measured to be 23 % with a center frequency of 29 MHz [50]. The center frequency and −6 dB fractional bandwidth of the low frequency transmitter were measured to be 2.6 MHz and 37%, respectively. The peak negative pressure generated by the low frequency transmitter with the 55 V, 2.25MHz, 2-cycle burst excitation is over 800 kPa at 5 mm axially from the transducer surface, which is high enough to excite the microbubbles for superharmonic imaging purposes. Acoustic mapping of the low frequency transmitter at 5.5 mm away from the aperture showed that the pressure is almost uniform in the interested area, which corresponds to the sensitive region of the receivers [50]. Further information of the transducer fabrication and characterization has been previously reported [50].
The superharmonic images of a 200 μm micro tube with the dual-frequency array under different excitation voltages are shown in Fig. 10. With 1 cycle burst 55 V excitation and 627 kPa in PNP, the signal is clear but axial resolution is even worse than the lateral resolution (Figure 10a). That is because there was not a backing layer nor a good matching layer for our low frequency transmitter, leading a longer pulse length and ring down. Besides of the main negative peak of the transmission wave form, the other peaks also exceed the threshold and can excite the microbubbles to generate high order non-linear response; thus producing some axial aliasing of the micro tube and impacts the axial resolution. The axial resolution can be improved with a lower excitation amplitude, hence the only main peak of the transmission waveform can excite the microbubbles. With a 1 cycle burst at 35 V and 400 kPa in PNP, only one spot can be observed, with a higher axial resolution (Figure 10b). As expected, with lower excitation amplitude, the CNR will be lower.
The axial and lateral estimates of the image resolution using different excitation voltages were calculated by measuring the full-width half-maximum (FWHM) of the microbubbles
A
uthor Man
uscr
ipt
A
uthor Man
uscr
ipt
A
uthor Man
uscr
ipt
A
uthor Man
uscr
responses from the enveloped and log compressed image data. Raw pixel data from superharmonic imaging were saved and processed with Matlab (MathWorks, Natick, MA.). Dimensions of microbubble responses along the depth and lateral directions were calculated separately to estimate the axial and lateral FWHM. The axial and lateral microbubbles responses under different excitation voltages are shown in Figure 11 (under 55 V excitation) and Figure 12 (under 35 V excitation).
Under 55 V excitation there were two peaks above −6 dB in amplitude measured axially. The −6 dB response of the main peak was 295 μm and the total axial FWHM was 600 μm. In the lateral direction, the −6 dB response shows that the lateral FWHM was 271 μm. The decreased CNR in the lateral direction may be attributed to the pitch size of the receiving array being larger than 3 wavelengths, which would produce grating lobes. Additionally, cross talk between adjacent elements may introduce noise that would have reduced the CNR and resolution of the system. Overall, the CNR of the microbubbles response was about 22 dB.
The axial FWHM using 35 V for the excitation was measured as 269 μm and the lateral FWHM was measured as 200 μm. As expected, the measurements using a lower excitation voltage were better, especially considering the elimination of multiple images of the tube when using lower voltages. On the other hand, the lower excitation voltage had a lower CNR. The CNR was about 17 dB.
It must be noted that the micro tube resolution results represent the combined performance of both the transducer and the chosen beamformer, which in this work was the Verasonics’ pixel-based beamformer. The calculated FWHM is not the real resolution but the
microbubble responses in a micro tube which size is not negligible compared to the wavelength of the receiver. Also, the FWHM was calculated based on the microbubble response, which may not fill the entire chamber of the micro tube. Furthermore, because of the frequency limitation of the Verasonics system, the frequency components above 31.25 MHz were cut off which will likely impact the reported values of FWHM. Even with this limitation, the dual-frequency array can detect the superharmonic response of microbubbles using a relatively low excitation voltage.
IV. Conclusion
This paper reports the use of lateral mode transmitters both in single element and in an array fabrication in order to detect the higher order harmonics for contrast enhanced ultrasound. A dual-frequency single element IVUS transducer (2.25 MHz/30 MHz) with a lateral mode transmitter was developed and characterized by superharmonic contrast testing for concept validation before extending this approach to an array. This transducer was small enough for use in IVUS catheter sizes typically used for coronary interventions (<3 Fr). Additionally, a dual-frequency array transducer (2.25 MHz/30 MHz) with small lateral mode transmitter (300 μm in thickness) for superharmonic imaging was developed and tested. Real-time contrast imaging was conducted with a Verasonics system.
A
uthor Man
uscr
ipt
A
uthor Man
uscr
ipt
A
uthor Man
uscr
ipt
A
uthor Man
uscr
The contrast test of the dual-frequency single element IVUS transducer shows that the higher order non-linear response (12th to 15th harmonic) was large enough to be detected with low pressure, 1-cycle burst excitation. Compared to our initial 6.5 MHz/30 MHz IVUS transducer design, this dual-frequency IVUS transducer with a lateral mode transmitter (2.25 MHz/30 MHz) had larger signal amplitude, better CNR and better pulse length in contrast tests.
The dual-frequency array transducer with a lateral mode transmitter can be used for real time superharmonic imaging with a low frequency, 1 cycle burst excitation. The axial and lateral FWHM of a 200 μm contrast-filled tube operating in superharmonic imaging mode were measured to be 269 μm and 200 μm, respectively. The maximum CNR was calculated to be 22 dB. The imaging results show that superharmonic imaging with a low frequency lateral mode transmitter is feasible and may be used in future applications for contrast agent detection in medical ultrasound.
Acknowledgments
This work was supported by the National Institutes of Health grant R01EB015508 and the Department of Defense W81XWH-12-1-0303.
References
1. Sluimer JC, Daemen MJ. Novel concepts in atherogenesis: angiogenesis and hypoxia in atherosclerosis. J Pathol. 2009; 218(1):7–29. [PubMed: 19309025]
2. Chomas JE, Pollard RE, Sadlowski AR, Griffey SM, Wisner ER, Ferrara KW. Contrast-enhanced US of microcirculation of superficially implanted tumors in rats. Radiology. Nov; 2003 229(2):439– 446. [PubMed: 14526091]
3. Foster FS, Burns PN, Simpson DH, Wilson SR, Christopher DA, Goertz DE. Ultrasound for the visualization and quantification of tumor microcirculation. Cancer Metastasis Rev. 2000; 19(1–2): 131–138. [PubMed: 11191052]
4. Virmani R, Kolodgie FD, Burke AP, Finn AV, Gold HK, Tulenko TN, Wrenn SP, Narula J. Atherosclerotic plaque progression and vulnerability to rupture: angiogenesis as a source of intraplaque hemorrhage. Arterioscler Thromb Vasc Biol. 2005; 25(10):2054–2061. [PubMed: 16037567]
5. Naghavi M, Libby P, Falk E, Casscells SW, Litovsky S, Rumberger J, Badimon JJ, Stefanadis C, Moreno P, Pasterkamp G, Fayad Z. From vulnerable plaque to vulnerable patient a call for new definitions and risk assessment strategies: part I. Circulation. 2003; 108(14):1664–1672. [PubMed: 14530185]
6. Spagnoli LG, Mauriello A, Sangiorgi G, Fratoni S, Bonanno E, Schwartz RS, Piepgras DG, Pistolese R, Ippoliti A, Holmes DR. Extracranial thrombotically active carotid plaque as a risk factor for ischemic stroke. Jama. 2004; 292(15):1845–1852. [PubMed: 15494582]
7. Shelton SE, Lee YZ, Lee M, Cherin E, Foster FS, Aylward SR, Dayton PA. Quantification of Microvascular Tortuosity during Tumor Evolution Using Acoustic Angiography. Ultrasound Med Biol. 2015; 41(7):1896–904. [PubMed: 25858001]
8. Shung, KK., Thieme, GA. Ultrasonic Scattering in Biological Tissues. CRC Press; 1992. 9. Gramiak R, Shah PM. Echocardiography of the aortic root. Invest Radiol. 1968; 3(5):356–366.
[PubMed: 5688346]
10. Frinking PJA, Bouakaz A, Kirkhorn J, ten Cate FJ, de Jong N. Ultrasound contrast imaging: current and new potential methods. Ultrasound Med Biol. 2000; 26(6):965–975. [PubMed: 10996696]
11. de Jong N, Frinking PJ, Bouakaz A, ten Cate FJ. Detection procedures of ultrasound contrast agents. Ultrasonics. 2000; 38(1):87–92. [PubMed: 10829635]
12. Tang MX, Mulvana H, Gauthier T, Lim AKP, Cosgrove DO, Eckersley RJ, Stride E. Quantitative contrast-enhanced ultrasound imaging: a review of sources of variability. Interface Focus. 2011; 1(4):520–539. [PubMed: 22866229]
13. Silverman RH, Coleman DJ, Ketterling JA, Lizzi FL. High-frequency harmonic imaging of the eye. Medical Imaging, SPIE. 2005:16–25.
14. Merks EJW, Bouakaz A, Bom N, Lancee CT, van der Steen ATF, de Jong N. Design of a multilayer transducer for acoustic bladder volume assessment. IEEE Trans Ultrason Ferroelectr Freq Control. 2006; 53(10):1730–1738. [PubMed: 17036782]
15. Vos HJ, Frijlink MA, Droog E, Goertz DE, Blacquiere G, Gisolf A, de Jong N, van der Steern AFW. Transducer for harmonic intravascular ultrasound imaging. IEEE Trans Ultrason Ferroelectr Freq Control. 2005; 52(12):2418–2422. [PubMed: 16463509]
16. Frijlink ME, Goertz DE, van Damme LCA, Krams R, van der Steen AFW. Intravascular ultrasound tissue harmonic imaging in vivo. IEEE Trans Ultrason Ferroelectr Freq Control. 2006; 53(10): 1844–1852. [PubMed: 17036792]
17. Frijlink ME, Goertz DE, Vos HJ, Tesselaar E, Blacquière G, Gisolf A, Krams R, van der Steen AFW. Harmonic intravascular ultrasound imaging with a dual-frequency catheter. Ultrasound Med Biol. 2006; 32(11):1649–1654. [PubMed: 17112951]
18. Goertz DE, Frijlink ME, Tempel D, van Damme LC, Krams R, Schaar JA, Folkert J, Serruys PW, de Jong N, van der Steen AF. Contrast harmonic intravascular ultrasound: a feasibility study for vasa vasorum imaging. Invest Radiol. 2006; 41(8):631–638. [PubMed: 16829746]
19. Maresca D, Skachkov I, Renaud G, Jansen K, van Soest G, de Jong N, van der Steen AFW. Imaging Microvasculature with Contrast-Enhanced Ultraharmonic Ultrasound. Ultrasound Med Biol. 2014; 40(6):1318–1328. [PubMed: 24613639]
20. Averkiou, M. Tissue harmonic imaging. IEEE Int. Ultrason. Symp; 2000; p. 1563-1572. 21. Bouakaz A, Frigstad S, Cate FJT, de Jong N. Super harmonic imaging: a new imaging technique
for improved contrast detection. Ultrasound in Med & Biol. 2002; 28:59–68. [PubMed: 11879953] 22. Lindsey BD, Shelton SE, Dayton PA. Optimization of Contrast-to-Tissue Ratio Through Pulse
Windowing in Dual-Frequency “A coustic Angiography” Imaging. Ultrasound in Med & Biol. 2015; 41(7):1884–1895. [PubMed: 25819467]
23. Lindsey BD, Rojas JD, Dayton PA. On the relationship between microbubble fragmentation, deflation and broadband superharmonic signal production. Ultrasound in Med & Biol. 2015; 41(6): 1711–1725. [PubMed: 25766572]
24. Talu E, Hettiarachchi K, Zhao S, Powell RL, Lee AP, Longo ML, Dayton PA. Tailoring the size distribution of ultrasound contrast agents: Possible method for improving sensitivity in molecular imaging. Mol Imaging. 2007; 6(6):384–392. [PubMed: 18053409]
25. Streeter JE, Gessner R, Miles I, Dayton PA. Improving sensitivity in ultrasound molecular imaging by tailoring contrast agent size distribution: In vivo studies. Mol Imaging. 2010; 9(2):87–95. [PubMed: 20236606]
26. Kruse DE, Ferrara KW. A new imaging strategy using wideband transient response of ultrasound contrast agents. IEEE Trans Ultrason Ferroelectr Freq Control. 2005; 52(8):1320–1329. [PubMed: 16245601]
27. Gessner RC, Lukacs M, Lee M, cherin E, Foster FS, Dayton PA. High-resolution, high-contrast ultrasound imaging using a prototype dual-frequency transducer: In vitro and in vivo studies. IEEE Trans Ultrason Ferroelectr Freq Control. 2010; 57(8):1772–1781. [PubMed: 20679006]
28. Lindsey BD, Rojas JD, Martin KH, Shelton SE, Dayton PA. Acoustic characterization of contrast-to-tissue ratio and axial resolution for dual-frequency contrast-specific acoustic angiography imaging. IEEE Trans Ultrason Ferroelectr Freq Control. 2014; 61(10):1668–1687. [PubMed: 25265176]
29. Wang, Z., Ma, J., Jiang, X., Martin, KH., Dayton, PA. An array transmitter for dual-frequency contrast enhanced intravascular ultrasound imaging. IEEE Int. Ultrason. Symp; 2014; p. 2104-2107.
30. Gessner RC, Aylward SR, Dayton PA. Mapping microvasculature with acoustic angiography yields quantifiable differences between healthy and tumor-bearing tissue volumes in a rodent model. Radiology. 2012; 264(3):733–740. [PubMed: 22771882]
31. Gessner RC, Frederick CB, Foster FS, Dayton PA. Acoustic angiography: A new imaging modality for assessing microvasculature architecture. Int J Biomed Imaging. 2013; 2013 art. no. 936593. 32. Martin KH, Dayton PA. Current status and prospects for microbubbles in ultrasound theranostics.
Wiley Interdiscip Rev Nanomed Nanobiotechnol. 2013; 5(4):329–345. [PubMed: 23504911] 33. Martin KH, Lindsey BD, Ma J, Lee M, Li S, Foster FS, Jiang X, Dayton PA. Dual-frequency
piezoelectric transducers for contrast enhanced ultrasound imaging. Sensors. 2014; 14(11):20825– 20842. [PubMed: 25375755]
34. Szabo TL, Lewin PA. Ultrasound transducer selection in clinical imaging practice. J Ultrasound Med. 2013; 32(4):573–582. [PubMed: 23525382]
35. Ma J, Martin KH, Dayton PA, Jiang X. A preliminary engineering design of intravascular dual-frequency transducers for contrast-enhanced acoustic angiography and molecular imaging. IEEE Trans Ultrason Ferroelectr Freq Control. 2014; 61(5):870–880. [PubMed: 24801226]
36. Herickhoff CD, Wilson CM, Grant GA, Britz GW, Light ED, Palmeri ML, Wolf PD, Smith SW. Dual-Mode IVUS Transducer for Image-Guided Brain Therapy: Preliminary Experiments. Ultrasound Med Biol. 2011
37. Herickhoff CD, Grant GA, Britz GW, Smith SW. Dual-mode IVUS catheter for intracranial image-guided hyperthermia: Feasibility study. IEEE Trans Ultrason Ferroelectr Freq Control. 2010; 57(11):2572–2584. [PubMed: 21041144]
38. Kilroy J, Patil A, Rychak J, Hossack J. An IVUS transducer for microbubble therapies. IEEE Trans Ultrason Ferroelectr Freq Control. 2014; 61(3):441–449. [PubMed: 24569249]
39. Macovski A. Ultrasonic imaging using arrays. Proc IEEE. 1979; 67(4):484–495.
40. Fort S, Freeman NA, Johnston P, Cohen EA, Foster FS. In vitro and in vivo comparison of three different intravascular ultrasound catheter designs. Catheter Cardiovasc Interv. 2001; 52(3):382– 392. [PubMed: 11246258]
41. Sherman, CH., Butler, JL. Transducers and arrays for underwater sound. Springer; 2007. 42. Hossack JA, Auld BA. Improving the characteristics of a transducer using multiple piezoelectric
layers. IEEE Trans Ultrason Ferroelectr Freq Control. 1993; 40(2):131–139. [PubMed: 18263166] 43. Hossack, JA., Mauchamp, P., Ratsimandresy, L. A high bandwidth transducer optimized for
harmonic imaging. IEEE Ultrason. Symp; 2000; p. 1021-1024.
44. Wang Z, Li S, Czernuszewicz TJ, Gallippi CM, Liu R, Geng X, Jiang X. Design, fabrication and characterization of a bi-frequency co-linear array. IEEE Trans Ultrason Ferroelectr Freq Control. 2016; 63(2):266–274. [PubMed: 26661069]
45. Azuma T, Ogihara M, Kubota J, Sasaki A, Umemura S, Furuhata H. Dual-frequency ultrasound imaging and therapeutic bilaminar array using frequency selective isolation layer. IEEE Trans Ultrason Ferroelectr Freq Control. 2010; 57:1211–1224. [PubMed: 20442033]
46. Souquet J, Defranould P, Desbois J. Design of low-loss wide-band ultrasonic transducers for noninvasive medical application. IEEE Trans Sonics Ultrason. 1979; 26(2):75–80.
47. Krimholtz R, Leedom DA, Mattaei GL. New equivalent circuits for elementary piezoelectric transducers. Electron Lett. 1970; 41:398–399.
48. Wang, Z., Martin, KH., Dayton, PA., Jiang, X. A dual frequency IVUS transducer with a lateral mode transmitter for contrast enhanced intravascular ultrasound imaging. processing in ASME Int. Mech. Eng. Congress; 2015;
49. Borden MA, Sarantos MR, Stieger SM, Simon SI, Ferrara KW, Dayton PA. Ultrasound radiation force modulates ligand availability on targeted contrast agents. Mol Imaging. 2006; 5:139–147. [PubMed: 16954028]
50. Wang, Z., Huang, W., Jiang, X., Martin, KH., Dayton, PA. Dual-frequency IVUS array for contrast enhanced intravascular ultrasound imaging. IEEE Int. Ultrason. Symp; 2015;
51. Albrecht, AP. Electronic Designer’s Handbook. McGraw-Hill; 1977. Transmission lines; p. 8.1-8.78.
52. Cannata JM, Ritter T, Chen WH, Silverman RH, Shung KK. Design of efficient, broadband single-element (20–80 MHz) ultrasonic transducers for medical imaging applications. IEEE Trans Ultrason Ferroelectr Freq Control. 2003; 50(11):1548–1557. [PubMed: 14682638]
53. Ma, J., Li, S., Wang, Z., Jiang, X. Anti-matching design for wave isolation in dual frequency transducer for intravascular super-harmonic imaging. ASME Int. Mech. Eng. Congress. Expo; p. V003T03A084
54. Ma J, Steer MB, Jiang X. An acoustic filter based on layered structure. Appl Phys Lett. 2015; 106(11)
55. Ma J, Martin KH, Li Y, Dayton PA, Shung KK, Zhou Q, Jiang X. Design factors of intravascular dual frequency transducers for super-harmonic contrast imaging and acoustic angiography. Phys Med Biol. 2015; 60(9):3441. [PubMed: 25856384]
Biographies
Zhuochen Wang was born in Tianjin, China, in 1984. He received his B.S. degree in
mechanical engineering from Tianjin University in 2005, and his M.S. degree in mechanical engineering from University of Akron in 2012. Zhuochen joined Dr. Xiaoning Jiang’s Micro/Nano Engineering Lab at North Carolina State University in 2012, working on the design, fabrication and imaging of piezoelectric ultrasound transducers. He has a broad research interest in intravascular ultrasound (IVUS) transducer, dual frequency ultrasound transducer, transducer array and acoustic radiation force impulse imaging (ARFI)
application.
K. Heath Martin obtained his B.S.E. degree in 2009 from Mercer University in biomedical
engineering and then joined a defense contractor performing finite element analysis. He obtained his Ph. D. from the Joint Department of Biomedical Engineering of North Carolina State University and the University of North Carolina in 2016 regarding his work in the field of contrast specific imaging in intravascular ultrasound. His research interests include cardiovascular device design and signal processing methods for superharmonic ultrasound imaging.
A
uthor Man
uscr
ipt
A
uthor Man
uscr
ipt
A
uthor Man
uscr
ipt
A
uthor Man
uscr
Wenbin Huang received the B.S. degree in mechanical engineering from the University of
Science and Technology of China, Hefei, China, in 2010, and the Ph.D. degree in mechanical engineering from the North Carolina State University, Raleigh, NC, USA, in 2014. He is currently a Researcher with the State Key Lab of Mechanical Transmissions of Chongqing University, Chongqing, China. His research fields include the fundamental study of flexoelectricity and its various sensing applications, especially for structural health monitoring, piezoelectric sensors and actuators, ultrasound transducers for medical imaging and non-destructive testing applications, and micro and nano electromechanical integrated systems. He has authored and co-authored more than 20 peer-reviewed journal papers and two book chapters in related fields.
Paul A. Dayton received his B.S. degree in physics from Villanova University in 1995, his
M.E. degree in electrical engineering from the University of Virginia in 1998, and his Ph.D. degree in biomedical engineering in 2001, also from the University of Virginia. He pursued postdoctoral research and was later research faculty at the University of California, Davis. Much of Dr. Dayton’s training was under the mentorship of Dr. Katherine Ferrara; his initial studies involved high-speed optical and acoustical analysis of individual contrast agent microbubbles. In 2007, Dr. Dayton moved to the Joint Department of Biomedical Engineering at UNC–Chapel Hill and NC State University, Raleigh, where he is now Professor and Associate Department Chair. Dr. Dayton is currently Associate Director for Education for the Biomedical Imaging Research Center, and his research interests involve contrast ultrasound imaging, ultrasound-mediated therapies, and medical devices. Dr. Dayton is a member of the technical program committee for the IEEE UFFC Society, and a member of the editorial boards for the journals IEEE Transactions on Ultrasonics,
Ferroelectrics, and Frequency Control; Molecular Imaging; and Bubble Science, Engineering, and Technology.
A
uthor Man
uscr
ipt
A
uthor Man
uscr
ipt
A
uthor Man
uscr
ipt
A
uthor Man
uscr
Xiaoning Jiang received his B.S. in mechanical engineering from Shanghai Jiaotong
University in 1990, his M.S. in mechanical engineering from Tianjin University in 1992, and his Ph.D. in precision instruments from Tsinghua University in 1997. He received
Postdoctoral trainings from Nanyang Technological University and the Pennsylvania State University from 1997 to 2001. He joined Standard MEMS, Inc. as a R&D Engineer in 2001 and then worked for TRS Technologies, Inc. as a Research Scientist, Senior Scientist, Chief Scientist and Vice President for Technology before joining North Carolina State University in 2009. He is now a Professor of Mechanical and Aerospace Engineering and an Adjunct Professor of Biomedical Engineering. Dr. Jiang is the author and co-author of two book chapters, one book, 9 issued US patents, and over 60 peer reviewed journal papers and over 60 conference papers on piezoelectric composite micromachined ultrasound transducers, ultrasound for medical imaging and therapy, drug delivery, ultrasound NDT/NDE, smart materials and structures and M/NEMS. Dr. Jiang is a member of the technical program committee for IEEE Ultrasonics Symposium, UFFC representative to IEEE Nanotechnology Council, and an editorial board member for the journal Sensors.
A
uthor Man
uscr
ipt
A
uthor Man
uscr
ipt
A
uthor Man
uscr
ipt
A
uthor Man
uscr
Fig. 1.
a) Lateral mode transducer and b) thickness mode transducer.
A
uthor Man
uscr
ipt
A
uthor Man
uscr
ipt
A
uthor Man
uscr
ipt
A
uthor Man
uscr
Fig. 2.
Structure of a dual-frequency IVUS transducer.
A
uthor Man
uscr
ipt
A
uthor Man
uscr
ipt
A
uthor Man
uscr
ipt
A
uthor Man
uscr
Fig. 3.
Experimental setup of the contrast test.
A
uthor Man
uscr
ipt
A
uthor Man
uscr
ipt
A
uthor Man
uscr
ipt
A
uthor Man
uscr
Fig. 4.
Structure of a dual-frequency array transducer.
A
uthor Man
uscr
ipt
A
uthor Man
uscr
ipt
A
uthor Man
uscr
ipt
A
uthor Man
uscr
Fig. 5.
Experimental setup of the real-time superharmonic imaging.
A
uthor Man
uscr
ipt
A
uthor Man
uscr
ipt
A
uthor Man
uscr
ipt
A
uthor Man
uscr
Fig. 6.
Prototype dual-frequency IVUS transducer housed on the tip of a 20 gauge needle.
A
uthor Man
uscr
ipt
A
uthor Man
uscr
ipt
A
uthor Man
uscr
ipt
A
uthor Man
uscr
Fig. 7.
a) Contrast test result under 80V 1-cycle burst excitation. b) Contrast test results under different voltages.
A
uthor Man
uscr
ipt
A
uthor Man
uscr
ipt
A
uthor Man
uscr
ipt
A
uthor Man
uscr
Fig. 8.
Photograph of the prototype dual-frequency array.
A
uthor Man
uscr
ipt
A
uthor Man
uscr
ipt
A
uthor Man
uscr
ipt
A
uthor Man
uscr
Fig. 9.
High frequency array with 2-meter cable, b) electric impedance and b) phase spectrum.
A
uthor Man
uscr
ipt
A
uthor Man
uscr
ipt
A
uthor Man
uscr
ipt
A
uthor Man
uscr
Fig. 10.
Real-time superharmonic imaging. a) Under 55V. b) Under 35V.
A
uthor Man
uscr
ipt
A
uthor Man
uscr
ipt
A
uthor Man
uscr
ipt
A
uthor Man
uscr
Fig. 11.
Microbubble response under 55 V and 627 kPa. a) Axial; b) Lateral.
A
uthor Man
uscr
ipt
A
uthor Man
uscr
ipt
A
uthor Man
uscr
ipt
A
uthor Man
uscr
Fig. 12.
Microbubble response under 35 V and 400 kPa. a) Axial; b) Lateral.
A
uthor Man
uscr
ipt
A
uthor Man
uscr
ipt
A
uthor Man
uscr
ipt
A
uthor Man
uscr
A
uthor Man
uscr
ipt
A
uthor Man
uscr
ipt
A
uthor Man
uscr
ipt
A
uthor Man
uscr
ipt
T
ABLE I
Material Properties of Dif
ferent Acti
v
e Materials
k33 kt k31
εr
Nt N31
PMN-PT
0.91
0.62
0.51
8266
2002
721
PZT
-5H
0.78
0.51
0.43
3400
1975
1421
PZT
-4
0.7
0.49
0.33
1300
1958
A
uthor Man
uscr
ipt
A
uthor Man
uscr
ipt
A
uthor Man
uscr
ipt
A
uthor Man
uscr
ipt
TABLE II
Design Parameters of Single Element Dual-Frequency IVUS Transducer
Parameter Transmission layer Receiving layer
Center Frequency 2.25 MHz 30 MHz
Material PMN-PT PMN-PT
Impedance (MRayl) 32 32
Width (mm) 0.37 0.37
Length (mm) 5 0.6
Thickness (μm) 300 70
Matching/Isolation Material Al2O3/epoxy Al2O3/epoxy
Impedance (MRayl) 5.5 5.5
Matching Thickness (μm) 110 20
A
uthor Man
uscr
ipt
A
uthor Man
uscr
ipt
A
uthor Man
uscr
ipt
A
uthor Man
uscr
ipt
T
ABLE III
Performance of Single Element T
ransducers in Contrast T
est
T
ransducer
# of Cycles
A
pplied v
oltage
Superharmonic echo amplitude
CNR (dB)
−6 dB pulse length
2.25 MHz/30 MHz
1
80 V
2.8 mV
13
0.1 μs
6.5 MHz/30 MHz
1
98 V
~ 1.2 mV
~ 6
-2
98 V
~ 1.9 mV
~ 10
~ 0.4 μs
5
98 V
~ 2.1 mV
~ 11
A
uthor Man
uscr
ipt
A
uthor Man
uscr
ipt
A
uthor Man
uscr
ipt
A
uthor Man
uscr
ipt
TABLE IV
Design Parameters of Dual-Frequency Array
Parameter Transmission layer Receiving layer
Center Frequency 2.25 MHz 30 MHz
Material PMN-PT PMN-PT
Impedance (MRayl) 32 32
Width (mm) 0.35 0.13
Length (mm) 6 1
Thickness (μm) 300 65
Matching/Isolation Material 8 sub-elements 32 elements
Impedance (MRayl) 650 160
Matching Thickness (μm) 350 130
Isolation layer Impedance (MRayl) - 3.5