THE SAMPLING ERROR OF ROTATOR ESTIMATES OF EYE VOLUME
M
ATTHEWG R
EED ANDCV H
OWARDDevelopmental Toxico-Pathology, University of Liverpool, PO Box 147, Liverpool, L69 3B e-mail: [email protected]
(Accepted...)
ABSTRACT
The vertical rotator is a design based stereological method for estimating object volume using measurements made on co-axial sections. Recently we used the method to estimate eye volume in a number of pathological studies. In the present note we apply an error prediction method for the vertical rotator which has recently been published and analyse the raw data from our earlier study on eye volume in juvenile Dover sole. Application of the new theory allows us to assess the variance contributions due to rotating plane and test line sampling and estimate the underlying biological variability in eye volume. In all cases the coefficient of error introduced by the rotating test was about 10 times greater than due to the test line contribution.
Keywords:rotator, stereology, volume.
INTRODUCTION
The vertical rotator is a design based stereological method for estimating object volume using measurements made on co-axial sections (Vedel-Jensen and Gundersen 1993; Cruz-orive and Roberts 1993). The method is widely used for estimating cell volume in neuroscience applications for example Tandrup et al. (1997). However, recently we used the vertical rotator to estimate eye volume (Reed et al., 2001). In the present note we apply an error prediction method for the vertical rotator which has recently been published by Cruz-Orive and Gual-Arnau (2002). Our application is the estimation of eye volumes in juvenile Dover sole (Solea Solea) which we reported in our earlier paper (Reed et al., 2001). For the purposes of the previous study and the analysis presented here “eye volume” is taken to mean the volume of the union of the lens, vitreous humour and retina (Fig. 1a).
The vertical rotator is based on the classical Pappus relationship of Euclidean geometry (e.g., Edwards and Penney, 1982). The vertical rotator aims to estimate the volume, V , of a bounded object which has been randomly rotated and then sectioned such that a central co-axial plane is available for analysis (Vedel-Jensen and Gundersen, 1993; Cruz-Orive and Roberts 1993). In general the test plane containing the vertical axis of revolution intersects the object to yield two half plane transects (Fig. 1b). In the following we make use of the notation of Cruz-Orive and Gual-Arnau (2002). Consider a test plane at an
object transects thus generated are denoted by a(φ) and a(φ+π) respectively and the distances from the axis to the centre of gravity of each of the transects are denoted by l(φ) and l(φ+π) see Fig. 1b. For later computations it is useful to denote the products of these areas and distances the measurement functions
f(φ) and f(φ+π) respectively. If f(φ) can be measured without error and the angle φ has been uniform randomly generated in an interval of 0-π radians then an unbiased estimate of the object volume is given by
[
f
1f
2]
V
ˆ
=
π
⋅
+
, (1) wheref
1=
f
( )
φ
0,
f
2=
f
(
φ
0+
π
)
,
φ
0~
UR
[
0
,
π
)
.If the areas and centres of gravity cannot be measured exactly then there are several manual methods available (Cruz-Orive and Roberts, 1993; Vedel-Jensen and Gundersen, 1993; Mironov and Mironov, 1998). In the following we use the test line method used by Cruz-Orive and Roberts (1993) and Vedel-Jensen and Gundersen (1993).
A test grid of parallel lines, arranged so that it is perpendicular to the axis of revolution, is superposed on a coaxial image and randomly translated up and down the axis. If the lines in the test system are a distance h units apart the following estimates of the measurement function are used
( )
∑
( )
=
=
k i ia
h
f
1
2
φ
φ
ˆ
, (2)( )
φ
=
m∑
i( )φ[
l
( )
φ
−
l
( )
φ
]
where k is the maximum number of test lines hitting the object transect and l denotes the distances out from the vertical axis to the intersection points between the test lines and the boundary of the object transect. Using these estimates the object volume is estimated by
[
fˆ
1fˆ
2]
V
~
=
π
⋅
+
, (3)where
f
ˆ
1=
f
ˆ
( )
φ
0,
f
ˆ
2=
f
ˆ
(
φ
0+
π
)
,
φ
0~
UR
[
0
,
π
)
.This is illustrated in Fig. 1c.
Using the theory developed by Cruz-Orive and Gual-Arnau (2002) the variance of this estimate can be predicted using
( )
(
)
20 ˆ1 ˆ2 ˆ ˆ
var ·
2
2
− − +
3
%
V =π f f v π v, (4)
where the first term in the right hand side estimates the variance due to the rotating test plane and the second term the variance due to the test lines. The test line contribution can be estimated using the following
( )
[
]
2 1 0 2
4
3
12
2
Z
Z
Z
h
v
ˆ
=
⋅
−
+
, (5)1
=
=
∑
k - jj i i+ j i
Z z z , where
z
i=
a
i( ) (
φ
0+
a
iφ
0+
π
)
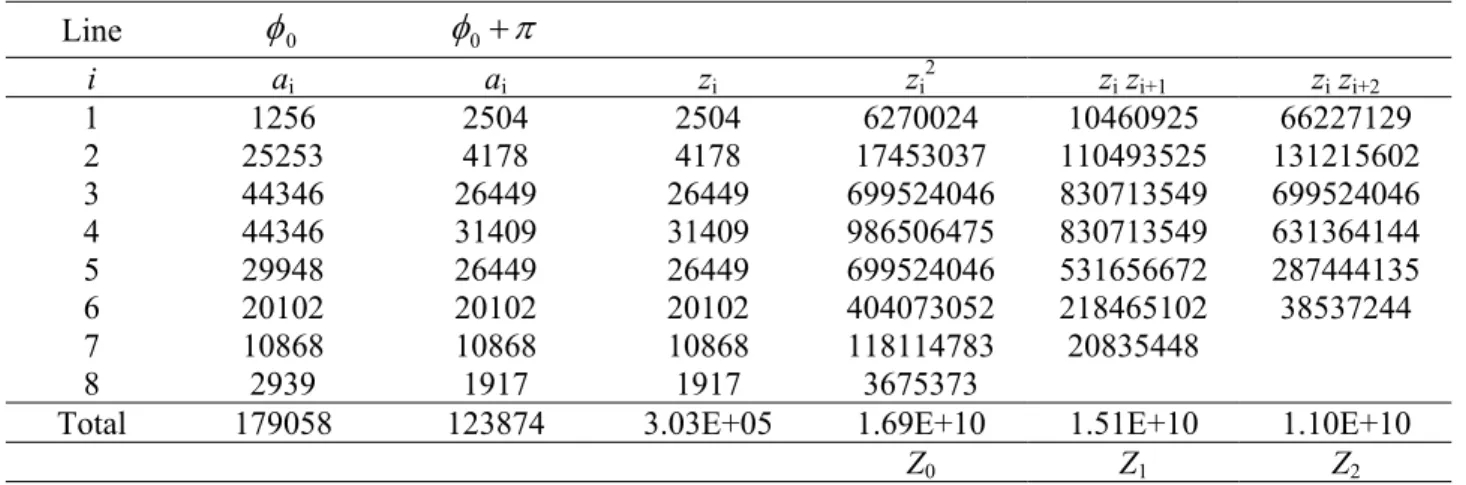
.As a simple example we can use the line intercept data generated from Fig. 1c to estimate the eye volume to be 1.67 × 107 µm3. From the 8 intercepts that hit the eye we predict the overall CE to be
11.0%, with rotating plane and line contributions of 10.3 and 3.6% respectively (see Table 1 for data and intermediate calculations). This means that the error variance due to the test plane represents about 90% of the total error variance, whereas the intercept estimation contributes remaining 10%.
MATERIALS AND METHODS
Dover sole, Solea Solea, larvae were hatched from naturally-spawned eggs from a captive broodstock maintained under the conditions described in Reed et al. (2001). The eggs were incubated at 12 ± 1 ºC and three days after hatching the yolk-sac larvae were transferred to 60 cm diameter matt-black seawater tanks of 60 litre capacity under controlled conditions of light and temperature. After 4-5 days of feeding on newly-hatched Artemia of San Francisco, USA origin they were transferred to Artemia of Great Salt Lake, USA origin previously enriched with emulsions designed to give isolipidic diets differing in their HUFA content. When the fish had reached a mean standard length of about 3 cm they were weaned on to an agglomerated feed and later transferred to a laboratory-prepared moist formulated feed. Upon sampling the fish were anaesthetised in MS222 prior to fixing in Karnovskys fixative. The fish were dissected anterior to the eyes and at the base of the gill region, tissue was embedded in Technovit after dehydration. Serial sections (25 µm) were cut using a Jung Supercut 2065 microtome, floated over water onto glass slides and stained with Toluidine Blue (1%) for 2 min.
Table 1. Raw data used to estimate the volume of the Dover sole eye shown in Fig. 1c. The distance between lines was 35.5 µm at the level of the tissue.
Line
φ
0φ
0+
π
i ai ai zi zi2 zi zi+1 zi zi+2
1 1256 2504 2504 6270024 10460925 66227129
2 25253 4178 4178 17453037 110493525 131215602
3 44346 26449 26449 699524046 830713549 699524046
4 44346 31409 31409 986506475 830713549 631364144
5 29948 26449 26449 699524046 531656672 287444135
6 20102 20102 20102 404073052 218465102 38537244
7 10868 10868 10868 118114783 20835448
8 2939 1917 1917 3675373
Total 179058 123874 3.03E+05 1.69E+10 1.51E+10 1.10E+10
Fig. 1. (a) An image of a juvenile Dover sole eye. The ‘eye’ for the purposes of this note is the union of the lens, retina and vitreous humour. The axis of revolution is taken as the axis through the frontmost portion of the lens and the optic axis at the rear of the eye. (b) A simplified co-axial section obtained from a set of serial sections through an excised juvenile Dover sole eye. The eye is at the same magnification as Fig. 1a. The area and distance to the centroid of the righthand portion of the transect are shown. (c) The test line method for estimating the volume of the eye. The test system has a between line spacing of 35.5 µm at the level of the tissue. The lines that hit the eye intersection are number i = 1 to 8. The line numbering notation used in Eq. 2 is illustrated for the left hand side of line 2. (d) A plot of squared line length, ai(φ) – circles and ai(φ+π) - squares,
versus line number for two sides of one of the Dover sole eyes analysed in this paper (case 11 Table 1).
The eyes of sampled fish were sectioned exhaustively at 25 µm intervals, resulting in 8-14 serial sections per eye. The central section for each of the eyes was then used to estimate volume using the vertical rotator method. Each section was projected onto a photocopied test grid using a projection microscope (Howard et al., 1999) at a linear magnification M of 202 times. The grid spacing h, on the sheet was 15mm. Each intersection between the test grid and the edge of the eye transect was marked directly onto the paper sheet so that the sheet acted as a raw data record for each eye. The distances were then measured on the sheet in millimetres and converted to microns at the level of the tissue.
RESULTS AND DISCUSSION
two eye ‘halves’. For this eye the test line CE is 1.2% and the rotating test plane CE 11.7%.
In Reed et al. (2001) we used Eq. 5 on an exhaustive set of line intercept measurements to predict that a test line coefficient of error contribution of 5,3 and 1% could be achieved using 6, 8 and 14 lines respectively. In that paper we did not publish any estimates of the rotating plane term in the sampling variance. However, during the preparation of Reed et al. (2001) we had attempted to estimate the error due to the rotating plane using Eq. 16 from Cruz-Orive (1990). This formula had originally been derived for predicting the variance of fractionator estimates made using an initial splitting design. The key aspect of the approach of Cruz-Orive (1990) is that the variance of a single quantity is estimated from two observable and negatively correlated quantities. The analysis presented by Cruz-Orive and Gual-Arnau (2002) shows that Eq. 16 from Cruz-Orive (1990) is identical to their Eqs. 7, 8, which in the present notation is,
( )
(
)
22 1 2
0
V
=
3
f
−
f
π
ˆ
var
. (6)Given the small contribution to CE we get from using test lines the naïve estimate would in the present context have given almost identical estimates of CE as the full result. For example, for case 11 Eq. 4 gives a prediction of CE of 11.79% and Eq. 6 a prediction of 11.76%.
The observed coefficient of error eye volumes,
( )
VCV2 ˆ , is composed of the inherent biological
variation between eye volumes within the fish
population, CV2
( )
V , plus a component that is due tothe sampling error in the vertical rotator method
( )
ViCE2 ˆ . These quantities are related as follows
( )
V CV( )
V[
CE( )
Vi]
CV2 ˆ = 2 +mean 2 ˆ .
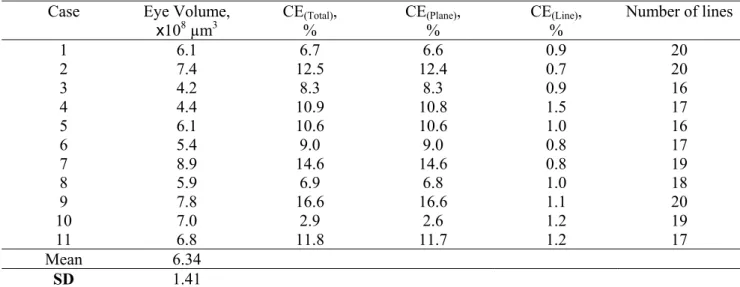
Using the values obtained from Table 2
( )
22 0.107
0472 .
0 =CV V + , which on re-arranging
gives CV2
( )
V =0.0472−0.0114=0.0358.The biological CV between the eye volumes is therefore 0.189 (19%). Thus the overwhelming factor in the observed variability is the biological variation between animals and estimates that have on average about 11% coefficient of error are precise enough for this study.
ACKNOWLEDGEMENT
We would like to thank Prof Luis Cruz-Orive for sending us a preprint copy of his internal report 1/2001 on which this note is based.
REFERENCES
Cruz-Orive LM (1990). On the empirical variance of a fractionator estimate J Microsc 160:89-95.
Cruz-Orive LM, Roberts N (1993). Unbiased volume estimation with co-axial sections: an application to the human bladder. J Microsc 170:25-33.
Cruz-Orive LM, Gual-Arnau X (2002). Precision of stereological estimators from systematic orientations. J Microsc 207:225-42.
Edwards CH, Penney DE (1982). Calculus and analytical geometry. Prentice Hall.
Table 2. Summary of Volume estimates for 11 Dover sole eyes with overall Coefficient of error predictions and the separate contributions due to rotating test plane and line test system.
Case Eye Volume,
x108 µm3 CE(Total)% , CE(Plane)% , CE%(Line), Number of lines
1 6.1 6.7 6.6 0.9 20
2 7.4 12.5 12.4 0.7 20
3 4.2 8.3 8.3 0.9 16
4 4.4 10.9 10.8 1.5 17
5 6.1 10.6 10.6 1.0 16
6 5.4 9.0 9.0 0.8 17
7 8.9 14.6 14.6 0.8 19
8 5.9 6.9 6.8 1.0 18
9 7.8 16.6 16.6 1.1 20
10 7.0 2.9 2.6 1.2 19
11 6.8 11.8 11.7 1.2 17
Mean 6.34
Howard CV, Beech DJ, Reed MG, Moss MC (1999). A double microscope for the efficient application of the physical disector - the tandem projection microscope. J Cell Pathol 4:79-85.
Mironov AA, Mironov AA (1998) Estimation of subcellular organelle volume from ultrathin sections through centrioles with a discretized version of the vertical rotator. J Microsc 192:29-36.
Reed MG, Shanks E, Beech DJ, Barlow L, Howard CV (2001). Stereological estimation of eye volume using the Pappus method. J Microsc 202:473-9.
Tandrup T, Gundersen HJG, Vedel-Jensen EB (1997). The optical rotator. J Microsc 186:108-20.