427
ENHANCEMENT OF LIFETIME USING DUTY
CYCLE AND NETWORK CODING IN WIRELESS
SENSOR NETWORKS
Dr.C.Kumar Charliepaul 1 G.Immanual Gnanadurai 2 Principal Assistant professor / CSE
A.S.L Pauls College of Engg & Tech, Coimbatore . Dhaya College of Engineering, Madurai [email protected] [email protected]
Introduction: -
A fundamental challenge in the design of Wireless Sensor Network (WSN) is to enhance the network lifetime. The area around the Sink forms a bottleneck zone due to heavy traffic-flow, which limits the network lifetime in WSN. This work attempts to improve the energy efficiency of the bottleneck zone which leads to overall improvement of the network lifetime by considering a duty cycled WSN. An efficient communication paradigm has been adopted in the bottleneck zone by combining duty cycle and network coding. Studies carried out to estimate the upper bounds of the network lifetime by considering
Duty Cycle
Network Coding and
Duty Cycle and Network Coding.
The sensor nodes in the bottleneck zone are divided into two groups
Simple Relay Sensors
Network Coder Sensors
The relay nodes simply forward the received data, whereas, the network coder nodes transmit using the proposed network coding based algorithm. Energy efficiency of the bottleneck zone increases because more volume of data will be transmitted to the Sink with the same number of transmissions. This in-turn improves the overall lifetime of the network.
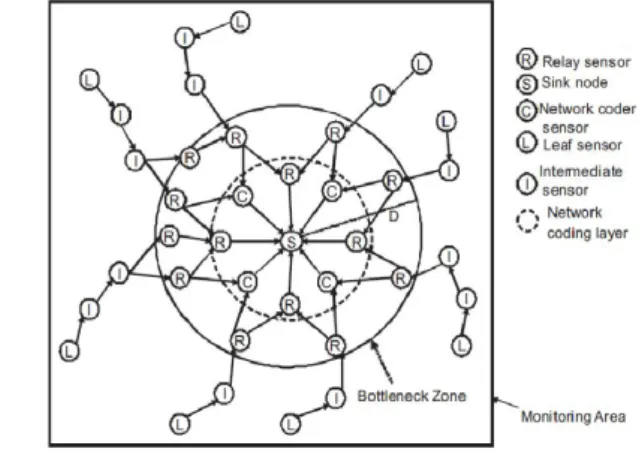
In a typical WSN, the network traffic converges at the Sink node S. There is a significant amount of data flow near the Sink ref. Figure. The area near the Sink is known as the bottleneck zone. Heavy traffic load imposes on the sensor nodes near the Sink
node. The nodes in the bottleneck zone deplete their energy very quickly, referred as energy hole problem in WSN. Failure of such nodes inside the bottleneck zone leads to wastage of network energy and reduction of network
reliability. The bottleneck zone needs special attention for reduction of traffic which improves the network lifetime of the whole WSN.
The all-node-active condition is not practical for energy constraint WSN. The sensor nodes save energy by switching between active and dormant (i.e. sleep) states. The ratio between the time during which a sensor node is in active state and the total time of active/dormant states is called duty cycle.
Fig 1: Traffic flow, bottleneck zone and roles of sensors in a typical WSN.
428
dense WSN the duty cycle of a node is very low.
A duty cycled WSN can be loosely categorized into two main types
Random Duty-cycled WSN
Co-ordinate Duty cycled WSN
In the former, the sensor nodes are turned on and off independently in random fashion. In the later, the sensor nodes co-ordinate among themselves via communication and control message exchanges. They are potentially efficient for communication. However, it requires additional information exchange to disseminate the active/sleep schedule of each node. The random duty-cycled WSNs are simple to design as no additional overhead is required. In this work, the primarily goal is to gain certain analytical understanding on the
upper-bound of the network lifetime.
Therefore, the random duty cycle based WSN has been considered for its simplicity in design. Specifically, the problem of reduction of traffic in the bottleneck zone has been considered.
The network coding technique
improves the capacity of an information network with better utilization of bandwidth. In a multi-hop communication with network coding, the intermediate nodes of a network can appropriately encode the incoming data packets before forwarding the coded packets to the next node. The network coding technique also improves reliability of the network.
NETWORK CODING
Network coding is a technique which allows the intermediate nodes to encode data packets received from its neighboring nodes in a network. The encoding and decoding methods of linear network coding are described below.
Encoding operation
A node, that wants to transmit encoded packets, chooses a sequence of coefficients
q = (q1, q2……qn), called encoding vector,
from GF (2s). A set of n packets Gi (i = 1, 2,
3... n) that are received at a node are linearly
encoded into a single output packet. The output encoded packet is given by
The coded packets are transmitted with the n coefficients in the network. The encoding vector is used at the receiver to decode the encoded data packets.
Decoding operation
A receiver node solves a set of linear equations to retrieve the original packets from the received coded packets. The encoding vector q is received by the receiver sensor nodes with the encoded data. Let, a set (q1, Y1)... (qm, Ym) has been received by a node. The symbols Yj and qj denote the information symbol and the coding vector for the jth received packet respectively. A node solves the following set of linear equations with m equations and n unknowns for decoding operation.
At least n linearly independent coded packets must be received by the recipients for proper decode of the original packets. The only unknown, Gi, contains the original packets
that are transmitted in the network. The n number of original packets can be retrieved by solving the linear system in equation after getting n linearly independent packets. The XOR network coding, a special case of linear network coding has been used in this work. The coded packets that are transmitted in the network are elements in GF (2) = {0, 1} and bitwise XOR in GF (2) is used as an operation.
429
considering a duty cycled WSN. An efficient communication paradigm has been adopted in the bottleneck zone by combining Adaptive Duty Cycle and Linear Network Coding. The nodes in the bottleneck zone deplete their energy very quickly, referred as energy hole problem in WSN. Failure of such nodes inside the bottleneck zone leads to wastage of network energy and reduction of network reliability. The bottleneck zone needs special attention for reduction of traffic which improves the network lifetime of the whole WSN.Wireless sensor Network Consist of distributed autonomous sensor node that can be deployed to monitor the inaccessible and
accessible areas such as Forest fire
deduction,Deserts, Air pollution monitoring,
Land slide deduction, Water Quality
monitoring.Each sensor network node
generally equipped with a Radio Transceiver with an internal or external antenna ,Memory Unit, Micro controller, and each node having own battery with limited energy to reducing the power consumption of each node is a difficult task.
Wireless sensor Network the node transmitting the data to the central gathering point (i.e. called as sink). There is a large amount of data flow near the sink so the nearer node’s taking more power than the other node shown in Figure . The area nearer the central gathering point is called as bottleneck zone shown in Figure .The sensor nodes in the bottleneck zone deplete their energy very quickly. It is called as energy hole problem in WSN. Failure of sensor node in bottleneck region leads to wastage of network energy, bandwidth, and reduction network reliability. The bottleneck zone needs special cognizance for decrement of traffic which improves the network lifetime of the WSN.
In WSNs the entire node in active condition is not practical for energy constraint. The senor nodes are saving the energy by active and sleep states. The total time of sensor nodes are active and dormant state is called Duty cycle. The duty cycle depends on the network coverage and
connectivity. Usually for a crowded WSN the sleep time of a node is very low.
Fig2 :Roles of Sensor in typical WSN.
Fig3 :Bottleneck Zone in typical WSN.
MODULES
Modules of the proposed system is
Adaptive Duty Cycle
Linear Network Coding
ADAPTIVE DUTY CYCLE
430
Fig 4 : Adaptive Duty Cycle in a typical WSN
The network condition or traffic variations changes implicitly occurs because the queue states having possibility or power of the network states Using the queue length and its variations of a sensor node, we present a design of distributed duty cycle controller. Therefore the adaptive duty-cycled based WSN has been considered for its design. Specifically the problem of reduction of
traffic in bottleneck zone has been
considered.
LINEAR NETWORK CODING
Network coding is a technique which allows the intermediate node to encode the packet before forwarding to the neighbor node. The encoding and decoding methods described below.
Encoding Operation
A node wants to transmit the encoded packets, choose a sequence of bits b1, b2 from
Nodes Ni (i =1, 2, 3 …n). The output of
encoding packet is given by
Y= Ni (b1⊕b2)
Where i = 1, 2 ….n
The encoded packets are transmitted with k coefficient in the network.
Decoding Operation
A node receives encoded packets, and it will get bits either b1 or b2based on the bit.
It will perform decoding operation b2= Y ⊕ b1
b1= Y ⊕ b2
The b1 and b2 using {0, 1} information’s A node receives encoded packets, and it will get bits either b1 or b2 based on that it
will perform decoding operation.
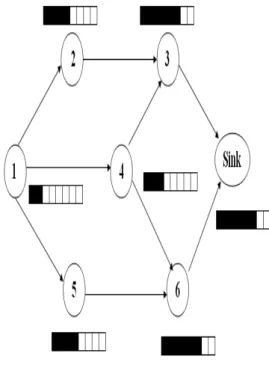
A source node A send the information to the destination F and G , the node A will be generating information b1={0101101} and
b2={1011011} and it should be multi casted
shown in Figure .
Fig 5 : Encoding and Decoding operation of sensor node
The node D receives the information of b1, b2 and it will perform XOR operation.
The result will be {1110110}. The
Destination F receiving the b1 bit and also get
XOR result. It will again perform XOR operation b1⊕ (b1⊕b2) for getting b2 bit.
HARDWARE
One major challenge in a WSN is to produce low cost and tiny sensor nodes. There are an increasing number of small companies
producing WSN hardware and the
commercial situation can be compared to home computing in the 1970s. Many of the nodes are still in the research and
development stage, particularly their
431
adoption is the use of very low power methods for data acquisition.
In many applications, a WSN
communicates with over a LAN and
WAN through a gateway. The Gateway acts as a bridge between the WSN and the other network. This enables data to be stored and processed by device with more resources, for example in a remotely located Server Computing.
SOFTWARE Energy is the scarcest resource of WSN nodes, and it determines the lifetime of WSNs. WSNs are meant to be deployed in large numbers in various environments, including remote and hostile regions, where ad hoc communications are a key component. For this reason, algorithms and protocols need to address the following issues
Lifetime maximization
Robustness and fault tolerance
Self-configuration
Lifetime maximization: Energy/Power
Consumption of the sensing device should be minimized and sensor nodes should be energy efficient since their limited energy resource determines their lifetime. To conserve power the node should shut off the radio power supply when not in use.
OPERATING SYSTEMS
Operating systems for wireless sensor network nodes are typically less complex than general-purpose operating systems. They more strongly resemble embedded systems, for two reasons. First, WSNs are typically deployed with a particular application in mind, rather than as a general platform. Second, a need for low costs and low power leads most wireless sensor nodes to have
low-power microcontrollers ensuring that
mechanisms such as virtual memory are either unnecessary or too expensive to implement.
It is therefore possible to use
embedded operating systems such
as eCos or uC/OS for sensor networks.
However, such operating systems are often designed with real-time properties.
TinyOS is perhaps the first operating system specifically designed for WSNs.
TinyOS is based on an event-driven
programming model instead
of multithreading. TinyOS programs are composed of event handlers and tasks with
run-to-completion semantics. When an
external event occurs, such as an incoming data packet or a sensor reading, TinyOS signals the appropriate event handler to handle the event. Event handlers can post tasks that are scheduled by the TinyOS kernel some time later.
SIMULATION OF WSNs
At present, agent-based modeling and simulation is the only paradigm which allows the simulation of complex behavior in the environments of wireless sensors (such as flocking). Agent-based simulation of wireless sensor and ad hoc networks is a relatively new paradigm. Agent-based modelling was originally based on social simulation.
Network simulators
like OPNET, NetSim, NS2 and OMNeT can be used to simulate a wireless sensor network.
NS2 Introduction
Network Simulator (Version 2),
widely known as NS2, is simply an event driven simulation tool that has proved useful
in studying the dynamic nature of
communication networks. Simulation of wired as well as wireless network functions and protocols (e.g., routing algorithms, TCP, UDP) can be done using NS2. In general, NS2 provides users with a way of specifying such network protocols and simulating their corresponding behaviours.
Basic Architecture
432
as an input argument of an NS2 executable command ns. In most cases, a simulation trace file is created, and is used to plot graph and/or to create animation shown in Figure .
NS2 consists of two key languages: C++ and Object-oriented Tool Command Language (OTcl). While the C++ defines the internal mechanism (i.e., a backend) of the simulation objects, the OTcl sets up simulation by assembling and conFigureuring the objects as well as scheduling discrete events (i.e., a frontend).
The C++ and the OTcl are linked together using TclCL. Mapped to a C++ object, variables in the OTcl domains are
sometimes referred to as handles.
Conceptually, a handle (e.g., n as a Node handle) is just a string (e.g., _o10) in the OTcl
domain, and does not contain any
functionality. Instead, the functionality (e.g., receiving a packet) is defined in the mapped C++ object (e.g., of class Connector).
In the OTcl domain, a handle acts as a frontend which interacts with users and other OTcl objects. It may defines its own procedures and variables to facilitate the interaction. Note that the member procedures and variables in the OTcl domain are called instance procedures (instprocs) and instance variables (instvars), respectively.
After simulation, NS2 outputs either text-based or animation-based simulation results. To interpret these results graphically and interactively, tools such as NAM (Network AniMator) and XGraph are used.
Basic architecture of NS2.
Routing and Network Dynamics Unicast Routing
There are several routing possibilities over the internet. The simplest one is the static routing in which the shortest route (in
terms the number of hops) is chosen throughout the connection. ns can simulate noisy links or even links that become disconnected.
To simulate the disconnection of link between nodes $n1 and $n4 from time 1 to 4.5
$ns rtmodel-at 1.0 down $n1 $n4 $ns rtmodel-at 4.5 up $n1 $n4
Routing
Example
THROUGHPUT
The system throughput or aggregate throughput is the sum of the data rates that are delivered to all terminals in a network. Throughput is essentially synonymous to digital bandwidth consumption. It can be analyzed mathematically by means of queuing theory, where the load in packets per time unit is denoted arrival rate λ, and the throughput in packets per time unit is denoted
departure rate μ.
We compared both Random Duty Cycle and Adaptive Duty Cycle. We got higher throughput in Adaptive Duty Cycle. JITTER
433
frequency of successive pulses, the signal amplitude, or phase of periodic signals. Jitter is a significant, and usually undesired, factor in the design of almost all communications links (e.g., USB, PCI-e, SATA, OC-48). In clock recovery applications it is called timing jitter. Jitter can be quantified in the same terms as all time-varying signals, e.g., RMS, or peak-to-peak displacement. Also like other time-varying signals, jitter can be expressed
in terms of spectral
densityque
nc y content).
Jitter for ADC vs. RDC
Jitter period is the interval between two times of maximum effect (or minimum effect) of a signal characteristic that varies regularly with time. Jitter frequency, the more commonly quoted Figure, is its inverse. ITU-T G.810 classifies jitter frequencies below 10 Hz as wander and frequencies at or above 10 Hz as jitter.
Jitter may be caused by
electromagnetic interference (EMI) and crosstalk with carriers of other signals. Jitter can cause a display monitor to flicker, affect the performance of processors in personal computers, introduce clicks or other undesired effects in audio signals, and loss of transmitted data between network devices. The amount of tolerable jitter depends on the affected application.
PACKET LOSS
Packet loss occurs when one or more packets of data travelling across a computer network fail to reach their destination. Packet loss is distinguished as one of the three main
error types encountered in digital
communications; the other two being bit error and spurious packets caused due to noise.
The following Figure shows that Comparisons of Number of packets dropped between Random Duty Cycle and Adaptive Duty Cycle
Number of Packets Dropped for ADC vs. RDC
DELAY
Network delay is an important design and performance characteristic of a computer network or telecommunications network. The delay of a network specifies how long it takes for a bit of data to travel across the network from one node or endpoint to another. It is typically measured in multiples or fractions of seconds. Delay may differ slightly, depending on the location of the specific pair of communicating nodes. Although users only care about the total delay of a network,
engineers need to perform precise
measurements. Thus, engineers usually report both the maximum and average delay, and they divide the delay into several parts
Processing delay - time routers take to process the packet header
Queuing delay - time the packet
spends in routing queues
Transmission delay - time it takes to push the packet's bits onto the link
Propagation delay - time for a signal to reach its destination
434
can range from just a few milliseconds to several hundred milliseconds.
Delay for ADC vs. RDC
CONTROL OVERHEAD
Control overhead is any combination of excess or indirect computation time, memory, bandwidth, or other resources that are required to attain a particular goal. It is a special case of engineering overhead.
Control Overhead for ADC vs. RDC
NORMALIZE DROUTING OVERHEAD
Normalized Routing Overhead is define as during the data transmission, some of the sensor nodes was going to sleep sate, so we need to find the shortest path for data transmission, It required to maintain a routing table for each time. It leads to routing overhead.
The following Figure shows that
Comparisons of Normalized Routing
Overhead between Random Duty Cycle and Adaptive Duty Cycle
Normalized Routing Overhead for ADC vs. RDC
TOTAL ENERGY CONSUMPTION Consumption of electric energy is measured by W·h (Watt x Hour).
1 W·h = 3600 joule = 859.8 calorie
energy in one year. Electric/Electronics devices consume electric energy to generate desired output(i.e. light, heat, kinetic etc.), while its operation some part of energy are consumed in unintended output. see Electrical efficiency.
AVERAGE ENERGY
Average Energy Consumption defines as average amount of energy taken by the sensor node at the end of the data transmission for the entire network.
Total Energy Consumption for ADC vs. RDC
The following Figure shows that
Comparisons of Average Energy
435
Average Energy Consumption for ADC vs. RDC
OVERALL RESIDUAL ENERGY
Overall Residual Energy defines as amount of remaining energy present at the end of data transmission for the entire sensor network.
AVERAGE RESIDUAL ENERGY
Average Residual Energy defines as amount of remaining energy present at the end of data transmission for the entire sensor network.
The following Figure shows that Comparisons of Average Residual Energy between Random Duty Cycle and Adaptive Duty Cycle
Overall Residual Energy for ADC vs. RDC
Average Residual Energy for ADC vs. RDC
FUTURE ENHANCEMENT
In this letter, the bottleneck zone in
an energy-constrained wireless sensor
network is identified. Further, the influence of the bottleneck zone on the entire network’s performance is analyzed by deducing the performance upper bounds limited by the
available energy resources inside the
bottleneck zone. Finally, the ways by which network deployment variables (e.g. the number of nodes) may affect the performance bounds are discussed. The acquired results give insights for the proper deployment of wireless sensor networks. Further, the performance upper bounds given in this letter can be used as benchmarks in the performance evaluation of protocols or algorithms developed for energy-constrained wireless sensor networks.
Our future work includes the following: 1)
jointly optimizing multiple network
parameters with cluster based methods for the proposed cooperative scheme and 2) jointly designing Linear Network Coding algorithms with the proposed Adaptive Duty Cycle scheme for multiple sources to multiple sinks in Wireless Sensor Networks.
Authors Biography: -
Kumar Charlie Paul, Principal of A.S.L Pauls College of Engineering & Technology. Had did many National and International Conferences and published many papers in journals. He also guided many students for their Ph.D project works. Having more than 23 years of experience in teaching field.