129 | P a g e
Synthesis and Characterizations of Dy
3+
doped
Y
2
O
3
:SiO
2
nanopowder
Rajni Vats
1, Rachna Ahlawat
21
Department of Physics, Chaudhary Devi Lal University,Sirsa-125055, Haryana, India
2
Department of Physics, Chaudhary Devi Lal University,Sirsa-125055, Haryana, India
ABSTRACT
The sol-gel process combines the advantage of lower temperature and possibility of making of finely dispersed
powders and coating with ease and low cost. In the present studies Y2O3:SiO2 nanopowder doped with
dysprosium ion was synthesized via sol-gel route. Then dried sample was annealed in a muffle furnace at 750◦C.
Structural and optical behavior of the annealed sample was investigated by different complementary
characterization techniques such as X-Ray diffraction (XRD), Fourier Transform Infrared Spectroscopy (FTIR),
UV-Vis spectroscopy, which are discussed at length. Particle size has been calculated by the well-known
Debye-Scherrer formula. Band gap energy has also been calculated by Tauc’s plot.There is increasing recognition that
sol-gel synthesis offers growth control capabilities that can be conveniently exploited in preparing these
desirable nanophosphor materials.
I.INTRODUCTION
In recent years, rare earth nanophosphors activated by lanthanides are being witnessed with enhanced luminescence properties and hence find potential applications in field emission displays (FEDs), flat panel displays (FPDs), plasma display panels (PDPs), electro luminescent displays, colour tunable devices etc. due to their high performance, environment friendliness and energy saving capabilities.Nanophosphers activated with Lanthanide ions (Ln3+) have attracted great attention because of their wide range of colour emission and better luminescent properties.Yttrium oxide (Y2O3) is one of the best hosts for rare earth ions because of the
similarities in the chemical properties and the ionic radii of rare earths. Moreover, Y2O3 possesses a higher
melting point(2400 ◦C), higher thermal conductivity, wide transparency range (0.2 – 8 μm) with a band gap of
5.6 eV, high refractive index (∼1.8) and low cut-off phonon energy (380 cm−1).In the present work, we have used sol-gel technique to synthesize and investigated the structural properties of Dy3+doped Y2O3:SiO2nanopowder. Dysprosium with its emission in greenish-yellow region has been chosen for its unique
spectral properties and SiO2act as a stabilizing agent which protects the nanoparticles from aggregation [1, 4].
II.SYNTHESIS AND CHARACTERIZATION
Dy3+doped Y2O3:SiO2 sample was synthesized by sol-gel route [5, 6],which takes advantage of both bottom up
130 | P a g e
HNO3 (prepared separately) were added separately in one lot and stirred for about 2:30hrs. The prepared sol was
converted into a dense gel after ageing for 3 weeks. The gel was then grinded into fine powder after drying in an oven at 120◦C for 48hrs. The prepared nanopowder was further annealed as according to the scheme given below:
T◦room 2◦C/min 250◦C (5 h) 2◦C/min 500◦C (5 h) 2◦C/min 750◦C (5 h)
The structure of the prepared powders was investigated via X-ray diffraction (XRD) using a BrukerD8 Discover diffractometer with Cu Kα radiation (λ=0.154nm) within a 2θ scan range of 20◦ – 70◦.FTIR spectrum of the nanocomposite was taken at room temperature using Perkin Elmer 400 spectrophotometer in the range 400-4000 cm-1. The optical absorption spectra have been observedby using Lambda 750 (Perkin Elmer) UV-Vis spectrophotometer in 200-800 nm range.
III.RESULTS AND DISCUSSION:
3.1X-Ray Analysis:
The X-ray diffraction pattern taken within the 2θ scan range of 20◦ – 70◦for the synthesized sample is shown in Fig.1.The result shows that the prepared sample is having a crystalline phase in which diffraction peaks can be assigned to monoclinic phase of Y2O3 when compared to JCPDS Files No. 44-0399 [7]. The average nano
crystalline size has been calculated by well-known Debye Scherrer formula: D = Kλ/ βcos θ, where K=0.94, β is full width half maximum, λ=0.154 nm. The detail studies of all peaks are given in Table-1.
10 20 30 40 50 60 70 80 90
20 4 0 6 0 80
In
te
n
si
ty
(
a.
u
.)
2 T h e ta (in d e g re e )
In
tensity
(a
. u
.)
2 Theta (in degrees)
Figure1: XRD for Dy3+ doped Y2O3:SiO2
Table 1: Details of XRD data.
131 | P a g e
21.74 20 0.23 4.08557 44.42 28.94 27 1.94 3.08298 58.80
31.64 46 0.34 2.82525 100.00 32.12 26 0.42 2.78423 57.38
46.48 17 0.31 1.95219 36.10
49.35 10 1.2 1.84510 22.15
3.2 FTIR analysis:
FTIR analysis gives information about functional groups present in the sample at room temp. FTIR spectrum of the sample is shown in Fig.2. The absorption bandat 3363 cm-1 and 1595 cm-1corresponds to -OH, -NHgroups. Smallabsorptions at1469 cm-1, 1392 cm-1 and 1300 cm-1correspond to organic impurities.The FTIR peaks of SiO2 molecule is obtained at 1085, 798 and 464 cm-1 and corresponding to asymmetric, symmetric and bending
vibrations, respectively. The band at 945 cm-1 can be attributed to Si-OH bond. The bands at 700cm-1 and 553 cm-1can be attributed to Y-O bond [8, 11].
Figure 2: FTIR results for Dy3+ doped Y2O3:SiO2nanopowder.
3.3
Uv-Vis Spectroscopy:
132 | P a g e
200 300 400 500 600 700
0.4 0.6 0.8 1.0 1.2 1.4 1.6
In
te
ns
it
y
(a
.u
.)
Wavelength (nm)
SiO2-Y2O3:Dy3+
Figure 3: Absorption spectrum of Dy3+ doped Y2O3:SiO2nanopowder.
The absorption spectrum shows a broad peak at 280 nm due to the host matrix of Y2O3 lattice corresponding to
charge transfer band O2-→Y3+[8]. The presence of electron and the p state of oxygen lying in close proximity with Y3+ site may result such bands. Other small absorption peaks at 377, 451 nm and 574 nm could be attributed to the transition lines 6H15/2 → 4M19/2, 6H15/2→ 4I15/2,6H15/2 → 4F9/2respectively [11, 12] of Dy3+ ion
present within the host matrix of Y2O3:SiO2.
3.4
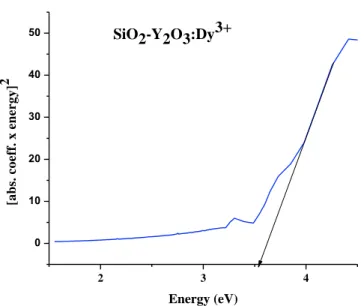
Tauc’s Plot
The relation between the incident photon energy (hν) and the absorption coefficient (α) is given by the following equation:
(αhν)1/n= A (hν-Eg)
HereA is a constant, α is absorption coefficient and Egis the band gap energy of the material and the exponent n
133 | P a g e
2 3 4
0 10 20 30 40 50
[a
b
s.
c
o
e
ff
.
x
e
n
e
r
g
y
]
2
Energy (eV)
SiO2-Y2O3:Dy3+
Figure 4:Tauc’s plot of Dy3+ doped Y2O3:SiO2nanopowder.
IV.CONCLUSIONS
The present study demonstrates the versatility of the sol gel method to yield highly dense nanopowder of the dysprosium doped in the composite of Y2O3-SiO2 binary oxide at a low annealing temperature (750oC) when
compared to the temperature (>1400–1600oC) required for the usual solid-state synthesis. The XRD analysis indicates that Dy3+ ion is perfectly integrated in to the crystal lattice of monoclinic yttrium oxide. The average sizes of the nanocrystallites were calculated from the diffraction line width based on the D–S formula, is found to be 25 nm for annealed sample. The band gap energy of the sample is found to be 3.54 eV on the basis of which, the prepared nanomaterial offers possibility for applications in security printing, boilable technology, lamps for illumination purposes etc.
REFERENCES
[1] G. K. Das and T. T. Y. Tan, Rare-earth-doped and codoped Y2O3 nanomaterials as potential bioimaging probes, J. Phys. Chem. C, 112, 2008, 11211, DOI:10.1021/jp802076n
[2] T. S. Atabaev, Y. H. Hwang, H. K. Kim, Color-tunable properties ofEu3+ and Dy3+codoped Y2O3 phosphor particles, Nanoscale Research Letters, 7,2012 556, https://doi.org/10.1186/1556-276X- 7-556 [3] M. Jayasimhadri, B. V. Ratnam, K. Jang and Ho Sueb Lee, Greenish-yellow emission from Dy3+ doped
Y2O3nano phosphors, J. Am. Ceram. Soc., 93 (2),2010 494–499 DOI: 10.1111/j.1551-2916.2009.03426.x
[4] A. Dupont, C. Parent,B. Le Garrec, and J.M. Heintza, Size and morphology control of Y2O3nanopowders via a sol–gel route, Journal of Solid State Chemistry, 171,2003 152–160, DOI: org/10.1016/S0022-4596(02)00202-5
[5] A. E. Danks, S. R. Hall, Z. Schnepp, The evolution of ‘sol–gel’ chemistry as a technique for materials
134 | P a g e
[6] E. Zelazowska, E. R. Pasek, M. B. Laczka, K. C. Kowalska, Sol-gel-derived hybrid materials multi-doped with rare-earth metal ions, Materials Science-Poland, 30(2),2012, 105-120, DOI: 10.2478/s13536-012-0014-3
[7] C. Hua, C. Li, J. Guo, X. Yan, J. Liu, L. Chen, J. Wei, L. Hei, Optical properties of cubic and monoclinic Y2O3 films prepared through radio frequency magnetron sputtering, Surface and Coatings
Technology,320(25),2017, 279-283, https://doi.org/10.1016/j.surfcoat.2017.01.004
[8] K. Mishra, S.K. Singh, A.K. Singh, S.B. Rai, Optical characteristics and charge transfer band excitation of Dy3+ doped Y2O3 phosphor, Materials Research Bulletin, 47, 2012, 1339–1344,
DOI:10.1016/j.materresbull.2012.03.017
[9] B.N. Lakshminarasappa, J.R. Jayaramaiah, B.M. Nagabhushana,Thermoluminescence of combustion synthesized yttrium oxide, Powder Technol., 217, 2012, 7, https://doi.org/10.1016/j.powtec.2011.09.042 [10] P.A. R. Pereira, D.A. Ceccato, A.G.B. Junior, M.F.S. Teixeira, S.A.M. Lima, A.M. Pires, Study on the
structural and electrocatalytic properties of Ba2+-and Eu3+-doped silica xerogels as sensory platforms.
RSC Adv., 6, 2016, 104529–104536, https ://doi.org/10.1039/C6RA22508J
[11] T. Verma, et al., Photoluminescent and Thermoluminescent Studies of Dy3+ and Eu3+ Doped Y2O3 Phosphors, J.Fluoresc., 28,2018, 453-464,http://doi.org/10.1007/s10895-018-2208-5.