Preparing To Use Resonant Acoustic Spectroscopy with Optical Vibrometry to
Characterize the Clot Elastic Modulus from Mice with Sickle Cell Disease
By
Kara J. SegerstromSeniors Honors Thesis
Department of Biomedical Engineering
University of North Carolina at Chapel Hill
March 31, 2017
Approved __________________
Amy L. Oldenburg, Thesis Advisor
Alisa S. Wolberg, Reader
Table of Contents
Abstract 3
Introduction 3
Theory 4
Overall Principal 4
Hardware 5
Signal Processing 5
Methods 6
Texture Analyzer 6
Microwell Calibration 7
Blood Clot Preparation 7
Results 8
Texture Analyzer 8
Reduction of Microwell Sizes 9
Calibration of CEMport to the Flat Bottom Wells 11
Preliminary Blood Data 12
Conclusion 13
Acknowledgements 14
1. Abstract:
CEMport is machine that uses resonant acoustic spectroscopy with optical vibrometry to find the clot elastic modulus. In order to prepare CEMport for future experiments on sickle cell disease, CEMport will be calibrated. The device was previously calibrated to a 150µL cube microwell, but the following study will calibrate CEMport to a 100 µL cylindrical microwell. Microwells with sample sizes 150µL, 125µL and 100µL were tested, and the results
demonstrated that all three sizes were able to produce quality fits. The sickle cell blood clots will be formed from mice, therefore the reduction of sample size will allow more samples to be created. The calibration coefficient a0 in the equation: 𝐸 =𝑎!𝜌𝑓!!, was found to be 0.063 ± 0.002
Pa/Hz2, whereas the previously found ratio was 0.076 ± 0.003 Pa/Hz2. Preliminary testing of blood clots for human and mouse whole bloodwas 1.94 ± 0.03kPa and 2.98 ± .33kPa respectively, falling within the expected range of elasticity.
2. Introduction:
Altered mechanical structures of blood clots have been related to cardiovascular disease such as coronary heart disease [1], heart attack [2], and diabetes [3]. The clot elastic modulus, CEM, is a parameter for defining clot physical characteristics [4]. CEM refers to the stiffness of a clot and reflects the combined structure of blood clot components such as platelets, fibrin, and erythrocytes [4]. Blood clots are required to be stiff to prevent the flow of blood when vessels are wounded [5], yet still elastic enough to be broken apart by mechanical forces [6]. When blood clot mechanical properties are abnormal, it can lead to an increased risk of bleeding or
thrombosis [5]. The elastic modulus of individual fibers of a blood clot may be measured using optical tweezers, but a method for testing whole blood clots is lacking. TEG is the current device used to test elasticity; however, its main purpose is recording the blood clotting time. The TEG 5000 has a sample size of 360µL, which is not ideal for testing animals with low blood volumes. CEMport is a machine that can precisely record the CEM using resonant acoustic spectroscopy with optical vibrometry (RASOV). A main advantage of CEMport is the low sample size of 150µL, which is further reduced as described in this paper.
In order to lower the sample size of CEMport, the first step is to use a texture analyzer to calibrate CEMport to the elastic modulus and represent the standard for Young’s modulus. The next step is to test different microwell sizes and shapes. The following sizes are tested: 150µL, 125µL and 100µL. Two different shapes are tested in aforementioned sizes. The original shape of the microwell was a cube, but it was found that there was sample residue in the corners and can be difficult to clean. The new shapes have fewer creases in order to prevent residue and described in more detail in the methods sections. The calibration is completed after using CEMport on the new microwells. Further calibration explanation can be found in the theory section. Finally, blood clots from humans and mice are tested on to ensure the validity of the calibration. The ultimate goal of CEMport is to be able to test blood clots from mice with sickle cell disease, which explains the importance of a low sample size. Mice samples from our partner produce around 500 to 600µL. Ideally if the sample size was reduced from 150µL to 100µL, 2 to 3 more samples could be produced per mouse for a total of 5 to 6 samples. The TEG 5000 in this case would only be able to produce 1 to 2 samples.
patients will develop chronic kidney disease and end-stage renal disease [8]. CEM has already been related to several other cardiovascular diseases and thus is an important tool for researchers, aiding them in understanding the effects of clot stiffness on cardiovascular health. Sickle cell disease has an altered mechanical state due to increased levels of fibrin, and thus can also be characterized and potentially identified by CEM [5]. By improving CEMport’s ability to
distinguish pathologies among clots, CEMport will benefit the medical and research community as a novel and precise method of the elastic assessment of blood. Sample size reduction will provide CEMport an obviously advantage with small animal research testing.
Previous research using CEMport include studies on how fibrinogen and heparin affect the CEM. CEMport has proven its ability to distinguish clots with varying levels of fibrin and provide insight into clot stiffness [7]. CEMport can detect changes in elasticity of clots between 0.5 and 6 mg/mL of added fibrinogen content [7]. In another study, it was found that CEMport is sensitive to heparin levels below 0.050 U/mL; meaning CEMport could potentially be used in surgical management [4].
3. Theory
a. Overall Principle
CEMport uses resonant acoustic spectroscopy with optical vibrometry, RASOV, as the principle method to find the CEM. Resonance refers to the main measurement taken by
CEMport. A magnetic field causes a microbead to vibrate on top of a clot sample, and the displacement caused by the resonance is recorded. More details of the data collection are
described below in the hardware section. Using resonance as a measurement is ideal, because the measurement allows for high signal to noise ratio and easy signal reproducibility [4]. The
resonance frequency is related to CEM using the following equation: 𝐸 =𝑎!𝜌𝑓!!, where E is the
elastic modulus, 𝜌 is sample mass density, 𝑓! is the fundamental resonance frequency and 𝑎! is an experimentally determined calibration coefficient [10]. The experimentally determined calibration coefficient is derived from the ratio of a1 and a2 from the following two equations: 𝐸 =𝑎!(𝑐−𝑐!)! and 𝑓
! =𝑎!(𝑐−𝑐!) where c is agarose concentration. Agarose is being used to
calibrate CEMport, thus why 𝜌 is required to adjust the equation for blood clots. The variables a1
found in the first equation are calculated from a plot of agarose concentration along the x-axis and elasticity along the y-axis. The elasticity of the agarose is found using a texture analyzer that compresses the sample. The stress and strain at varying values of strain from the compression test is then used to find the elasticity. The second equation has agarose concentration along the x-axis and resonance frequency along the y-x-axis in order to calculate the variable a2 and c0. The
value found for c0 is used in the fitting for the texture analyzer. The resonance frequency is found
b. Hardware
From the laptop that controls CEMport, the user-selected parameters are outputted to a waveform generator. The parameters include the highest frequency the chirped waveform
reaches, the voltage of the chirped waveform, and sampling rate of both the waveform generator and data acquisition card (DAQ). The
waveform generator creates a chirped waveform based off of the parameters and sends the signal to a power supply that amplifies it. The power supply is connected to a solenoid that produces a magnetic field. An arm holds a microwell above the solenoid, which contains the clot sample. A microbead is placed on top of the sample in the middle with a
displacement laser focused on it. The displacement laser is moved using an XYZ stage powered by motors that allow the user to center the laser on the microbead. The magnetic field pulls on the microbead causing a displacement in the Z-axis that can be tracked by the laser. The displacement sensor sends the information to the displacement sensor controller, which is able to convert the
displacement data into voltage increments that is sampled by the DAQ. A humidifier that keeps samples moist during testing surrounds the XYZ stage, the sample arm, the laser, and the solenoid.
c. Signal Processing
The overall goal of the signal procecessing is to find the elastic modulus. The first step of the signal processing is to convert the displacement information from the vibrating microbead into frequency data. The frequency data can be fitted in order to provide the resonance, which is then related to the CEM. The displacement data of the microwell is taken twice, once when the magnetic field is turned on and another when the field is off. Then the data is converted into the frequency domain using a Fourier transform. The
chirped waveform is also converted into the frequency domain and divided from both the B-on and B-off data defined above in order to isolate the impulse response. The B-off data is subsequently subtracted from the B-on data to remove any potential noise. The absolute value of output from the pervious step is now the amplitude data and can be view in figure 2. The phase data is computed from the amplitude data enabling the information to be as shown in figure 3.
Figure 2: Amplitude Fitting from CEMport
Figure 1: Flow Chart of CEMport’s Hardware [4]
Now the amplitude and phase data needs to be fitted in order to find the resonance information. As demonstrated in figures 2 and 3, there is an obvious peak and phase change in the respective images. The user begins the fitting process by inputting the maximum frequency of the data as well as a resonant frequency guess. First the code fits the amplitude data using the equation: 𝐴 𝑤 = !
(!!!!!!)!!!
!!!!
, where ω0,
γ and q are fitted to the data using least squares fitting. The variable ω0 represents the resonant frequency, γ is the spread
of the resonance and q is a combination of ω0, γ and the
amplitude of the peak.Next the code finds the slope of the phase change to enable a better fit when the phase change fitting is done. The equation for the phase fitting is performed next:
𝜙 𝜔 = tan−1 !!!
!!!!!!+𝛽𝜔. The βω corrects for a time lag in the system due to LabView being unable to begin the magnetic field and data acquisition at exactly the same time. Finally, the code allows the data and the fit to be seen simultaneously on a graph to ensure the fit is correct.
4. Methods
a. Texture Analyzer
The texture analyzer is used as the standard for elasticity and used in the calibration coefficient to relate the resonant frequency to the CEM. The agarose samples were prepared by first measuring out 50.0 mL of distilled water into a closable tube for each individual sample using a graduated cylinder. The weight of the agarose is recorded before being added to the distilled water, and again afterwards, to best determine the precise amount of powder added, and therefore the actual concentration of agarose solution. The tubes, now filled with distilled water and agarose power, are closed and placed in a hot water bath set to 90 ± 5 °C for 20 minutes. The sample solutions are periodically shaken gently to ensure even suspension of the now melted agarose. After sitting in the hot bath, the agarose is cooled in the refrigerator for five minutes and poured into a cylindrical mold, sized to fit on the texture analyzer, resting in a culture dish. The purpose of placing the agarose in the refrigerator is to lower the temperature to the point right before it becomes a solid so that when it is poured into the mold, the smallest amount of agarose leaks out from under the mold due to the sample becoming a solid rapidly. The cover of the dish is placed over the mold to seal in moisture. A weight is set on top of sample for 10 minutes, to
ensure that the mold is flush with the dish and that agarose solution will not leak outside of the mold. The agarose sample is placed in the refrigerator overnight to set.
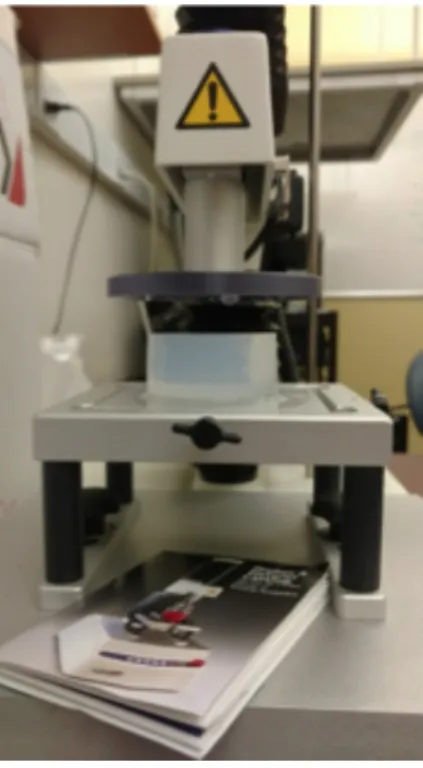
A texture analyzer (TA.XT Plus) compresses the agarose sample in order to find the parameters that allow stress and strain to be calculated. The agarose samples are removed and left out for 30 minutes or until they reach room temperature. The samples are carefully placed on
Figure 3: Phase Fitting from CEMport
Figure4: Texture analyzer with agarose sample 600 650 700 750 800 850 900
the testing platform of the texture analyzer. The texture analyzer compresses the samples and the following data is collected: distance of compression, time, the height of the sample and force. The samples were pre-compressed until consistent data was collected, as opposed to collecting the data as the sample were first experiencing the compression. Consistent data refers to the samples being compressed until the slope of the curve has stabilized. Engineering strain and stress information is calculated by hand in an excel spreadsheet. Stress is the force over the area. The force is gathered from the texture analyzer, and the area was calculated using a caliber on the mold. Stress is the change in distance over the height of the mold. Both parameters are found using the texture analyzer. The slope of strain and stress is used to find the elasticity of each sample.
b. Microwell Calibration
Microwell calibration experiments test three different sample sizes and two different shapes to determine which of the microwells can be used for calibration. Water is filtered before being pipetted into closable tubes. A 1000µL pipette transfers the filtered water in 1mL intervals to prepare 10 mL in the tubes. Agarose powder is weighed in a dish and then poured into its corresponding tube. The weigh dish is measured again afterwards to ensure an accurate measurement. The tubes are gently shaken and placed into a water bath of 90 ± 5 °C for 20 minutes. The tubes are rotated gently to mix before the agarose solution is pipetted into the microwells. The microwells sample sizes include 150µL, 125µL and 100µL. The two shapes include cylinder flat bottom and cylinder spherical bottom (refer to figure 5 and 6). The round shapes were selected due to concern that original cube shape had sample residue build up in the corners. The microwells were placed in the refrigerator overnight. The following day the microwells were left out for 30 minutes to reach room temperature within the humidified chamber. The microwells were then placed into CEMport with a 0.7mg and 500µm diameter steel microbead (grade 25, Salem ball company) placed on top in the middle of the sample. If a larger bead is used, the resonance will be dampened and inaccurate data will be produced. The user followed the parameters setting described in the Hardware section to locate the resonance frequency for each sample.
Figure 5:Cylinder Flat Bottom Microwell Figure 6: Cylinder Spherical Bottom Microwell
c. Blood Clot Preparation
Blood clots were tested in order to validate the calibration coefficient and perfect methods for future testing. Alisa Wolberg at the University of North Carolina at Chapel Hill provided the procedure for blood clot preparation as well as supplies. The animal blood protocols were approved by the IACUC, and human blood was obtained by protocols approved by the IRB. Innovin was diluted with HBS to create a 1:12,000 solution and the calcium was diluted with distilled water to 10mM. 5µL HBS, 5µL Ca2+, 5µL Innovin and 85µL blood was pipetted into
the blood is added. The blood is pipetted slowly up and down in the microwell to gently mix the solution. The wells are placed within the humidified chamber for 45 minutes to ensure the blood clots, and then they are tested to find their resonance.
5. Results
a. Texture Analyzer
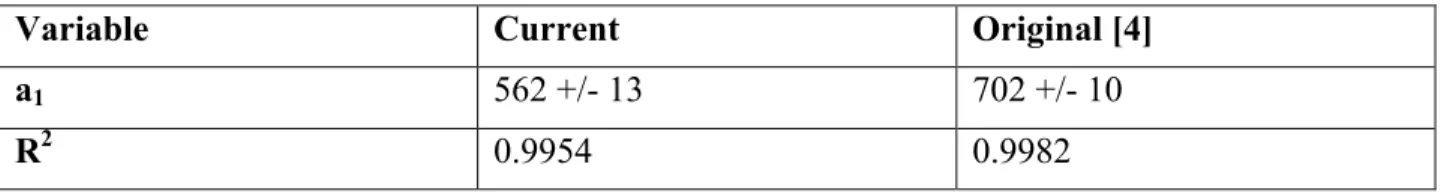
The texture analyzer is used as a standard for elasticity in order to relate CEM the resonance frequency found by CEMport to the CEM. A texture analyzer is used to measure the elasticity of agarose by quasi-static compression. By measuring the stress and strain created by the compression of the texture analyzer, the elasticity of the agarose was derived. By visual inspection of graphs 1 and 2, it is demonstrated that the elasticity of the most recently found data is roughly the same as the original data. Table 1 displays the result of the least squares fitting to the equation 𝐸 =𝑎!(𝑐−𝑐!)!, which is discussed in the background. The original a1 was 706 ± 10, while the new experimentally found a1was 562 ± 13 [4]. The a1 value is slightly lower than
expected due to falling outside of experimental error; however, it is suspected that the different results are due to a change in method. In the recent experiments, the samples were
pre-compressed until consistent data was collected, as opposed to analyzing the data as the sample were first experiencing the compression. Consistent data refers to the samples being compressed until there is no change in elasticity measurements. Due to this change in methods, the resulting elasticity measurements might be expected to change as well.
Graph 1: Current Data of the Elasticity of Agarose Using a Texture Analyzer
Graph 2: Original Data of the Elasticity of Agarose Using a Texture Analyzer [4]
0 2 4 6 8 10 12
0 1 2 3 4 5 6 7 8x 10
4
Agarose Concentration (mg/mL)
El
a
s
ti
c
it
y
(
Pa
)
Table 1: Result of the Least Squares Fitting of the Elasticity Data from the Texture Analyzer
Variable Current Original [4]
a1 562 +/- 13 702 +/- 10
R2 0.9954 0.9982
b. Reduction of Microwell Well Size
The original microwell is 150 µL and cuboid shaped, but a goal for this experiment is to reduce the sample size. The two designs are the cylinder flat bottom and cylinder spherical bottom microwells in the sizes 150 µL, 125 µL and 100 µL. The shape change is a preventative measure against the samples leaving residue in the corners of the well. The rounded edges will make the well easier to clean and increase the likelihood of a more accurate sample volume.
After experimenting with both shapes and sizes, it was demonstrated that the 100µL flat and spherical bottom microwells provided results with good fits. The flat bottom microwells were chosen due to the blood clot preparation requires keeping the different solutions separate until blood is added, which would be impossible with the spherical bottom. The flat bottom microwells also had higher resonances, which may be beneficial due to the fact blood has low stiffness and therefore resonates at lower frequencies. The lower the frequencies are less accurate due to the range of frequencies agarose is able to reach, therefore higher frequencies are ideal.
Graph 3: Acoustic Spectrograph of 100µLFlat Bottom Microwell at 3 mg/mL Agarose Concentration
0 50 100 150 200 250 300 350 400 0
1000 2000 3000 4000 5000
Amplitude Fitting
Frequency (Hz)
Am
p
li
tu
d
e
(
a
u
Graph 4: Acoustic Spectrograph of 100µLFlat Bottom Microwell at 3 mg/mL Agarose Concentratio
Graph 5: Acoustic Spectrograph of 100µLSpherical Bottom Microwell at 3 mg/mL Agarose Concentration
Graph 6: Acoustic Spectrograph of 100µLSpherical Bottom Microwell at 3 mg/mL Agarose Concentration
0 50 100 150 200 250 300 350 400 -2 -1 0 1 2 3 4 Phase Fitting Frequency (Hz) Ph a s e ( R a d ia n s )
0 100 200 300 400 500
0 200 400 600 800 1000 Amplitude Fitting Frequency (Hz) Am p li tu d e ( a u )
0 100 200 300 400 500
c. Calibration of the CEMport to the Flat Bottom Wells
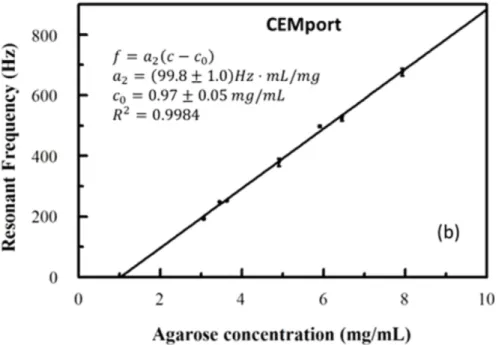
To complete the calibration of CEMport, the resonance of the agarose needs to be fitted to 𝑓! = 𝑎!(𝑐−𝑐!), which is described in more detail in background. Graphs 7 and 8 contain the flat bottom microwell data and the original cuboid data respectively. The a2 variable found was
98.9 ± 5.3, while the original was 99.8± 1.0. The found c0 value was 0.67± 0.2 and the original was 0.97± 0.05 [4]. Further details can be referenced from table 2. The a2 variable was found to
be within experimental error of the cube shape microwell, which is surprising due to the change in geometry; however, the c0 variable was found to be lower than the original cube shape. The
similarity in the a2 may be the result of having a similar boundary condition. The height of the
cuboid microwell was 5 cm, while the height of the cylindrical microwell was about 5.03 cm. The drastic change in the c0 variable may possibly be the result of the agarose absorbing
moisture over time. The same agarose used in the original CEMport calibration was used in this study, therefore the agarose is approximately 3 years old. With both a1 and a2 now calculated, a0
in the equation 𝐸 = 𝑎!𝜌𝑓!! may be found. The variable a
0 was found to be 0.063 ± 0.002 Pa/Hz2, whereas the original ratio was 0.076 ± 0.003 Pa/Hz2. The adjusted ratio may be due to the change in method for the texture analyzer rather than the change in geometry.
Graph 7: 100µL Flat Bottom Resonance Frequency of Agarose Using CEMport
0 2 4 6 8 10
0 100 200 300 400 500 600 700 800 900 1000
Agarose Concentration (mg/mL)
Re
s
o
s
a
n
c
e
(
Hz
)
Graph 8: Original Data of the Resonance Frequency of Agarose Using CEMport [4] Table 2: Summary of Coefficients of Fit for Flat Bottom Agarose Wells
Variable Current Original [4]
a2 (Hz•mL/mg) 98.9 +/- 5.3 99.8 +/- 1.0
c0 (mg/mL) 0.67 +/- 0.2 0.97 +/- 0.05
R2 0.9916 0.9984
d. Preliminary Blood Data
Preliminary blood data is shown in graphs 9 and 10 for human and mouse whole blood respectively. The elasticity for the human whole blood was 1.94 ± 0.03kPa and mouse was 2.98
Graph 9: Elasticity of Human Whole Blood Found by CEMport
Graph 10: Elasticity of Mouse Whole Blood Found by CEMport
6. Conclusion
The main motivation behind the presented research is to prepare CEMport for finding the elasticity of blood clots taken from mice with sickle cell disease. CEMport demonstrated its ability to reduce its original sample size from 150 µL to 100 µL while maintaining fit quality. The reduction in microwell size impact was clear when whole mouse blood was tested. Instead of having three samples with the 150µL microwells, our lab was able to create five 100µL samples. Undoubtedly, this is an advantage when working with small animals such as a mouse.
0 0.5 1 1.5 2 2.5
1 2 3
Elas3city (kPa)
Sam
ple
Human Whole Blood Elas3city
0 0.5 1 1.5 2 2.5 3 3.5 4 4.5 1
2 3 4 5
elas3city (kPa)
Sam
ple
There are some disadvantages to the smaller well size however, such as a higher rate of peaks caused by the microbead not being exactly in the middle of the well. The smaller wells are more sensitive to movement in the XY direction, which cause miniature peaks to appear in the
amplitude fitting. Generally fixing the placement of the microbead or having the fit program ignore the miniature peak can rectify this disadvantage.
The calibration coefficient found in this study was lower than expected; however, there was a significant change in methods with the texture analyzer. The pre-compression was not used in previous studies, which may have been the main contributor to the change in calibration coefficient. Surprisingly, the geometry of the well did not have a large effect on the calibration coefficient due to it being within the standard error of the original cube microwell. A potential explanation for their similarity is the main factor that causes the resonance is the height of the well due to boundary conditions [11]. The height of the well for the flat bottom and cube microwell was 5.03cm and 5.00 cm respectively and produced in the same way by the same manufacturer.
Preliminary testing of blood clots from both the human and mouse is promising for future study as the results fell within the expected ranges of elasticity for blood clots. The human blood compared to the mouse blood had less variability, therefore more practice is required in the future for preparing mouse blood. Important limits of the machine include the manual input required for recording a sample’s resonance, therefore preventing automatic recording of
elasticity of time as well as currently not being able to record clotting time. It is also important to note that lowest texture analyzer data point for agarose is 2.45± .01kPa; therefore lower elasticity values of blood are less certain. Overall, it appears that CEMport will be ready for sickle cell blood clot testing in the near future.
7. Acknowledgments
I would like to thank Dr. Amy Oldenburg for her guidance, support and patience in this project. We thank Dr. Alisa Wolberg and Dr. Lori Holle for their helps in providing blood clot materials and advice. I would like also like to acknowledge Ryan Krebs and Gongting Wu who worked extensively on CEMport before me providing a foundation for today’s work.
8. References:
[1] Collet, Jean-Philipee, Allali, Y., Lesty, C., Tanguy, M.L., Silvain J., Ankri, A.,Blanchet, R., Dumaine, J., Gianetti, L., Payot, L., Weisel, J.W., and G. Montalescot. “Altered Fibrin
Architecture Is Associated With Hypofibirinolysis and Premature Coronary Atherothrombosis.” Journal of the American Heart Association,26:2567-2573.
[2] Fatah, K., Silveira A., Tornvall P., Karpe F., Blombäck M., and M. Hamsten. “Proneness to formation of tight and rigid fibrin gel structures in men with myocardial infarction at a young age.” International Soceity on Thrombosis and Haemostasis, 76(4):535-40.
[3] Lund, Terje, Svindland, Aud, Pepaj Milaim., Jensen Aaase-Brith., Berg Jens P., Kilhovd, Bente, and Kristian F. Hanssen. “Fibrin(ogen) may be an important target for methylglyoxal-derive AGE modification in elastic arteries of humans.” Diabetes and Vascular Research, 8(4), 284-294.
clot micro-elastomety device based on resonant acoustic spectroscopy.” Review of Scientific Instruments, 86:075005.
[5]Collet, Jean-Philipee, Shuman, Henry, Ledger, Robert E., Lee, Seungtaek and John Weisel.
“The elasticity of an individual fibrin fiber in a clot.” Proceedings of the National Academy of Sciences of the United States, vol.102, no. 26, 2005, pp. 9133-9137.
[6] Weisel, John W. “Enigmas of Blood Clot Elasticity.” Science, vol. 320, no.5875, 2008, pp. 456-457.
[7] Wu, Gongting, Krebs, Charles R., Lin, Feng-Chang, Wolberg, Alisa S. and Amy L.
Oldenburg. “High sensitivity micro-elastometry: Applications in blood coagulopathy.” Annals of Biomedical Engineering, 41(10):2120-2129 (2013).
[8]McClellan, A. C., Luthi, J.-C., Lynch, J. R., Soucie, J. M., Kulkarni, R., Guasch, A., Huff, E. D., Gilbertson, D., McClellan, W. M. and DeBaun, M. R. “High one year mortality in adults with sickle cell disease and end-stage renal disease.” British Journal of Haematology. 159(3):360-7. [9]Ojodu, Jelili, Hulihan Mary M., Pope, Shammara N., and Althea M. Grant. “Incidence of Sickle Cell Trait- United States, 2010.” Morbidity and Mortality Weekly, 63(49);1155. [10] Krebs, Ryan Charles. “‘CEMport’ A portable, clot micro-elastometry device employing RASOV (Resonant Acoustic Spectroscopy with Optical Vibrometry).”MA thesis, University of North Carolina, 2013.
![Figure 1: Flow Chart of CEMport’s Hardware [4]](https://thumb-us.123doks.com/thumbv2/123dok_us/8331046.2210023/5.918.112.517.202.491/figure-flow-chart-cemport-s-hardware.webp)