The feasibility of direct treatment planning via
contrast-enhanced computed tomography: an
evaluation of dose differences based on the
dimensional dose distribution comparison method
INTRODUCTION
External beam radiotherapy dose calculation relies on electron densities that correspond to
plain computed tomography (CT) values. Although enhanced CT provides clearer and
more accurate de inition and delineation of
densities in non-uniformly enhanced tissues and vessels lead to the potential delivery of excessive doses. Therefore, some institutes prefer to avoid enhanced CT during dose calculation (e.g., the
Spain mode) (1). However, other researchers
suggest that this effect is not obvious because the differences can be ignored or are clinically
Y. Li, X. Sun
*, Q. Wang, Q. Zhou, B. Gu, H. Liu, G. Shi, D. Jiang,
T. Niu
Sir Run Shaw Hospital, Medical School of Zhejiang University, Hangzhou 310016, China
ABSTRACT
Background: We used a MapCHECK so ware-based dimensional dose
distribu on comparison method capable of evalua ng point-to-point geometrical dose differences in volume to determine whether doses obtained from an enhanced computed tomography (CT)-based treatment plan, which be%er defines the target regions and organs at risk, differs from doses obtained from plain CT and then evaluated the feasibility of treatment planning via enhanced CT. Materials and Methods: Forty-three randomly selected pa ents underwent plain and subsequent enhanced CT with the same se+ngs. Treatment plans developed for the two scans were iden cal in terms of planning parameters (e.g., isocentre, gantry angle, segments) and monitor units (MU) used for dose calcula on. Horizontal and ver cal dose distribu on planes across the same isocentre were selected from two types of plan; a two-dimensional dose distribu on analysis was used to determine the Distance-To-Agree (DTA) pass ra os of corresponding dose distribu on planes.Results: Obtained doses at the head and neck (H&N) and pelvic sites did not differ greatly between enhanced and plain CT. However, enhanced CT significantly influenced doses to the lower thoracic oesophagus. A corrected pass ra o that was achieved by non-pass points in lower isodose areas excluded from the sta s cal analysis had be%er clinical outcome.Conclusion:
Radia on plans with mul -fields and mul -angles can reduce the influence of enhanced CT on torso cases and may even negate its influence on H&N cases. Enhanced CT can be directly used for planning unless the target region contains the lower oesophagus and its surrounding blood vessel whose high density requires correc on.
Keywords: Treatment planning, enhanced CT, plain CT, dimensional dose distribution, dose comparison.
*Corresponding author: Dr. Xiaonan Sun,
Fax: +86 571 86044817 E-mail: [email protected] Revised: May 2016
Accepted: July 2016
Int. J. Radiat. Res., April 2017; 15(2): 167-175
► Original article
DOI: 10.18869/acadpub.ijrr.15.2.167
by the spleen; (2) accordingly, enhanced CT has been widely accepted for head and neck (H&N) planning.
Previously, phantoms or mathematical
methods were often used in dose calculation
studies (7-9). Contrast agent concentration
calculations or high-density phantoms (used to mimic enhancement) help to clarify in luences of these factors on dose calculation. Yamada and
colleagues (7) reported simulations of plain and
enhanced CT by using water and iodine phantoms respectively. Meanwhile, he also reported a novel evaluation method, in which both of scanned images were imported to the Pinnacle planning system (Philips, Inc., Madison, WI, USA) and dose distributions were obtained from the identical single-beam radiation with
subsequent MapCHECK (Sun Nuclear,
Melbourne, FL, USA) dose difference
veri ication. Ramm et al. (8) applied different
density phantoms gotten by contrast agent lows with different velocities, which irradiated by various beam with different energies, they set up the quanti ication of potential variances in
calculated doses. Robar et al. (9) examined the
magnitude of tumour dose enhancement by the incidence on phantom containing different density contrast agent with simulation of various energy photon. Both groups suggested
that in luence of contrast agent on dose correlated with the beam energy, agent density,
and concentration. Phantom-based methods
simulate the ideal situations and verify the conceptualization and abstraction of actual situations. Unlike phantom material densities
(usually distributed isotropically and uniformly), injected agents are distributed anisotropically in human bodies. Consequently, actual patients differ considerably from phantoms. Single-beam radiation differs considerably from the beams used in clinical settings.
Previous reports (2-6) described the use of
tumours in speci ic sites to illustrate the
in luence of contrast agent. Shibamoto (2)
conducted dose evaluations in the conventional anterior-posterior (AP) direction, but they were unable to re lect the multi- ield/multi-angle
feature used in intensity-modulated
radiotherapy (IMRT). The method used in those
studies did not re lect the multi-beam and multi-angle set-up used in IMRT. IMRT plan involves many organs, many different ields and many differential density distribution issues.
IMRT planning has become standard for treatment planning, its optimization, which results in different beam directions and weights, can dilute the effect from above-described ideal
simple- ield methods with uniform high
phantom densities. Choi et al., (3) Lee et al.,(4)
Liauw et al., (5) and Xiao et al. (6) used IMRT to
evaluate lung cancer, H&N cancers, and nasopharyngeal carcinoma (NPC). However,
statistical comparisons of inter-plan dose
variances in the above-mentioned studies (2-6)
relied on dose volume histograms (DVHs) and statistical dose distribution parameters. For example, DVH statistical parameters such as the
maximum dose (Dmax), average dose (Dmean),
volume doses (D95, D50), and dose volumes (V20,
V30) cannot be used to assess the geometric
accuracy of a non-uniform dose distribution because spatial information is lost. Thus, the
DVH does not re lect the two or
three-dimensional dose distribution. According-ly, we describe a method for planning and evaluating non-uniform treatment doses that consider the geometric position.
The distance-to-agreement (DTA) pass ratio can be used to apply for dose distribution comparisons by its straightforward point-to-point dose veri ication on geometric position.
Yamada and colleagues (7) applied a
two-dimensional dose distribution analysis tool in MapCHECK software with a DTA comprising a dose threshold of 10%, an acceptance criteria percent difference of 2%,and distance of 2 mm (10%, 2, 2; threshold is the per cent contour above which all points are included in the DTA analysis; per cent difference is the allowed difference between co-located compared points; distance is the radius around the compared point de initions of values)to compare the dose distribution by outcome of pass ratio. However, results of mono-beam and phantom-based evaluations vary from those in actual clinical settings, as patient treatment requires greater complexity. Mono-beam radiation tests with phantoms which simulate uniform contrast
168
Int. J. Radiat. Res., Vol. 15 No. 2, April 2017
agent concentrations yields dramatic dose differences, it is not consistent with those observed in real patients, in whom tissue density
distributions differ and multi- ield and
multi-angle radiation ields are used for
planning.
Shibamoto and colleagues2 also mentioned
that during patient treatment planning, the in luence of contrast agent on dose was tumour site-dependent. However, the planning process in that study mainly relied on three-dimensional conformal radiotherapy (3DCRT), for which plans are constructed using a few radiation ields, only a few reference points are used to compare differences in monitor units (MUs). IMRT planning design is not considered. As
IMRT is the most popular radiotherapy technique, 88.37% of samples used to determine
dose distribution in our study were based on IMRT plans. For dose variance evaluation, we used the MapCHECK two-dimensional dose distribution analysis software package to compare dose distribution differences between
the two orthogonal dose planes.
MATERIALS AND METHODS
In our method, the patient underwent an initial plain CT scan (SOMATOM De inition AS; SIEMENS, Munich, Germany). Subsequently, an iodine-based enhancing agent (Iopamiro 370, 90
ml; Bracco, Shanghai, China) was injected intravenously prior to enhance CT, during which
the same body site was imaged in the venous phase. For patients undergoing H&N scans, a thermal mask was used to acquire 3-mm-thick image slices. For other sites (e.g.: thorax, abdomen, and pelvis), a skin surface marker was used and 5-mm-thick image slices were acquired (exception: 2-mm-thick slices for the prostate). The delay times for the H&N, thoracic, abdominal, and pelvic regions were 65s, 38s, 60s, and 65s, respectively. The present study was approved by the ethics committee of the Sir Run Shaw Hospital (Hangzhou, China). Plain and enhanced CT images were imported in Digital Imaging and Communications in Medicine
Pinnacle 7.6 treatment planning system (Philips, Inc.), thus allowing target region and organs at
risk (OAR) de inition and contouring by physician. Speci ically, direct machine parameter
optimization (DMPO) and a convolution/ superposition algorithm were applied, and a
minimum constrained radiation ield of 10 cm2
was de ined during IMRT optimization. Beam energy with 6MV is used for H&N calculations
and 10MV for others. Treatment planning continued until the physician was satis ied that
the dose distribution met the clinical treatment
requirement. The same plan parameters
(coordinate system, beam angle, multileaf
collimator [MLC] segment shape, dose
calculation range, calculation grid size, MU values, and dose prescription) and same isocentre point (ISO) were used for plain and
enhanced CT. Dose calculations based on the above-mentioned plan settings were performed by using another CT image. The applied average
radiation ield number, average segment
number, and radiation techniques (e.g., IMRT or
3DCRT) used for planning were classi ied according to the H&N, thoracic/abdominal, and
pelvic regions and are summarized in table 1. Although scanning was performed while the patient was in a resting position, the positions used for plain and enhanced CT differed slightly. During thoracic and upper abdominal scanning, respiratory motion lifts the target region and displaces the OAR. Similarly, cardiac motion and gastrointestinal motility affect the position of the adjacent target region. In contrast, the effects of respiration and organ movement on the H&N and pelvic regions are relatively small. The main blood vessels are located in the thoracic and abdominal region, causing increased contrast agent uptake. In contrast, the smaller vessels in the H&N and pelvic regions exhibit less contrast
agent uptake. To take into account this discrepancy, we classi ied patients into H&N,
thoracic/abdominal, and pelvic groups for our analysis.
The plain and enhanced CT results could be compared objectively, as all treatment planning parameters were identical. Hence, the potential agent density-based dose difference between
irst calculated the two-dimensional orthogonal (they have smallest mutual correlation, and are chosen to represent the three-dimensional distribution), horizontal(x-plane), and vertical (y-plane) plane dose distributions across the
same ISO and entered these values into MapCHECK to evaluate differences in plan dose
distributions. The DTA pass ratio, with the above -described settings of 10%, 2, 2, was ap-plied to compare dose distributions. Data in
ta-ble 1 was analysed by comparing means function in Statistical software SPSS13.0 (SPSS Inc., Chicago, IL, USA).
170
Int. J. Radiat. Res., Vol. 15 No. 2, April 2017
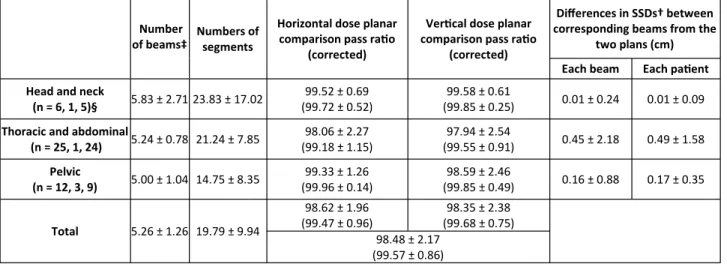
Table 1. Sta s cal data of samples from the head and neck, thoracic/abdominal, and pelvic regions.
Number of beams‡
Numbers of segments
Horizontal dose planar comparison pass ra o
(corrected)
Ver cal dose planar comparison pass ra o
(corrected)
Differences in SSDs† between corresponding beams from the
two plans (cm) Each beam Each pa ent Head and neck
(n = 6, 1, 5)§ 5.83 ± 2.71 23.83 ± 17.02
99.52 ± 0.69 (99.72 ± 0.52)
99.58 ± 0.61
(99.85 ± 0.25) 0.01 ± 0.24 0.01 ± 0.09
Thoracic and abdominal
(n = 25, 1, 24) 5.24 ± 0.78 21.24 ± 7.85
98.06 ± 2.27 (99.18 ± 1.15)
97.94 ± 2.54
(99.55 ± 0.91) 0.45 ± 2.18 0.49 ± 1.58
Pelvic
(n = 12, 3, 9) 5.00 ± 1.04 14.75 ± 8.35
99.33 ± 1.26 (99.96 ± 0.14)
98.59 ± 2.46
(99.85 ± 0.49) 0.16 ± 0.88 0.17 ± 0.35
Total 5.26 ± 1.26 19.79 ± 9.94
98.62 ± 1.96 (99.47 ± 0.96)
98.35 ± 2.38 (99.68 ± 0.75)
98.48 ± 2.17
(99.57 ± 0.86)
† SSD, source-skin distance
‡ Data are shown as means ± standard devia ons.
§ For n = (a, a1, a2), a, indicates the number of samples, a1 indicates the number treated using 3-dimensional conformal radiotherapy, and a2 indicates the number treated using intensity-modulated radiotherapy.
RESULTS
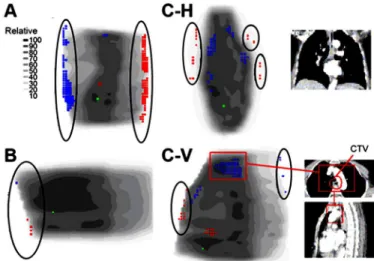
Figure 1A shows the vertical dose
cross-section distribution of a thoracic
oesophageal cancer patient; in this igure, green points indicate the reference points, and red and blue points respectively indicate higher and lower dose points relative to the reference point. Accordingly, this cross-section indicates a distinct difference in dose distribution, with a pass ratio of 91.4%. However, these differences existed mainly in the surrounding low-dose region, which has only a minor in luence on clinical treatment outcome. In other words,
these differences are also largely
site-dependent, which might explain the relatively low pass ratio for the thoracic/
abdominal region. So we have a corrected pass ratio concept.it can be obtained by doing so: if the position of the non-pass dose point, lies
outside of the 70% ISO-dose line, they would be rejected and not calculated in pass ratio. Only different points in the target region and high
dose region (≥70%) are considered for calculating. Then the pass ratio in igure 1-A
might reach as high as 99.9%, which we think as a corrected pass ratio. Figure 1-B presents a dose view of a lower abdomen with a high pass ratio of 99.4%, similar to the case in Figure 1- A, 100% pass ratio was achieved after correction.
For each patient and radiation ield,
source-skin distances (SSDs) from the
corresponding radiation ields were recorded for both CT techniques and subjected to a simple statistical analysis in order to evaluate body position displacement in the H&N, thoracic/ abdominal, and pelvic regions. The pass ratios
(and corrected pass ratios) of the
two-dimensional dose distributions in the two orthogonal planes were also analysed (table 1).
DISCUSSION
Yamada and colleagues (7) reported that the
mono-beam radiation pass ratio for enhanced CT was 50–60% less than that for plain CT. In contrast, our results indicated a similar pass rate between enhanced and plain CT (98.48 ± 2.17%)
for actual clinical cases (table 1). Our convolution/superposition algorithm (TPS dose
calculation methods) is superior in terms of the
calculation error, (10-12) although a 2–3.6%
calculation error remained. With regard to TPS
calculation error, this rate was clinically acceptable. Through pass ratio analysis and its
correction we determined that enhanced CT might be clinically acceptable for treatment planning (table 1).
Figure 1-C-H and 1-C-V illustrate the horizontal and vertical sections from a patient
with lower oesophageal cancer; in this typical case, the dose differences were more distinct in both sections. The pass ratios of the horizontal and vertical sections were 94.4% and 95.8% respectively. The radiation target region
con-tained not only the mid-lower oesophageal segment, but also part of the vascular system, in
which the tumour had grown. Accordingly, the clinical target volume (CTV) included vascular
tissue, as indicated by the National
guideline for oesophageal cancer. The CTV was surrounded by the heart and primary vessels,
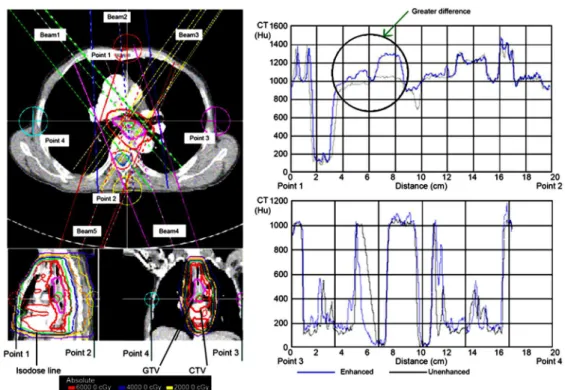
which had a high contrast agent density, resulting in a low pass ratio in this region. Figure 2 illustrates CT value distributions that
crossed the ISO-centre in the anterior-posterior (AP) and left-right (LR) directions. The heart in
igure 2 was indicated by a region with a high-density difference. The upper left panel of
igure 2 shows the radiation ield settings with beam passes from the high-density region. Beam angles were restricted by the dose constraint set for the lung. All beams, especially higher weight beams (e.g., beam 2, 33.86% and beam 4, 25.48%) passed through high agent density regions within the radiation ields. The dose in the high agent density region induced by enhanced CT differed considerably from that induced by plain CT. Accordingly, non-pass points were concentrated in the target region and the surrounding high agent density areas. As these affected regions were located inside of the
70% ISO-dose lines areas, the
corrected horizontal and vertical sections pass ratios (96.24% and 96.25%, respectively) were
not distinct to become better. Therefore, particular attention should be paid to treatment
planning for target regions with density changes based on enhanced CT.
Figure 1. (A) Ver cal dose distribu on sec on view of a thoracic oesophageal case. (B)Ver cal dose distribu on sec on view of
Lower abdominal case(C-H)/(C-V) Horizontal and ver cal dose distribu on sec ons view of the lower oesophageal case. The scale indicates rela ve contrast. Points in black ellipsoids, which are non-pass and outdise of the 70% isoline areas are not included in correc ve pass ra o calcula ons. Points in red boxes, which are non-pass and inside of the 70% isoline areas, locate in the areas
with high density. CTV, clinical target volume.
When data from all patients were corrected, nearly all plans achieved high pass ratios, with an average of 99.57% ± 0.86% (table 1). This improvement was particularly obvious in the pelvic region, possibly because the non-pass points in this region were mainly located at the body surface rather than in the target region. This signi icant improvement in the pass ratio made our conclusion more easily acceptable.
The value of the pass ratio also correlated with patient motion. For example, respiratory motion and consequent surface displacement caused lower pass ratios in the thoracic/ abdominal region, comparing to the pelvic region and the H&N region, which had the smallest displacement(nearly rigid)(table 1). However, pass ratio correction mitigated this tendency, indicating 1) the robustness of target region ISO-centre beam irradiation regardless of position error and 2) a smaller dose in luence from enhanced CT than the current data. The pass ratio will increase if the position errors decrease.
The H&N and pelvic regions contain smaller vessels and are thus less affected by contrast
agents with corresponding smaller effects from density differences. In contrast, organs such as the kidneys, heart, liver, spleen, and primary vessels in the thoracic/abdominal region are
strongly affected by agent density with corresponding dose heterogeneity. The results
in Table 1 support this concept. The H&N region
features dual radiation ields (e.g., LR and right-left [RL] direction beams) and three- ield
IMRT. However, these factors do not greatly affect dose calculation errors. No obvious agent density-related dose differences were observed with IMRT in the thoracic/abdominal and pelvic regions; if there is any difference, the difference observed was only slightly larger than that of the H&N.
For phantom-based enhanced CT studies, the planned radiation beam is limited to one or two angles and the ield area is larger. These factors
increase dose differences in an agent
density-dependent manner. This dose difference is lower for IMRT plans involving multi-angle beams and multi-segment ields (some with small areas) to ensure a multi- ield overlap irradiation. Our results were consistent with
172
Int. J. Radiat. Res., Vol. 15 No. 2, April 2017
Figure 2. Computed tomography (CT) value distribu ons in the superior-posterior and le -right direc ons across the isocentre.
CTV, clinical target volume; GTV, gross target volume.
those reported by Yamada et al.(7) and Ramm et
al. (8) Yamada and colleagues suggested that
small radiation ields were not strongly affected by the contrast agent and thus had high pass
ratios (7). Based on a mono- ield radiation
phantom study, Ramm and colleagues reported that the dose difference between enhanced and plain CT at an energy beam of 6–25MV was
proportional to the agent density and velocity (8).
This dose disturbance was<1–3% at <500 Houns ield Units (HU) and a ield radius of<5cm. A small ield with lower density contrast agent had only a small in luence on the dose, and multi - ield radiation could further reduce the effects of the contrast agent. Both of these studies observed that a high-MV beam was more resistant to contrast agent and was associated
with smaller dose differences (7, 8).Liauwand
col-leagues concluded that a multi- ield, multi-angle region with a small radiation volume would
experience a smaller dose disturbance (5). These
conclusions could explain our IMRT-based results. For enhanced CT, factors such as a
high-density tissue distribution, relative
position to the target region, radiation angle, and high-density volume through which the beam passes could all affect dose calculations.
However, this in luence is not dramatic if multi- ield (including segments) and multi-angle
irradiation techniques (e.g. IMRT) are used. Yamada and colleagues also reported the
achievement of a high pass ratio when evaluating a small ield using MapCHECK during
a phantom study, (7) indicating that the in luence
of contrast agent on dose is not obvious in small radiation ields. Although Ramm and colleagues
agreed with this concept (8), Xiao and colleagues
disagreed (6). One possible reason for this
discrepancy is the use of different design and evaluation methods. The DVH-based statistical dose evaluation method did not consider the
large uncertainty of the exact geometrical position with respect to dose evaluation. Xiao
and colleagues focused only on lung tissue;
therefore, further studies are required for veri ication.
Comparing to previous studies, we did not
use image fusion/registration (3, 4, 6) as the
actual treatment situation. The two CT scanning times (including the agent injection time) were shorter than the IMRT irradiation time. The displacement in patient position during the scanning period did not exceed the displacement during the treatment stage. It is more clinically
relevant and practical to perform dose comparisons using actual patient positions. Deformable image registration (DIR) of organ and target regions is possible, but whether this method can accurately re lect the effect of the actual body position during treatment should be carefully considered, especially for the target
region and OAR. Because the DIR always contains error (approximate average DIR error:
1.44 mm) (13), Kirby and colleagues suggested
that different DIRs would correspond to different clinical applications and that trade-off
points exist for the errors in volume and
similarity matching (13).Notably, the CT position
used for DIR and the inal fused position also differ in terms of phase motion. It remains uncertain whether the fused position is the true
radiation position or, at least, the best approximation. Currently, dose pass rate evaluations are conducted precisely and directly
and involve fewer manipulations of the data and patient position to better approximate an actual treatment situation.
The dimensional dose distribution
comparison method permits straight forward point-to-point comparisons in dose planes and is
thus rational and objective. However, no extractable parameters are correlated with
evaluations of the OAR response and treatment effect. Hence, further study is needed.
Further investigation is also needed to determine whether the in luence of an enhanced CT-based dose calculation will be smaller in IMRT plans containing higher numbers of ields or angles. Virtual or arti icial intelligence-based
technology methods to reduce dose
disturbances in tumour regions (e.g., the lower oesophagus) and thus remove the enhancement
effect are also needed (7). Simple methods (14, 15)
that incorporate density correction could be applied for clinical corrected dose calculations. for example, the HU values of the heart and great
average HU values obtained from the unenhanced CT, and in the Lung patients the CT
to density conversion table used clinically was altered to reduce the effect of the increased density due to the contrast agent, in which
tissues with a density between 1 g·cm–3 and 1.2
g·cm–3 were set equal to a density of 1 g·cm–3. In
comparison to the work conducted by
Shibamoto and colleagues, (2) who used AP, RL,
RA-LP oblique, and RA-LP oblique directional radiation, we used IMRT with an increased number of radiation directions and large weighed radiation ields at other angles. Hence, our dose disturbances in the spleen and kidney
were less obvious than those reported
previously (2). Using our technique, the radiation
ield was more dispersed and the beam ield did not deliberately pass through the enhanced OAR. The upper abdominal sample number in this study was small (n=8), However, more additional data are needed to draw a solid conclusion.
Despite the existence of position errors, our evaluation more closely approximates actual clinical situations; our evaluation is useful with respect to the clinical endpoint. More accurate
evaluation of dose differences is possible if respiration gating or other novel image-guided
radiotherapy techniques are applied to control respiration-induced organ motion, thus reducing
positioning errors (6).
Our results achieved in the H&N region were
consistent with those from earlier studies, (2-6)
thus supporting the universal agreement that enhanced CT-induced dose disturbance scan be ignored in this region. Similarly, these dose disturbances do not have obvious effects on the pelvic region. Effects of dose disturbances on abdominal organs (e.g., liver, kidney, and spleen)
and the thorax are small and clinically acceptable. However, a large dose disturbance is
induced by contrast agents in the lower oesophageal segment of the inferior thoracic
region, which is surrounded by high agent density organs such as the heart and primary
vessels. The pass ratio can be improved by doing
correction. Hence, in actual clinical cases, enhanced CT can be used directly for IMRT
planning, except for patients in whom the target
region contains the lower oesophageal segment and surrounding blood vessels, as this high density area requires density correction.
ACKNOWLEDGEMENTS
This work was supported in part by a grant from the Major Science and Technology Program of Zhejiang Province in China (No.2013C03044-6).
Con licts of interest: Declared none.
REFERENCES
1. Casas F, Vinolas N, Sanchez-Reyes A, Jorcano S,Planas I, Marruecos J, Pino F, Herreros A,Biete A (2006) Spanish pa%erns of care for 3D radiotherapy in non-small-cell lung cancer. Int J Radiat Oncol Biol Phys, 65: 138-42.
2. Shibamoto Y, Naruse A, Fukuma H, Ayakawa S, Sugie C, Tomita N (2007) Influence of contrast materials on dose calcula on in radiotherapy planning using computed to-mography for tumors at various anatomical regions: a prospec ve study. Radiother Oncol, 84: 52-5.
3. Choi Y, Kim JK, Lee HS, Hur WJ, Hong YS, ParkS, AhnS, ChoH (2006) Influence of intravenous contrast agent on dose calcula ons of intensity modulated radia on therapy plans for head and neck cancer. Radiother Oncol, 81: 158-62.
4. Lee FK, Chan CC, Law CK (2009) Influence of CT contrast agent on dose calcula on of intensity modulated radia on therapy plan for nasopharyngeal carcinoma. J Med Imag-ing Radiat Oncol, 53: 114-8.
5. Liauw SL, Amdur RJ, Mendenhall WM, Palta J, Kim S (2005) The effect of intravenous contrast on intensity-modulated radia on therapy dose calcula ons for head and neck cancer. Am J Clin Oncol, 28: 456-9.
6. Xiao JH, Zhang H, Gong YL, Fu YC, Tang Bin, Wang SC, Jiang QF, Li P (2010) Feasibility of using intravenous contrast-enhanced computed tomography (CT) scans in lung cancer treatment planning. Radiother Oncol, 96: 73-7.
7. Yamada S, Ueguchi T, Ogata TMizuno H, Ogihara R, Koizu-mi M, Shimazu T, Murase K, Ogawa K (2014) Radiotherapy treatment planning with contrast-enhanced computed tomography: feasibility of dual-energy virtual unenhanced imaging for improved dose calcula ons. Radiat Oncol,9: 168.
8. Ramm U, Damrau M, Mose S, Manegold KH, Rahl CG, Bö%cher HD (2001) Influence of CT contrast agents on
dose calcula ons in a 3D treatment planning system. Phys
Med Biol, 46: 2631-5.
9. RobarJL, Ricco SA, Mar n MA (2002) Tumor dose enhance-ment using modified megavoltage photon beams and
174
Int. J. Radiat. Res., Vol. 15 No. 2, April 2017
contrast media. Phys Med Biol,47: 2433-49.
10. Fogliata A, Vane+ E, Albers D, Brink C, Clivio A, Knöös T, Nicolini G, Cozzi L (2007) On the dosimetric behaviour of photon dose calcula on algorithms in the presence of simple geometric heterogenei es: comparison with Monte Carlo calcula ons. Phys Med Biol, 52: 1363-85.
11. Vanderstraeten B, Reynaert N, Paelinck L, MadaniI, Wag-ter CD, Gersem WD, Neve WD, Thierens H (2006) Accuracy of pa ent dose calcula on for lung IMRT: A comparison of Monte Carlo, convolu on/superposi on, and pencil beam
computa ons. Med Phys, 33: 3149-58.
12. Paelinck L, Reynaert N, Thierens H, Neve WD, Wagter CD (2005) Experimental verifica on of lung dose with radio-chromic film: comparison with Monte Carlo simula ons
and commercially available treatment planning systems.
Phys Med Biol,50: 2055-69.
13. Kirby N, Chuang C, Ueda U, Pouliot J (2013) The need for applica on-based adapta on of deformable image regis-tra on. Med Phys, 40: 011702.
14. Hwang UJ, Shin DH, Kim TH, Moon SH, Lim YK, Jeong H, Rah JE, Kim SS, Kim JY, Kim DY, Park SY, Cho KH (2011) The effect of a contrast agent on proton beam range in radio-therapy planning using computed tomography for pa ents with locoregionally advanced lung cancer. Int J Radiat Oncol Biol Phys, 81: 317-24.
15. Burridge NA, Rowbo%om CG, Burt PA (2006) Effect of
con-trast enhanced CT scans on heterogeneity corrected dose
computa ons in the lung. J Appl Clin Med Phys, 7: 1-12