Exploration of Significant Relationships between Gut Microbiota Variables
and Obesity Measures in the China Health and Nutrition Survey
By
Katherine Gora Combs
Senior Honors Thesis
Biostatistics
University of North Carolina at Chapel Hill
April 1, 2019
Approved:
_______________________________
Annie Green Howard, Thesis Advisor
Penny Gordon-Larsen, Reader
Abstract
List of Tables and Figures
Table 1. High Waist Circumference
Table 2. Body Mass Index Standards for Overweight Individuals Table 3. Study Population Characteristics
Table P.1. Significant Probabilities for Body Mass Index – Phylum, unadjusted Table P.2. Significant Probabilities for Waist Circumference – Phylum, unadjusted Table P.3. Significant Probabilities for Visceral Fat Score – Phylum, unadjusted
Table P.4. Significant Probabilities for Overweight by General WHO Reference – Phylum, unadjusted
Figure P.1. Total Number of FDR-corrected, statistically significant bacterial phylum, as measured by log abundance, by Anthropometric Variable (Phylum, unadjusted)
Figure P.2. Percent of Significant Probabilities by Bacteria Phylum Level (Order, unadjusted) Table C.1. Significant Probabilities for Body Mass Index – Class, unadjusted
Table C.2. Significant Probabilities for Waist Circumference – Class, unadjusted Table C.3. Significant Probabilities for Visceral Fat Score – Class, unadjusted
Table C.4. Significant Probabilities for High Waist Circumference – Class, unadjusted
Table C.5. Significant Probabilities for Overweight by General WHO Reference – Class, unadjusted Figure C.1. Total Number of FDR-corrected, statistically significant bacterial classes, as measured by log abundance, by Anthropometric Variable (Class, unadjusted)
Figure C.2. Percent of Significant Probabilities by Bacteria Phylum Level (Class, unadjusted) Table O.1. Significant Probabilities for Body Mass Index – Order, unadjusted
Table O.2. Significant Probabilities for Waist Circumference – Order, unadjusted Table O.3. Significant Probabilities for Body Fat Percentage– Order, unadjusted Table O.4. Significant Probabilities for Visceral Fat Score – Order, unadjusted
Table O.5. Significant Probabilities for High Waist Circumference – Order, unadjusted
Figure O.1. Total Number of FDR-corrected, statistically significant bacterial orders, as measured by log abundance, by Anthropometric Variable (Order, unadjusted)
Figure O.2. Percent of Significant Probabilities by Bacteria Phylum Level (Order, unadjusted)
Table F.1. Significant Probabilities for Body Mass Index – Family, unadjusted Table F.2. Significant Probabilities for Waist Circumference – Family, unadjusted Table F.3. Significant Probabilities for Body Fat Percentage– Family, unadjusted Table F.4. Significant Probabilities for Visceral Fat Score – Family, unadjusted
Table F.5. Significant Probabilities for High Waist Circumference – Family, unadjusted
Table F.6. Significant Probabilities for Overweight by General WHO Reference – Family, unadjusted Table F.7. Significant Probabilities for Overweight by WHO Reference for Asian Populations – Family, unadjusted
Figure F.1. Total Number of FDR-corrected, statistically significant bacterial families, as measured by log abundance, by Anthropometric Variable (Family, unadjusted)
Figure F.2. Percent of Significant Probabilities by Bacteria Phylum Level (Family, unadjusted) Table G.1. Significant Probabilities for Body Mass Index – Genus, unadjusted
Table G.2. Significant Probabilities for Waist Circumference – Genus, unadjusted Table G.3. Significant Probabilities for Body Fat Percentage – Genus, unadjusted Table G.4. Significant Probabilities for Visceral Fat Score – Genus, unadjusted
Table G.5. Significant Probabilities for High Waist Circumference – Genus, unadjusted
Table G.6. Significant Probabilities for Overweight by General WHO Reference – Genus, unadjusted Table G.7. Significant Probabilities for Overweight by WHO Reference for Asian Populations – Genus, unadjusted
Figure G.1. Total Number of FDR-corrected, statistically significant bacterial genus, as measured by log abundance, by Anthropometric Variable (Genus, unadjusted)
Figure G.2.
Percent of Significant Probabilities by Bacteria Phylum Level (Genus, unadjusted)
Table M.1. Significant Probabilities for MDS Measures, unadjusted
Table P.2.1. Significant Probabilities for Waist Circumference – Phylum, adjusted
Table P.3.1. Significant Probabilities for Body Fat Percentage– Phylum, adjusted Table P.4.1. Significant Probabilities for Visceral Fat Score – Phylum, adjusted
Table P.5.1. Significant Probabilities for High Waist Circumference – Phylum, adjusted
Figure P.1.1. Total Number of FDR-corrected, statistically significant bacterial phylum, as measured by log abundance, by Anthropometric Variable (Phylum, adjusted)
Figure P.2.1. Percent of Significant Probabilities by Bacteria Phylum Level (Phylum, adjusted) Table C.1.1. Significant Probabilities for Waist Circumference – Class, adjusted
Table C.2.1. Significant Probabilities for Body Fat Percentage– Class, adjusted Table C.3.1. Significant Probabilities for Visceral Fat Score – Class, adjusted
Figure C.1.1. Total Number of FDR-corrected, statistically significant bacterial classes, as measured by log abundance, by Anthropometric Variable (Class, adjusted)
Figure C.2.1. Percent of Significant Probabilities by Bacteria Phylum Level (Class, adjusted) Table O.1.1. Significant Probabilities for Waist Circumference – Order, adjusted
Table O.2.1 Significant Probabilities for Visceral Fat Score – Order, adjusted
Figure O.1.1. Total Number of FDR-corrected, statistically significant bacterial orders, as measured by log abundance, by Anthropometric Variable (Order, adjusted)
Figure O.2.1. Percent of Significant Probabilities by Bacteria Phylum Level (Order, adjusted) Table F.1.1. Significant Probabilities for Waist Circumference – Family, adjusted
Table F.2.1. Significant Probabilities for Visceral Fat Score – Family, adjusted
Figure F.1.1. T Total Number of FDR-corrected, statistically significant bacterial families, as measured by log abundance, by Anthropometric Variable (Family, adjusted)
Figure F.2.1. Percent of Significant Probabilities by Bacteria Phylum Level (Family, adjusted) Table G.1.1. Significant Probabilities for Body Mass Index – Genus, adjusted
Table G.4.1 Significant Probabilities for Visceral Fat Score – Genus, adjusted
Figure G.1.1. Total Number of FDR-corrected, statistically significant bacterial genus, as measured by log abundance, by Anthropometric Variable (Genus, unadjusted)
Background
In the last twenty years, the prevalence of obesity has more than doubled in Western and Westernizing countries.1 Though the increases are not new in the United States and other more urbanized nations, the rapid emergence of the epidemic in Westernizing countries like China has been particularly alarming. Since the 1990s, China has experienced vast economic growth and urbanization. These changes can lead to adjustments in the lifestyles of the country’s residents, including a “nutrition transition”. The transition which involves the increased consumption of foods high in fats and sweeteners has been shown to increase the prevalence of chronic illnesses and obesity2. Researchers at the Johns Hopkins School of Public Health found that between 1992 and 2002, the prevalence of overweight and obese individuals in China increased in all sex and age groups. The increase was also found in all geographic areas.3 The overall prevalence of obesity increased from 20.0 to 29.9% during this ten-year time frame4 and there is evidence to suggest that this prevalence still is following a similar increase in the country, especially among children and adolescents.5 Understanding these increases in obesity and other chronic diseases is necessary to curb substantial implications both in China and other low- and middle-income countries that have experienced similar globalization and urbanization.6
Research is strong in the area of the relationship between diet and obesity; however, there has been a recent surge in the area of gut microbiota and its relationship to obesity.7 The literature on this relationship
1 James, Philip T. "Obesity: the worldwide epidemic." Clinics in dermatology 22, no. 4 (2004): 276-280. 2 Hawkes, Corinna. "Uneven dietary development: linking the policies and processes of globalization with the
nutrition transition, obesity and diet-related chronic diseases." Globalization and health 2, no. 1 (2006): 4.
3Wang, Y., Jianchun Mi, X. Y. Shan, Qiong J. Wang, and K. Y. Ge. "Is China facing an obesity epidemic and the
consequences? The trends in obesity and chronic disease in China." International journal of obesity 31, no. 1 (2007): 177.
4 Ibid.
5Zong, Yinan, Runsheng Xie, Nali Deng, Li Liu, Weiqing Tan, Yanhui Gao, Jiewen Yang, and Yi Yang. "Secular
trends in overweight and obesity among urban children and adolescents, 2003–2012: A serial cross-sectional study in Guangzhou, China." Scientific reports 7, no. 1 (2017): 12042.
6 Popkin, Barry M. "Synthesis and implications: C hina's nutrition transition in the context of changes across other
low‐and middle‐income countries." Obesity reviews 15 (2014): 60-67.
7 Clarke, Siobhan F., Eileen F. Murphy, Kanishka Nilaweera, Paul R. Ross, Fergus Shanahan, Paul W. O’Toole, and
presents mixed results8 and the variation in study design and measurement is vast. While it has been shown that Western (animal-based) diets are associated with increased risk of obesity and cardiometabolic diseases as compared to traditional (plant-based) diets9, research has now suggested that these dietary shifts influence the gut microbial community and leads to changes in metabolism.10 However, due to a small number of studies that explore this phenomenon in free-living humans with strong exposure and phenotypic data over extended periods of follow-up, there is less research on how differences in short- and long-term diet changes shape gut microbiota. The China Health and Nutrition Survey allows for unprecedented research in this area. Using data from this rich survey, we hope to explore the significant relationships between phylum categories of gut microbiota and a variety of anthropometric variables that measure different components of obesity.
Methods Study Design and Participants
Data were from the China Health and Nutrition Survey (CHNS), a prospective household-based study across 12 provinces (Heilongjiang, Liaoning, Jiangsu, Shandong, Henan, Hubei, Hunan, Guangxi, Guizhou, Shaanxi, Yunnan, and Zhejiang) and 3 mega-cities (Beijing, Chonqing and Shanghai) in China. Surveys began in 1989, with 8 original provinces with subsequent surveys every 2-4 years, for a total of 10 rounds between 1989 and 2015. One additional province was added in 1997, three-mega-cities were added in 2011 and three final provinces were added in 2015. The CHNS was designed to provide representation of rural, urban, and suburban areas varying substantially in geography, economic development, public resources, and health indicators, and is the only large-scale, longitudinal study of its kind in China. A
8Ley, Ruth E., Peter J. Turnbaugh, Samuel Klein, and Jeffrey I. Gordon. "Microbial ecology: human gut microbes
associated with obesity." nature 444, no. 7122 (2006): 1022.
9Adair, Linda S., Penny Gordon‐Larsen, S. F. Du, Bing Zhang, and Barry M. Popkin. "The emergence of
cardiometabolic disease risk in Chinese children and adults: consequences of changes in diet, physical activity and obesity." Obesity Reviews 15 (2014): 49-59.
10De Filippo, Carlotta, Duccio Cavalieri, Monica Di Paola, Matteo Ramazzotti, Jean Baptiste Poullet, Sebastien
stratified, multistage, clustered sampling design was used to select the sample within each province or mega-city. The study met the standards for the ethical treatment of participants and was approved by the Institutional Review Boards of the University of North Carolina at Chapel Hill and the National Institute of Health and Nutrition, Chinese Center for Disease Control and Prevention. Subjects gave informed consent for participation. More detailed survey procedures can be found elsewhere.11
In 2015, two subsets of the larger CHNS cohort were selected to provide fecal samples for microbiome sequencing. The first subset was collected at the national level with individuals selected at random from all 12 provinces and 3 mega-cities. The second subset was a saturated sample, targeting provinces with a similar diet and geographic area, specifically southern China, and including individuals from Henan, Hunan, Guangxi, Guizhou. No sampling weights were used.
Variables Primary Variables of Interest
The final analysis dataset consisted of gender, age and anthropometric data from the physical exam in 2015 as well as microbiome data also collected in 2015. The microbiome data was measured at each taxonomic classification – phylum, class, order, family, and genus. Log transformed abundance values were provided for all microbes at each of these five taxonomy levels. Prior to the log transformation, the values were rarefied to correct for the different number of reads in each sample. Additionally, diversity and multidimensional scaling (MDS) variables also measured at each taxonomic classification were included. Waist circumference was measured to the nearest 0.1 cm at midway between the lowest rib and iliac crest using non-elastic tape. Weight was measured to the nearest 0.1 kg in light clothing using calibrated beam scales. Height was measured without shoes to the nearest 0.1 cm using portable stadiometers.
11 Popkin, Barry M., Shufa Du, Fengying Zhai, and Bing Zhang. "Cohort Profile: The China Health and Nutrition
In additional to the variables present in the original dataset, three categorial variables were created for use in the linear models: high waist circumference, overweight by general World Health Organization (WHO) reference, and overweight by WHO reference for Asian populations. Using information from the International Diabetes Federation, high waist circumference was defined as waist circumference greater than or equal to 90 cm in men and greater than or equal to 80 cm in women. Overweight by the general WHO reference was defined as a BMI greater than or equal to 25 and overweight by WHO reference for Asian populations was defined as a BMI greater than or equal to 23.
Table 1. High Waist Circumference1
Waist Circumference Status Male
< 90 cm ≥ 90 cm
Not High Waist Circumference High Waist Circumference Female
< 80 cm ≥ 80 cm
Not High Waist Circumference High Waist Circumference
1International Diabetes Federation
Table 2. Body Mass Index Reference for Overweight Individuals2
Body Mass Index Weight Status General
< 25 ≥ 25
Underweight or Normal Weight Overweight
Asian Population < 23 ≥ 23
Underweight or Normal Weight Overweight
Descriptive statistics were calculated for each of the exposure variables: BMI, waist circumference, body fat percentage, visceral fat score, percentage with high waist circumference, percentage overweight by the general WHO reference, and percentage overweight by the WHO reference for Asian populations. Unadjusted linear models were computed between log normalized abundance variables from the microbiome datasets and each exposure variable. The diversity measurers and the MDS variables were also included in separate linear models. P-values were calculated from these linear models and then were adjusted for false discovery rates and by Bonferroni correction. Final probabilities were reported for the models that had significant probabilities adjusted for false discovery rates (p<=0.1).
Linear models adjusted for age, sex, and province were also computed between log normalized abundance variables from the microbiome datasets and each exposure variable. The diversity measurers and the MDS variables were also included in separate linear models. P-values were calculated for these linear models and then were adjusted for multiple comparisons using false discovery rates. Final probabilities were reported for the models that had significant probabilities adjusted for false discovery rates (p<=0.1).
Results Sample Characteristics
Statistical Analyses
Table 3. Study Population Characteristics
Characteristic N Frequency (%) Mean (SD) Minimum Maximum
Participants [n] 3205
Sex Male Female 3205 48.52 51.48
Age (yrs) 3205 51.69 (12.66) 18.15 80.82
Body Mass Index 3196 24.21 (3.54) 13.66 40.33
Waist Circumference (cm) 3181 84.85 (10.88) 53.00 149.85
Body Fat Percentage 3135 28.47 (8.64) 2.60 59.10
Visceral Fat Score 3133 9.05 (4.83) 1.00 60.00
High Waist Circumference 3181 51.02
Overweight
General WHO reference (BMI ≥ 25) WHO reference for Asian populations (BMI≥ 23)
3196
39.21 61.98
Note: For the figures that follow, “Waist” is waist circumference in centimeters, “Body Fat” is body fat percentage, “Visceral Fat” is visceral fat score, “High Waist” is high waist circumference, “WHO cutpoint” is percentage overweight by the general WHO reference, and “Asian cutpoint” is the percentage overweight by the WHO reference for Asian populations.
Significant Probabilities for Anthropometric outcomes using Unadjusted Models – Phylum
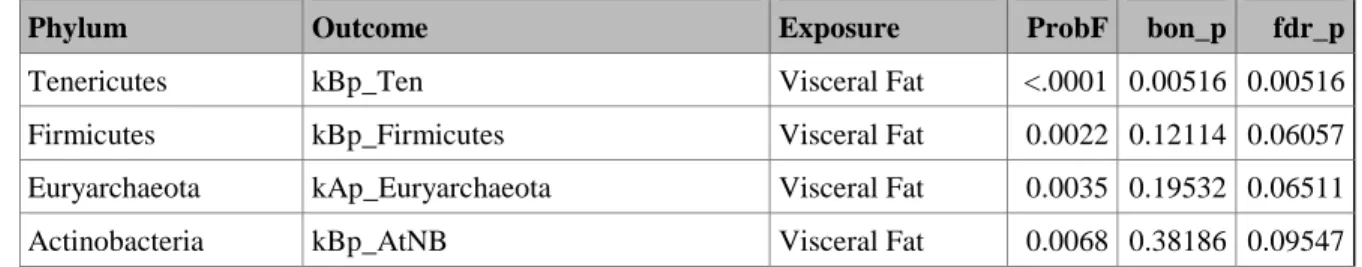
Table P.1. Significant Probabilities for Body Mass Index – Phylum, unadjusted
Phylum Outcome Exposure ProbF bon_p fdr_p
Euryarchaeota kAp_Euryarchaeota Body Mass Index <.0001 0.00552 0.00552
Table P.2. Significant Probabilities for Waist Circumference – Phylum, unadjusted
Phylum Outcome Exposure ProbF bon_p fdr_p
Verrucomicrobia kBp_Ver Waist Cir. <.0001 0.00000 0.00000 Firmicutes kBp_Firmicutes Waist Cir. <.0001 0.00470 0.00235
Table P.3. Significant Probabilities for Visceral Fat Score – Phylum, unadjusted
Phylum Outcome Exposure ProbF bon_p fdr_p
Tenericutes kBp_Ten Visceral Fat <.0001 0.00516 0.00516
Firmicutes kBp_Firmicutes Visceral Fat 0.0022 0.12114 0.06057 Euryarchaeota kAp_Euryarchaeota Visceral Fat 0.0035 0.19532 0.06511 Actinobacteria kBp_AtNB Visceral Fat 0.0068 0.38186 0.09547
Table P.4. Significant Probabilities for Overweight by General WHO Reference – Phylum, unadjusted
Phylum Outcome Exposure ProbF bon_p fdr_p
Euryarchaeota kAp_Euryarchaeota General WHO 0.0018 0.09932 0.09932
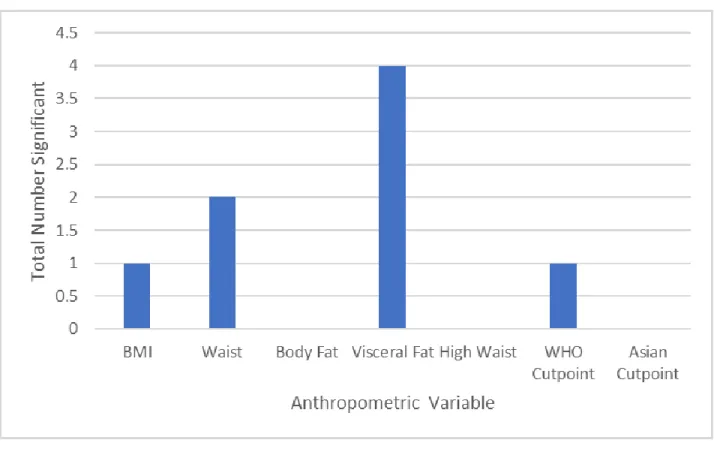
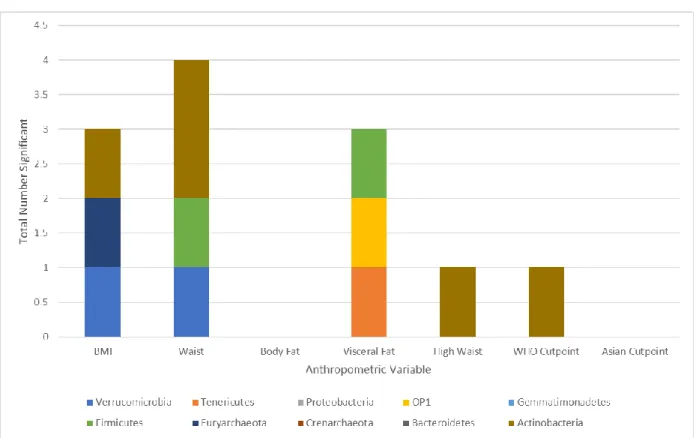
Figure P.1. Total Number of FDR-corrected, statistically significant bacterial phylum, as measured by log abundance, by Anthropometric Variable (Phylum, unadjusted)
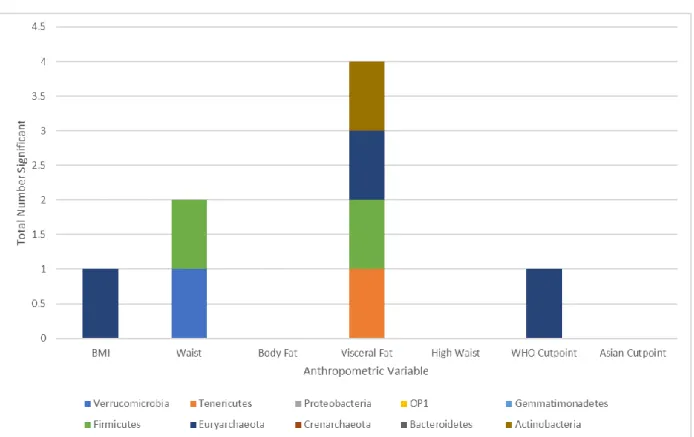
Figure P.2. Percent of Significant Probabilities by Bacteria Phylum Level (Phylum, unadjusted)
Significant Probabilities for Anthropometric outcomes using Unadjusted Models - Class
Tables C.1 through C.5 present the significant probabilities from the unadjusted linear models computed for the class taxonomic classification by each of the exposure variables. 186 models were run for each exposure variable.
Table C.1. Significant Probabilities for Body Mass Index – Class, unadjusted
Phylum Outcome Exposure ProbF bon_p fdr_p
Table C.2. Significant Probabilities for Waist Circumference – Class, unadjusted
Phylum Outcome Exposure ProbF bon_p fdr_p
Actinobacteria kBp_AtNB_c_Cor Waist Cir. <.0001 0.00000 0.00000 Verrucomicrobia kBp_Ver_c_Vere Waist Cir. <.0001 0.00000 0.00000 Firmicutes kBp_Firmc_c_Cl Waist Cir. <.0001 0.00145 0.00048 Actinobacteria kBp_AtNB_c_Rub Waist Cir. 0.0021 0.39193 0.09798
Table C.3. Significant Probabilities for Visceral Fat Score – Class, unadjusted
Phylum Outcome Exposure ProbF bon_p fdr_p
OP1 kBp_OP1_c_MSBL Visceral Fat <.0001 0.00035 0.00035
Tenericutes kBp_Ten_c_Mlc Visceral Fat <.0001 0.01659 0.00829 Firmicutes kBp_Firmc_c_Cl Visceral Fat 0.0004 0.06666 0.02222
Table C.4. Significant Probabilities for High Waist Circumference – Class, unadjusted
Phylum Outcome Exposure ProbF bon_p fdr_p
Actinobacteria kBp_AtNB_c_Cor High Waist Cir. <.0001 0.00192 0.00192
Table C.5. Significant Probabilities for Overweight by General WHO Reference – Class, unadjusted
Phylum Outcome Exposure ProbF bon_p fdr_p
Actinobacteria kBp_AtNB_c_Cor General WHO 0.0002 0.04384 0.04384
Figure C.1. Total Number of FDR-corrected, statistically significant bacterial classes, as measured by log abundance, by Anthropometric Variable (Class, unadjusted)
Figure C.2. Percent of Significant Probabilities by Bacteria Phylum Level (Class, unadjusted)
Significant Probabilities for Anthropometric outcomes using Unadjusted Models – Order
Tables O.1 through O.6 present the significant probabilities from the unadjusted linear models computed for the order taxonomic classification by each of the exposure variables. 387 models were run for each exposure variable.
Table O.1. Significant Probabilities for Body Mass Index – Order, unadjusted
Phylum Outcome Exposure ProbF bon_p fdr_p
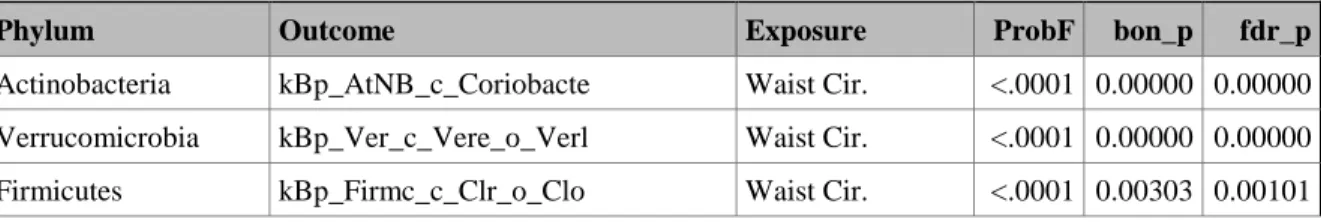
Table O.2. Significant Probabilities for Waist Circumference – Order, unadjusted
Phylum Outcome Exposure ProbF bon_p fdr_p
Actinobacteria kBp_AtNB_c_Coriobacte Waist Cir. <.0001 0.00000 0.00000 Verrucomicrobia kBp_Ver_c_Vere_o_Verl Waist Cir. <.0001 0.00000 0.00000 Firmicutes kBp_Firmc_c_Clr_o_Clo Waist Cir. <.0001 0.00303 0.00101
Table O.3. Significant Probabilities for Body Fat Percentage– Order, unadjusted
Phylum Outcome Exposure ProbF bon_p fdr_p
Actinobacteria kBp_AtNB_c_AtNB_o_AtN Body Fat <.0001 0.00030 0.00030
Table O.4. Significant Probabilities for Visceral Fat Score – Order, unadjusted
Phylum Outcome Exposure ProbF bon_p fdr_p
Crenarchaeota kAp_Cre_c_Thau_o_AK31 Visceral Fat <.0001 0.00002 0.00002 OP1 kBp_OP1_c_MSBL6_o_ Visceral Fat <.0001 0.00073 0.00036 Tenericutes kBp_Ten_c_Mlc_o_RF39 Visceral Fat <.0001 0.03721 0.01240 Gemmatimonadetes kBp_Gem_c_Gem_o_KD8_8 Visceral Fat .0003 0.11120 0.02780 Firmicutes kBp_Firmc_c_Clr_o_Clo Visceral Fat .0004 0.13934 0.02787
Table O.5. Significant Probabilities for High Waist Circumference – Order, unadjusted
Phylum Outcome Exposure ProbF bon_p fdr_p
Actinobacteria kBp_AtNB_c_Coriobacte High Waist Cir. <.0001 0.00401 0.00401 Actinobacteria kBp_AtNB_c_AtNB_o_AtN High Waist Cir. 0.0003 0.11349 0.05674
Table O.6. Significant Probabilities for Overweight by General WHO Reference – Order, unadjusted
Phylum Outcome Exposure ProbF bon_p fdr_p
Actinobacteria kBp_AtNB_c_Coriobacte General WHO 0.0002 0.09146 0.09146
Figure O.1. Total Number of FDR-corrected, statistically significant bacterial orders, as measured by log abundance, by Anthropometric Variable (Order, unadjusted)
Figure O.2. Percent of Significant Probabilities by Bacteria Phylum Level (Order, unadjusted)
Significant Probabilities for Anthropometric outcomes using Unadjusted Models – Family
Tables F.1 through F.7 present the significant probabilities from the unadjusted linear models computed for the family taxonomic classification by each of the exposure variables. 683 models were run for each exposure variable.
Table F.1. Significant Probabilities for Body Mass Index – Family, unadjusted
Phylum Outcome Exposure ProbF bon_p fdr_p
Table F.2. Significant Probabilities for Waist Circumference – Family, unadjusted
Phylum Outcome Exposure ProbF bon_p fdr_p
Actinobacteria kBp_AtNB_c_CoriB_of Waist Cir. <.0001 0.00000 0.00000 Firmicutes kBp_Firmc_c_Clos_of_Pepc Waist Cir. <.0001 0.00000 0.00000 Firmicutes kBp_Firmc_c_Clos_of_Eub Waist Cir. <.0001 0.00000 0.00000 Verrucomicrobia kBp_Ver_c_Vere_o_Verles_ Waist Cir. <.0001 0.00000 0.00000 Firmicutes kBp_Firmc_c_Clos_of_Lac Waist Cir. <.0001 0.00064 0.00013 Proteobacteria kBp_PBc_Ao_RhiBf_Aur Waist Cir. 0.0005 0.31385 0.05231 Firmicutes kBp_Firmc_c_Clos_of Waist Cir. 0.0010 0.67825 0.09689
Table F.3. Significant Probabilities for Body Fat Percentage– Family, unadjusted
Phylum Outcome Exposure ProbF bon_p fdr_p
Actinobacteria kBp_AtNB_c_AtNB_o_AtNMl_ Body Fat <.0001 0.00000 0.00000 Firmicutes kBp_Firmc_c_Clos_of_Pepc Body Fat <.0001 0.01518 0.00506 Firmicutes kBp_Firmc_c_Clos_of_Peps Body Fat <.0001 0.01431 0.00506 Firmicutes kBp_Firmc_c_Clos_of_Eub Body Fat 0.0003 0.19309 0.04827
Table F.4. Significant Probabilities for Visceral Fat Score – Family, unadjusted
Phylum Outcome Exposure ProbF bon_p fdr_p
Table F.5. Significant Probabilities for High Waist Circumference – Family, unadjusted
Phylum Outcome Exposure ProbF bon_p fdr_p
Firmicutes kBp_Firmc_c_Clos_of_Eub High Waist Cir. <.0001 0.00102 0.00102 Actinobacteria kBp_AtNB_c_CoriB_of High Waist Cir. <.0001 0.00709 0.00268 Firmicutes kBp_Firmc_c_Clos_of_Pepc High Waist Cir. <.0001 0.00803 0.00268 Actinobacteria kBp_AtNB_c_AtNB_o_AtNMl_ High Waist Cir. <.0001 0.01534 0.00384 Firmicutes kBp_Firmc_c_Clos_of_Vei High Waist Cir. 0.0004 0.27611 0.05522
Table F.6. Significant Probabilities for Overweight by General WHO Reference – Family, unadjusted
Phylum Outcome Exposure ProbF bon_p fdr_p
Firmicutes kBp_Firmc_c_Clos_of_Eub General WHO <.0001 0.00243 0.00243 Firmicutes kBp_Firmc_c_Clos_of_Pepc General WHO 0.0001 0.07897 0.03948 Actinobacteria kBp_AtNB_c_AtNB_o_AtNMl_ General WHO 0.0003 0.19331 0.04833 Actinobacteria kBp_AtNB_c_CoriB_of General WHO 0.0002 0.16160 0.04833
Table F.7. Significant Probabilities for Overweight by WHO Reference for Asian Populations – Family, unadjusted
Phylum Outcome Exposure ProbF bon_p fdr_p
Firmicutes kBp_Firmc_c_Clos_of_Pepc Asian WHO <.0001 0.01799 0.01799 Firmicutes kBp_Firmc_c_Clos_of_Eub Asian WHO 0.0002 0.10240 0.05120
Figure F.1. Total Number of FDR-corrected, statistically significant bacterial families, as measured by log abundance, by Anthropometric Variable (Family, unadjusted)
Figure F.2. Percent of Significant Probabilities by Bacteria Phylum Level (Family, unadjusted)
Significant Probabilities for Anthropometric outcomes using Unadjusted Models – Genus
Table G.1. Significant Probabilities for Body Mass Index – Genus, unadjusted
Phylum Outcome Exposure ProbF bon_p fdr_p
Table G.2. Significant Probabilities for Waist Circumference – Genus, unadjusted
Phylum Outcome Exposure ProbF bon_p fdr_p
Actinobacteria kBp_AtNB_c_CoriB_of_g_Egg Waist Cir. <.0001 0.00000 0.00000 Actinobacteria kBp_AtNB_c_CoriB_of_g_Adl Waist Cir. <.0001 0.00000 0.00000 Firmicutes kBp_Firmc_c_Clos_of_Pepc_ Waist Cir. <.0001 0.00000 0.00000 Verrucomicrobia kBp_Ver_c_Vere_o_Verles_f Waist Cir. <.0001 0.00000 0.00000 Firmicutes kBp_Firmc_c_Clos_of_Eub_g Waist Cir. <.0001 0.00000 0.00000 Firmicutes kBp_Firmc_c_Clos_of_Lac_g Waist Cir. <.0001 0.00013 0.00002 Actinobacteria kBp_AtNB_c_CoriB_of_g_ Waist Cir. <.0001 0.00021 0.00003 Firmicutes kBp_Firmc_c_Clos_of_Rum_g Waist Cir. <.0001 0.00108 0.00011 Firmicutes kBp_Firmc_c_Clos_of_Vei_g Waist Cir. <.0001 0.00109 0.00011 Firmicutes kBp_Firmc_c_Erys_of_g_Cop Waist Cir. <.0001 0.00101 0.00011 Firmicutes kBp_Firmc_c_Clos_of_Lac_g Waist Cir. <.0001 0.01071 0.00097 Firmicutes kBp_Firmc_c_Clos_of_Lac_g Waist Cir. <.0001 0.01865 0.00155 Firmicutes kBp_Firmc_c_Clos_of_Rum_g Waist Cir. <.0001 0.06680 0.00514 Proteobacteria kBp_PBc_Ao_RhiBf_Aur_g_ Waist Cir. <.0001 0.07450 0.00532 Firmicutes kBp_Firmc_c_Clos_of_Eub_g Waist Cir. 0.0001 0.15331 0.01022 Firmicutes kBp_Firmc_c_Erys_of_g_Hol Waist Cir. 0.0001 0.19179 0.01199 Firmicutes kBp_Firmc_c_Clos_ofg_ Waist Cir. 0.0009 1.00000 0.07403 Proteobacteria kBp_PBc_Ao_Xanl_f_Xans_g_ Waist Cir. 0.0009 1.00000 0.07403 Acidobacteria kBp_AdBc_AdBo_AdBlf_AdBcg Waist Cir. 0.0012 1.00000 0.09064
Table G.3. Significant Probabilities for Body Fat Percentage – Genus, unadjusted
Phylum Outcome Exposure ProbF bon_p fdr_p
Table G.4. Significant Probabilities for Visceral Fat Score – Genus, unadjusted
Phylum Outcome Exposure ProbF bon_p fdr_p
Table G.5. Significant Probabilities for High Waist Circumference – Genus, unadjusted
Phylum Outcome Exposure ProbF bon_p fdr_p
Actinobacteria kBp_AtNB_c_CoriB_of_g_Adl High Waist Cir. <.0001 0.00012 0.00012 Actinobacteria kBp_AtNB_c_CoriB_of_g_Egg High Waist Cir. <.0001 0.00048 0.00024 Firmicutes kBp_Firmc_c_Clos_of_Eub_g High Waist Cir. <.0001 0.00657 0.00219 Firmicutes kBp_Firmc_c_Clos_of_Pepc_ High Waist Cir. <.0001 0.00992 0.00248 Actinobacteria kBp_AtNB_c_AtNB_o_AtNMl_f High Waist Cir. <.0001 0.02702 0.00540 Firmicutes kBp_Firmc_c_Erys_of_g_Cop High Waist Cir. <.0001 0.03669 0.00611 Firmicutes kBp_Firmc_c_Erys_of_g_cc_ High Waist Cir. <.0001 0.07970 0.01139 Proteobacteria kBp_PBc_Ao_Past_f_Pasteur High Waist Cir. 0.0002 0.24696 0.03087 Firmicutes kBp_Firmc_c_Clos_of_Rum_g High Waist Cir. 0.0006 0.88922 0.09880
Table G.6. Significant Probabilities for Overweight by General WHO Reference – Genus, unadjusted
Phylum Outcome Exposure ProbF bon_p fdr_p
Actinobacteria kBp_AtNB_c_CoriB_of_g_Egg General WHO <.0001 0.00005 0.00005 Firmicutes kBp_Firmc_c_Clos_of_Eub_g General WHO <.0001 0.02833 0.01417 Euryarchaeota kAp_Eur_c_MethB_of_g_MetS General WHO <.0001 0.14291 0.04471 Actinobacteria kBp_AtNB_c_AtNB_o_AtNMl_f General WHO 0.0002 0.27303 0.04471 Actinobacteria kBp_AtNB_c_CoriB_of_g_ General WHO 0.0002 0.31296 0.04471 Actinobacteria kBp_AtNB_c_CoriB_of_g_Adl General WHO 0.0002 0.26280 0.04471 Firmicutes kBp_Firmc_c_Clos_of_Pepc_ General WHO 0.0002 0.26183 0.04471 Firmicutes kBp_Firmc_c_Erys_of_g_Cop General WHO 0.0003 0.36237 0.04530 Firmicutes kBp_Firmc_c_Clos_of_Lac_g General WHO 0.0004 0.50784 0.05643
Table G.7. Significant Probabilities for Overweight by WHO Reference for Asian Populations – Genus, unadjusted
Phylum Outcome Exposure ProbF bon_p fdr_p
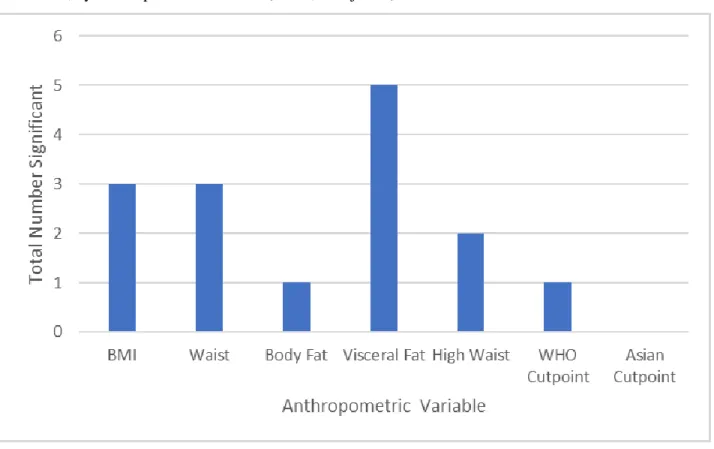
Figure G.1 shows the total number of significant probabilities by anthropometric variable. Of the data, genus has the highest total number significant across all the taxonomic classifications. Visceral fat score has the highest number of significant probabilities followed closely by waist circumference and body mass index. Percentage overweight by WHO guidelines for Asian populations has the lowest number of significant probabilities.
Figure G.1. Total Number of FDR-corrected, statistically significant bacterial genus, as measured by log abundance, by Anthropometric Variable (Genus, unadjusted)
Figure G.2.
Percent of Significant Probabilities by Bacteria Phylum Level (Genus, unadjusted)
Significant Probabilities for Anthropometric outcomes using Unadjusted Models – Diversity Measures
Of the 84 unadjusted linear regressions computed for the diversity measures, none were statistically significant.
Significant Probabilities for Anthropometric outcomes using Unadjusted Models – MDS Measures
Table M.1 presents the significant probabilities from the 210 unadjusted linear models computed for the MDS measures.
Table M.1. Significant Probabilities for MDS Measures, unadjusted
Outcome Exposure ProbF bon_p fdr_p
Outcome Exposure ProbF bon_p fdr_p MDS3_phylu Visceral Fat <.0001 0.00312 0.00052 MDS4_famil Waist Cir. <.0001 0.00885 0.00111 MDS3_famil High Waist Cir. <.0001 0.00822 0.00111 MDS3_genus High Waist Cir. <.0001 0.01066 0.00118 MDS3_famil Waist Cir. <.0001 0.01371 0.00137 MDS3_class General WHO <.0001 0.02056 0.00187 MDS4_famil High Waist Cir. 0.0001 0.02788 0.00232
MDS4_famil Asian WHO 0.0004 0.08622 0.00663
MDS3_class Body Mass Index 0.0005 0.11486 0.00793
MDS3_class Asian WHO 0.0006 0.11896 0.00793
MDS1_phylu Waist Cir. 0.0012 0.24897 0.01556
MDS3_phylu Waist Cir. 0.0014 0.30371 0.01787
MDS4_genus Body Mass Index 0.0018 0.37110 0.01953
MDS4_famil General WHO 0.0017 0.36256 0.01953
MDS3_phylu Body Mass Index 0.0022 0.45761 0.02288
MDS3_order Waist Cir. 0.0025 0.53388 0.02542
MDS4_genus Body Fat 0.0030 0.63730 0.02897
MDS2_phylu High Waist Cir. 0.0041 0.85580 0.03721
MDS5_phylu Waist Cir. 0.0046 0.96538 0.03862
MDS4_genus General WHO 0.0045 0.93797 0.03862
MDS4_genus Asian WHO 0.0062 1.00000 0.05043
MDS6_class Waist Cir. 0.0068 1.00000 0.05251
MDS5_class Body Mass Index 0.0090 1.00000 0.05740
MDS4_class Waist Cir. 0.0089 1.00000 0.05740
MDS4_class Visceral Fat 0.0089 1.00000 0.05740
MDS6_genus Visceral Fat 0.0082 1.00000 0.05740
MDS3_phylu General WHO 0.0077 1.00000 0.05740
MDS5_order Asian WHO 0.0080 1.00000 0.05740
MDS3_famil Body Fat 0.0098 1.00000 0.05895
MDS4_genus High Waist Cir. 0.0095 1.00000 0.05895
MDS1_genus Waist Cir. 0.0114 1.00000 0.06450
MDS4_phylu Waist Cir. 0.0111 1.00000 0.06450
MDS5_class High Waist Cir. 0.0124 1.00000 0.06852 MDS3_order Body Mass Index 0.0137 1.00000 0.07351
Outcome Exposure ProbF bon_p fdr_p MDS3_famil Body Mass Index 0.0188 1.00000 0.09612
Significant Probabilities for Anthropometric outcomes using Adjusted Models – Phylum
Tables P.1.1 through P.5.1 present the significant probabilities from the adjusted linear models computed for the phylum taxonomic classification by each of the exposure variables. The models were adjusted for age, sex, and province. 57 models were run for each exposure variable.
Table P.1.1. Significant Probabilities for Body Mass Index – Phylum, adjusted
Phylum Outcome Exposure ProbF bon_p fdr_p
Euryarchaeota kAp_Euryarchaeota Body Mass Index 0.0011 0.05925 0.02963
Tenericutes kBp_Ten Body Mass Index 0.0011 0.05900 0.02963
Verrucomicrobia kBp_Ver Body Mass Index 0.0026 0.14301 0.04767
Table P.2.1. Significant Probabilities for Waist Circumference – Phylum, adjusted
Phylum Outcome Exposure ProbF bon_p fdr_p
Verrucomicrobia kBp_Ver Waist Cir. <.0001 0.00003 0.00003
Tenericutes kBp_Ten Waist Cir. 0.0031 0.17497 0.08748
Table P.3.1. Significant Probabilities for Body Fat Percentage– Phylum, adjusted
Phylum Outcome Exposure ProbF bon_p fdr_p
Tenericutes kBp_Ten Body Fat 0.0006 0.03379 0.03379
Table P.4.1. Significant Probabilities for Visceral Fat Score – Phylum, adjusted
Phylum Outcome Exposure ProbF bon_p fdr_p
Euryarchaeota kAp_Euryarchaeota Visceral Fat 0.0028 0.15767 0.07883
Table P.5.1. Significant Probabilities for High Waist Circumference – Phylum, adjusted
Phylum Outcome Exposure ProbF bon_p fdr_p
Verrucomicrobia kBp_Ver High Waist Cir. 0.0012 0.06454 0.06454
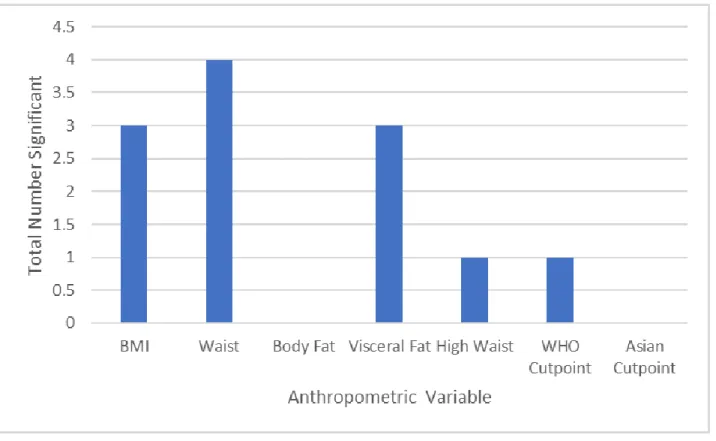
Figure P.1.1 shows the total number of significant probabilities by anthropometric variable. Body mass index has the highest number of significant probabilities. Overweight by general WHO reference and overweight by WHO reference for Asian populations each had no significant probabilities.
Figure P.1.1. Total Number of FDR-corrected, statistically significant bacterial phylum, as measured by log abundance, by Anthropometric Variable (Phylum, adjusted)
Figure P.2.1. Percent of Significant Probabilities by Bacteria Phylum Level (Phylum, adjusted)
Significant Probabilities for Anthropometric outcomes using Adjusted Models – Class
Tables C.1.1 through C.3.1 present the significant probabilities from the adjusted linear models computed for the class taxonomic classification by each of the exposure variables. The models were adjusted for age, sex, and province. 186 models were run for each exposure variable.
Table C.1.1. Significant Probabilities for Waist Circumference – Class, adjusted
Phylum Outcome Exposure ProbF bon_p fdr_p
Verrucomicrobia kBp_Ver_c_Vere Waist Cir. <.0001 0.00007 0.00007
Table C.2.1. Significant Probabilities for Body Fat Percentage– Class, adjusted
Phylum Outcome Exposure ProbF bon_p fdr_p
Table C.3.1. Significant Probabilities for Visceral Fat Score – Class, adjusted
Phylum Outcome Exposure ProbF bon_p fdr_p
OP1 kBp_OP1_c_MSBL Visceral Fat <.0001 0.00001 0.00001
Figure C.1.1 shows the total number of significant probabilities by anthropometric variable. Body mass index, high waist circumference, overweight by general WHO reference, and overweight by WHO reference for Asian populations each had no significant probabilities.
Figure C.1.1. Total Number of FDR-corrected, statistically significant bacterial classes, as measured by log abundance, by Anthropometric Variable (Class, adjusted)
Figure C.2.1. Percent of Significant Probabilities by Bacteria Phylum Level (Class, adjusted)
Significant Probabilities for Anthropometric outcomes using Adjusted Models – Order
Tables O.1.1 and O.2.1 present the significant probabilities from the adjusted linear models computed for the order taxonomic classification by each of the exposure variables. The models were adjusted for age, sex, and province. 387 models were run for each exposure variable.
Table O.1.1. Significant Probabilities for Waist Circumference – Order, adjusted
Phylum Outcome Exposure ProbF bon_p fdr_p
Verrucomicrobia kBp_Ver_c_Vere_o_Verl Waist Cir. <.0001 0.00011 0.00011
Table O.2.1 Significant Probabilities for Visceral Fat Score – Order, adjusted
Phylum Outcome Exposure ProbF bon_p fdr_p
Figure O.1.1 shows the total number of significant probabilities by anthropometric variable. Visceral fat score has the highest number of significant probabilities. Body mass index, body fat percentage, high waist circumference, overweight by general WHO reference, and overweight by WHO reference for Asian populations each had no significant probabilities.
Figure O.1.1. Total Number of FDR-corrected, statistically significant bacterial orders, as measured by log abundance, by Anthropometric Variable (Order, adjusted)
Figure O.2.1. Percent of Significant Probabilities by Bacteria Phylum Level (Order, adjusted)
Significant Probabilities for Anthropometric outcomes using Adjusted Models – Family
Tables F.1.1 and F.2.1 present the significant probabilities from the adjusted linear models computed for the family taxonomic classification by each of the exposure variables. The models were adjusted for age, sex, and province. 683 models were run for each exposure variable.
Table F.1.1. Significant Probabilities for Waist Circumference – Family, adjusted
Phylum Outcome Exposure ProbF bon_p fdr_p
Table F.2.1. Significant Probabilities for Visceral Fat Score – Family, adjusted
Phylum Outcome Exposure ProbF bon_p fdr_p
Crenarchaeota kAp_Cre_c_Thau_o_AK31_f_ Visceral Fat <.0001 0.00001 0.00001 OP1 kBp_OP1_c_MSBL6_o_f_ Visceral Fat <.0001 0.00003 0.00002 Gemmatimonadetes kBp_Gem_c_Gem_o_KD8_87_f Visceral Fat 0.0001 0.09308 0.03103 Firmicutes kBp_Firmc_c_Clos_of_Pepc Visceral Fat 0.0005 0.31800 0.07950
Figure F.1.1 shows the total number of significant probabilities by anthropometric variable. Visceral fat score has the highest number of significant probabilities. Body mass index, body fat percentage, high waist circumference, overweight by general WHO reference, and overweight by WHO reference for Asian populations each had no significant probabilities.
Figure F.2.1 illustrates the percentage of significant probabilities by bacteria phylum level. Visceral fat score has significant probabilities split between Crenarchaeota, Firmicutes, Gemmatimonadetes, and OP1.
Figure F.2.1. Percent of Significant Probabilities by Bacteria Phylum Level (Family, adjusted)
Significant Probabilities for Anthropometric outcomes using Adjusted Models – Genus
Tables G.1.1 through G.4.1 present the significant probabilities from the adjusted linear models computed for the genus taxonomic classification by each of the exposure variables. The models were adjusted for age, sex, and province. 1453 models were run for each exposure variable.
Table G.1.1. Significant Probabilities for Body Mass Index – Genus, adjusted
Phylum Outcome Exposure ProbF bon_p fdr_p
Table G.2.1. Significant Probabilities for Waist Circumference – Genus, adjusted
Phylum Outcome Exposure ProbF bon_p fdr_p
Verrucomicrobia kBp_Ver_c_Vere_o_Verles_f Waist Cir. <.0001 0.00057 0.00057
Table G.3.1 Significant Probabilities for Body Fat Percentage– Genus, adjusted
Phylum Outcome Exposure ProbF bon_p fdr_p
Actinobacteria kBp_AtNB_c_CoriB_of_g_ Body Fat <.0001 0.08707 0.08707
Table G.4.1 Significant Probabilities for Visceral Fat Score – Genus, adjusted
Phylum Outcome Exposure ProbF bon_p fdr_p
Crenarchaeota kAp_Cre_c_Thau_o_AK31_fg_ Visceral Fat <.0001 0.00003 0.00003 OP1 kBp_OP1_c_MSBL6_o_fg_ Visceral Fat <.0001 0.00007 0.00003 Firmicutes kBp_Firmc_c_Clos_of_Clo_g Visceral Fat <.0001 0.00011 0.00004 Proteobacteria kBp_PBc_Ao_Chm_f_Halothio Visceral Fat <.0001 0.00028 0.00007 Firmicutes kBp_Firmc_c_BclBPl_of_g_P Visceral Fat <.0001 0.00103 0.00021 Firmicutes kBp_Firmc_c_Clos_of_Pepc_ Visceral Fat <.0001 0.02644 0.00441 Gemmatimonadetes kBp_Gem_c_Gem_o_KD8_87_fg Visceral Fat 0.0001 0.19776 0.02825 Firmicutes kBp_Firmc_c_Clos_of_Pepc_ Visceral Fat 0.0002 0.30766 0.03846
Figure G.1.1. Total Number of FDR-corrected, statistically significant bacterial genus, as measured by log abundance, by Anthropometric Variable (Genus, adjusted)
Figure G.2.1 illustrates the percentage of significant probabilities by bacteria phylum level.
Figure G.2.1. Percent of Significant Probabilities by Bacteria Phylum Level (Genus, adjusted)
Significant Probabilities for Anthropometric outcomes using Adjusted Models – Diversity
Measures
Of the 84 adjusted linear regressions computed for the diversity measures, none were
statistically significant.
Significant Probabilities for Anthropometric outcomes using Adjusted Models – MDS Measures
Table M.1.1 presents the significant probabilities from the 210 unadjusted linear models
Table M.1.1. Significant Probabilities for MDS Measures, adjusted
Outcome Exposure ProbF bon_p fdr_p
MDS3_phylum Body Mass Index <.0001 0.00171 0.00171 MDS3_phylum High Waist Cir. <.0001 0.00809 0.00404
MDS4_class Waist Cir. 0.0002 0.04598 0.01150
MDS3_phylum General WHO 0.0002 0.04291 0.01150
MDS3_phylum Waist Cir. 0.0004 0.08778 0.01756
MDS3_phylum Body Fat 0.0006 0.13348 0.01907
MDS4_class High Waist Cir. 0.0006 0.11933 0.01907
MDS6_family Body Fat 0.0009 0.19003 0.02375
MDS3_order Body Mass Index 0.0015 0.32467 0.03140
MDS3_order Waist Cir. 0.0014 0.29205 0.03140
MDS3_phylum Asian WHO 0.0016 0.34539 0.03140
MDS4_phylum Waist Cir. 0.0020 0.42453 0.03538
MDS4_class Body Mass Index 0.0046 0.97458 0.07497
MDS3_order General WHO 0.0064 1.00000 0.09592
Strengths and Limitations
sample of over 3,000 individuals we had adequate statistical power to be able to identity potentially very important associations in a population with high amounts of between person variability. Additionally, even though this was not the focus on this paper, in future research since we were using data from the CHNS we have extensive longitudinal individual, household and community level data which allows to look more into what could be explaining some of the between person variability in addition to age, gender and province.
Conclusion
Works Cited
Adair, Linda S., Penny Gordon‐Larsen, S. F. Du, Bing Zhang, and Barry M. Popkin. "The
emergence of cardiometabolic disease risk in Chinese children and adults: consequences
of changes in diet, physical activity and obesity." Obesity Reviews 15 (2014): 49-59.
Clarke, Siobhan F., Eileen F. Murphy, Kanishka Nilaweera, Paul R. Ross, Fergus Shanahan, Paul
W. O’Toole, and Paul D. Cotter. "The gut microbiota and its relationship to diet and
obesity: new insights." Gut microbes 3, no. 3 (2012): 186-202.
De Filippo, Carlotta, Duccio Cavalieri, Monica Di Paola, Matteo Ramazzotti, Jean Baptiste
Poullet, Sebastien Massart, Silvia Collini, Giuseppe Pieraccini, and Paolo Lionetti. "Impact
of diet in shaping gut microbiota revealed by a comparative study in children from Europe
and rural Africa." Proceedings of the National Academy of Sciences 107, no. 33 (2010):
14691-14696.
Hawkes, Corinna. "Uneven dietary development: linking the policies and processes of
globalization with the nutrition transition, obesity and diet-related chronic
diseases." Globalization and health 2, no. 1 (2006): 4.
James, Philip T. "Obesity: the worldwide epidemic." Clinics in dermatology 22, no. 4 (2004):
276-280.
Ley, Ruth E., Peter J. Turnbaugh, Samuel Klein, and Jeffrey I. Gordon. "Microbial ecology: human
gut microbes associated with obesity." nature 444, no. 7122 (2006): 1022.
Popkin, Barry M. "Synthesis and implications: China's nutrition transition in the context of
changes across other low‐and middle‐income countries." Obesity reviews 15 (2014):
60-67.
Popkin, Barry M., Shufa Du, Fengying Zhai, and Bing Zhang. "Cohort Profile: The China Health
and Nutrition Survey—monitoring and understanding socio-economic and health change
in China, 1989–2011." International journal of epidemiology 39, no. 6 (2009): 1435-1440.
Wang, Y., Jianchun Mi, X. Y. Shan, Qiong J. Wang, and K. Y. Ge. "Is China facing an obesity
epidemic and the consequences? The trends in obesity and chronic disease in
China." International journal of obesity 31, no. 1 (2007): 177.
Appendix
A.1.
SAS Code for Unadjusted Models
%MACRO model(i,outcome,exposure);
/*ods trace on;*/
ods trace off;
ods output ModelANOVA=model; ods listing close;
proc glm data=kgc.all_cat;
/*class ____;*/
model &outcome. = &exposure.; run;
quit;
/*proc print data=model; run;*/
data model&i (keep = Dependent Source ProbF); set model;
/*Keeping only the Type 3 hypothesis test*/
if HypothesisType=3;
run;
%MEND model;
A.2.
SAS Code for Adjusted Models
%MACRO model(i,outcome,exposure);
/*ods trace on;*/
ods trace off;
ods output ModelANOVA=model; ods listing close;
proc glm data=kgc.all_cat; class gender t1;
model &outcome. = &exposure. age gender t1; run;
quit;
proc print data=model; run;
/*proc print data=model; run;*/
data model&i (keep = Dependent Source ProbF); set model;
/*Keeping only the Type 3 hypothesis test*/
if HypothesisType=3 and Source NOT IN ("age", "GENDER", "t1"); run;