United Kingdom ISSN 2348 0386 Vol. VII, Issue 11, November 2019
Licensed under Creative Common Page 437
http://ijecm.co.uk/
EFFECTS OF MARKETING PROCESSES ON SMALL SCALE
COFFEE PRODUCTION IN KANGUNDO SUB-COUNTY,
MACHAKOS COUNTY, KENYA
Francis Mutethya Kaula
School of Business and Economics, Machakos University, Machakos, Kenya [email protected]
Robert Arasa
School of Business and Economics, Machakos University, Machakos, Kenya [email protected]
Susan Nzioki
School of Business and Economics, Machakos University, Machakos, Kenya [email protected]
Abstract
Coffee production in Kenya has continued to suffer negative growth since 1989 with severe
consequences to the coffee economy which is a source of foreign exchange to the country, farm incomes and employment. While coffee production continues to decline in Kenya, production in most of the other coffee growing countries continues to grow. This study adopted descriptive
survey design and was carried out with an aim of exposing the influence of marketing processes on Primary source included use of questionnaires. The target population was 11,348
smallholder coffee farmers who are spread in 6 coffee cooperative societies in Kangundo Sub-county. The study surveyed all the 6 societies in Kangundo Sub-Sub-county. Two factors were
sampled through simple random technique. The study employed Krejcie and Morgan (1970) sample size table to determine the appropriate sample of coffee farmers to be included in the
Licensed under Creative Common Page 438
the help of a translator. Data analysis was both qualitative and quantitative using descriptive statistics. The study findings show that there are several marketing factors that discourage farmers from coffee farming such as poor management of coffee societies, societies’ debts,
non-provision of timely marketing information, presence of middlemen and delays in coffee
payment after the auction. To revitalize the declining coffee industry, this paper recommends to the government of Kenya to consider amending the Crops Act (2013) to allow for different
marketing channels on top of the cooperative system.
Keywords: Small scale, Coffee Production, Marketing Processes, Cooperative Societies, Smallholder Farmer
INTRODUCTION
There are two primary types of coffee, Arabica and Robusta. While Arabica coffee was first discovered in the Province of Kaffa in Ethiopia, the origin of Robusta coffee is traced in the islands of Lake Victoria and in the North of Kagera, Tanzania (Kegode, 2005; Murthy, Waller, Bigger & Hillocks, 2007). Today, coffee is grown in more than 60 countries most of which are developing countries but, in contrast, its consumption is largely in developed countries (Thong, 2018). It is the second traded commodity and first agricultural traded commodity in the world, after oil, with an estimated value of over 80 billion US dollars annually. The global coffee economy is important to the livelihood of 25 million small scale producers and over 125 million people who directly or indirectly depend on coffee (Karanja & Nyoro, 2002). This is because coffee cultivation is mainly carried out by smallholder farmers.
Due to its global status, as world’s most traded agricultural commodity, there was consensus among exporting and importing countries to put in place a mechanism to regulate coffee trade at the international level. As a result, the International Coffee Agreement (ICA) was formed in 1962 by coffee exporting and importing countries. The main objective of ICA was to regulate global coffee trade through systems of export controls (quotas) so as to control supply and thus maintain relatively higher producer prices. The ICA collapsed in 1989 due to lack of consensus between and among consumer and producer countries (ICO, 2014). Therefore, world coffee economy can be seen to have evolved from two periods; the regulated period (1963-1989) and the unregulated period (1990 to date).
Licensed under Creative Common Page 439 higher rate during the period the ICA agreement was in force than the free market period. The ICO (2014) report reveals that global coffee production has grown from 47 million bags in 1963 to 145.1 million bags in crop year 2012/2013. However, the report notes that production in Africa as whole has experienced negative growth in the free market period, from an average volume of 19.1 million bags in the regulated period to 15.8 million under the free market. Although some African countries have experienced negative production, research has shown that there are few countries such as Ethiopia, Uganda and Madagascar that have been able to maintain positive production growth in the free market period.
In Kenya, coffee was introduced by missionaries in Kiambu, then Bura, in 1983 (Chemiat, 2014). Before independence, production was concentrated in a small number of estates, and it was illegal for Kenyans to cultivate coffee, except for small trial areas in Meru and Kisii districts. It was until after independence that Africans were free to cultivate coffee. Kenya grows mainly Arabica coffee and production is two levels comprising of 65% cooperative societies and 35% estate (Bichanga & Kabaka, 2013). There are 700,000 smallholder coffee farmers who market their produce through cooperative societies (Kegode, 2005). This industry employed over 7 million people either directly or indirectly (GoK, 2009).
The policy of government between 1960 and 1970 was to encourage formations of cooperative societies for smallholder farmers (Kegode, 2005). As a result of this policy, between 1970 and 1980, cooperative societies registered a major boom as a result of crop failure in Brazil. Within this period, farmers expanded their coffee production. Relatively higher global prices prevailing during the period the ICA was in force seems to have motivated coffee production in Kenya. For instance, in 1963, coffee production stood at 43,778 tons but rose to 130,000 tons in 1988 (Minai, Nyairo, Mbataru, 2014). Since then, production has declined to 50,000 tons in 2011/2012 crop year (CBK, 2012). Until 1988, coffee constituted over 40 per cent of Kenya’s total export; but this value dropped to 9 per cent by 1992 and to 3 per cent in 2010
(Mureithi, 2008; Wangari, 2014). Given that there are a number of developing countries experiencing positive coffee production, it means some countries have unique competitive advantages that motivate coffee production. This papers seeks to expose the contribution of marketing processes on small scale coffee production in Kenya.
Since early 1990’s, the liberalization of the Kenya coffee sector has fundamentally altered
Licensed under Creative Common Page 440 April 2002, a new Coffee Act came into force that separated roles of regulation and marketing with CBK reduced to a regulator. On one hand, the reforms have reduced milling and marketing costs while on the other hand, problems of corruption, political opportunism and mismanagement have been reported to rise across all institutions in the coffee sector, especially in coffee cooperatives (Karanja & Nyoro, 2002; Mude, 2007; Kuguru, 2016).
Smallholders are legally bound to deliver their coffee cherries to cooperatively owned factories for primary processing (Ministry of Agriculture, 2010). The cooperatives are managed by a committee elected by farmers. The cooperatives also provide inputs as well as education and extension services to their members. The coffee produce at each cooperative is pooled together so that each farmer’s contribution is not discernible from the others. In order to
calculate final proceeds to farmers, the cooperative management deducts all of its operating costs, including maintenance and service expenses, loan repayments and salaries from revenue received from coffee sales.
The graded beans are subsequently passed on to the marketing agents who market them for auction at the Nairobi Coffee Exchange (NCE). The law requires dealers and exporters who buy the coffee at the NCE to pay the marketing agents within seven days. After receiving the proceeds, the marketing agents then subtract the appropriate fees for marketing expenses and statutory deductions and then pay the growers. Research has shown that the marketing agents have no incentive to promote the price received by the cooperatives since they receive a captive fee of US$50 per ton. Kuguru (2016), for instance, argues that the marketing costs should be pegged on the prices fetched at the auction.
Although grower cooperatives are supposed to pay famers within the shortest time possible after receiving coffee proceeds from marketers, Monroy, Mulinge and Witwer (2013) disclose that passing the proceeds back to the grower can take a considerable amount of time once payments are made to the bank representing the cooperative. To overcome this challenge, Mureithi (2008) recommends that farmers should insist that they be paid within two weeks of sale by a marketing agent. On behalf of smallholder farmers, cooperatives make decisions such as when to mill, where to mill, who to market the coffee on behalf of the farmers.
Licensed under Creative Common Page 441 Access to marketing information may play a significant role in coffee production. However, Kegode (2005) notes that smallholder farmers in Kenya have limited control over their produce and once it passes through the farm gate, they have no knowledge of the grade it will be assigned, of the amount they will be paid or of when that payment will be made. On a similar note, Mutua and Kioko (2016) emphasize that provision of market information may motivate farmers to produce more and better quality coffee that can fetch premium prices.
Another marketing disincentive to coffee production is the high number of middlemen along the value chain. According to a report cited by Kegode (2005), it is only 58 per cent of the free-on-board (FOB) export price of coffee that reaches the grower and that 42 per cent is taken up by local intermediaries by way of transport, insurance, warehousing and shipping: exporters/dealers (10 per cent), levies/cesses (4 per cent), marketing agents (4 per cent), millers (6 per cent) and primary processing/cooperative/factory (18 per cent). From the foregoing, it can be seen that a huge chunk of farmers’ coffee proceeds is chained by the presence of many tax collector and this significantly impact on the farmers’ morale.
Coffee production in Kangundo Sub-county is mainly through smallholder farmers who market their coffee through six (6) coffee co-operative societies. The sub-county lie at latitudes lower than 10° and altitudes of 3600-6300 feet with frequent rainfall that causes almost continuous flowering of coffee, which results in two harvesting seasons (Mutua & Kioko, 2016). Information provided by the Kangundo Sub-county Co-operative Development Office (2018) indicates that coffee production in Kangundo has fallen from a peak of 12,708,126 kilograms in 1989 to an average of 3,260,685 kilograms for the period 2012 – 2017. Between years 2000 and 2016, a lot of acres have been uprooted or destroyed to create room for more competitive agricultural enterprises. The average cherry production per tree per year is 1.77 kilograms against the national average of 3 kilograms per tree.
RESEARCH QUESTION
To what extent do marketing factors influence small scale coffee production in Kangundo Sub-county?
THEORETICAL FRAMEWORK
The Marketing Mix
Licensed under Creative Common Page 442 successfully employ the model, McCarthy believes that the target market’s needs and wants have to be understood.
Product focuses on what is offered to customers. The framework is premised on the belief that the product should be tailored in a way it meets consumers’ expectations in terms of:
task consumers want it for; it should work; and it should be what the consumers are expecting to get. In coffee production, there are various grades that can be produced at the farm. Some grades are superior high quality and fetch good prices while others are of low quality and fetch very low prices. For the case of a smallholder coffee farmer, the farmer can innovate and ensure s/he produces high volume of high quality coffee that is highly sought at the market while ensuring that s/he produces low volumes of low quality coffee. This can be achieved through adopting the best practices of crop husbandry practices.
Place, which is a component of the marketing mix, determines the venues at which customers can access the products. The framework stipulates that the product should be available from where the target consumer finds it easiest to shop. All the coffee produced in Kenya is sold through the Nairobi Coffee Exchange (NCE) or to foreign countries through direct sales. In Kenya, small scale coffee farmers are legally bound to sell their coffee through the cooperative society system. However, farmers who meet some requirements of minimum acreage can still be licensed as small estates and pulp their coffee and privately organize for milling and marketing of their coffee.
The framework proposes that the price of a product should always be seen to reflect the good value for money. The main assumption of the marketing concept is that customers are willing to pay more for a product that works well for them. To fetch premium prices, coffee farmers can ensure their coffee societies enroll in coffee certification programs because certified coffee usually fetch higher prices. Promotion is the communication strategies used to disseminate information about the product. In coffee production, the government needs to market the Kenyan coffee as a premium product historically grown in best ecological zones and with a unique product to coffee consuming nations.
EMPIRICAL REVIEW
Roshetko (2015) investigated smallholders’ coffee production and marketing in Indonesia. The
Licensed under Creative Common Page 443 packed in different sizes when sold to individual consumers. It can therefore be concluded that smallholder farmers in Indonesia are free to market their produce and this could be the reason why the sector continues to grow.
Asefa, Mulugeta and Hadji (2016) investigated determinants of farmers’ preference to
coffee market outlet in Jimma zone in Ethiopia. Cross-sectional data was collected from 156 randomly selected rural households of three districts. Informal buyers, formal traders, brokers and cooperatives were four main coffee market outlet exist on the study area. The results show that the most frequently used coffee markets include informal buyers, formal coffee traders, brokers and farmer groups/cooperatives. Informal coffee buyers include farm gate buyers and consumers while formal coffee traders include village and urban coffee traders who are licensed and officially known in coffee market chain. It can therefore be concluded that coffee farmers have different marketing channels and this could be responsible for continued growth of the sector in Ethiopia.
Abtew, Leitz, Tamubula and Oyugi (2014) investigated factors influencing coffee marketing strategies among coffee farmers in Ggolo Parish, Uganda. The study aimed to understand the factors leading small coffee farmers to choose between selling their coffee to the rural traders (farm gate) or to the regional dehusking factory available in the Ggolo parish, Mpigi District in Uganda. Data for the survey was generated through semi-structured interviews, cross sectional surveys, participant observation, personal interviews and one focus group discussion. Results show that 58% of the farmers combine both strategies, while 25% sales to rural traders and 16% only sale to the regional factory respectively. From the findings of this study, it can be concluded that farmers in Uganda are free to market their coffee either to rural traders or the regional factory and this could be the reason why farmers continue to increase their production. Nduati (2012) investigated factors influencing service provision by cooperative societies in Kigumo District of Muranga County. The study used descriptive research design and randomized sampling. Primary data was collected by structured questionnaire from 199 coffee farmers and secondary data from management committee were used to provide information on the issues under investigation. The study results showed that farmers’ dissatisfied with
management of their cooperative society did not deliver their coffee to the society. This study investigated whether farmers in Kangundo Sub-county are satisfied with their cooperative societies and how this could be impacting on coffee production.
Licensed under Creative Common Page 444 a primary data collection from the coffee farmers and the coffee cooperative society managers. The study results showed that 67.90% of the respondents agreed and strongly agreed that marketing process played a significant role in the performance of coffee industry. The regression analysis further showed that an increase in 0.162 in marketing process have a corresponding increase of a unit in performance of coffee sector in Kenya. The study suggests that to obtain an efficient working coffee industry a lot should be done as far marketing is concerned. The study concludes that there exist a positive relationship between marketing process and performance of coffee industry in Kenya.
Mutua and Kioko (2016) undertook a study to investigate the contribution of agribusiness support projects on coffee production in Machakos County. The study adopted a descriptive survey design. Convenient and census sampling techniques was used to select 2 districts with 100 respondents out of 320 coffee growers drawn from the management committees from various cooperatives. A questionnaire was used as the instrument of data collection.
The study results showed that farmers enrolled in agribusiness support programs were more advantaged in information access as opposed to farmers not in any of support program. For example, 63.4% of the respondents indicated that they normally get market information on weekly basis compared to 5.4% who get as often as after a month. Almost a third (31.2%) of farmers in non-support programs indicated they obtained market information on yearly basis that can be tied to Annual General Meetings where payment rate is declared according to subsequent sales and cherry deliveries at factory level. From the findings of this study, is clear most cooperatives do not provide farmers with timely information.
Lugando and Omukoko (2017) studied on factors leading to decline of coffee production conducted in Vihiga County reported that poor management of cooperative societies and lack of financial assistance from the government contributed to low coffee production. The requirement that smallholder farmers should only sell their coffee through the cooperatives seems to demotivate production whenever they feel their society is no management well.
Gichichi, Mukulu and Odhiambo (2019) conducted a descriptive study on the influence of market conditions on performance of coffee smallholders’ micro and small agribusinesses in Murang’a County, Kenya. The study findings show that easy access to markets, customers’
Licensed under Creative Common Page 445 RESEARCH METHODOLOGY
This study adopted a descriptive survey research design. Cooper and Schindler (2008), define descriptive survey as being concerned with finding out who, what, where, when and how variables. Descriptive studies not only establish facts but they are also solutions to problems (Kothari & Gaurav, 2014).The target population for the study was all the small scale coffee farmers in Kangundo. According to Kangundo Sub-county cooperative office (2018), there are 11,348 smallholder coffee farmers who market their produce through six cooperative societies. Therefore, the target population was all the 6 cooperative societies and all the 11,348 smallholder farmers.
Sampling Technique
A sample is defined as a smaller group obtained from the accessible population (Mugenda & Mugenda, 2003). The study included two (2) factories from each of the 6 societies in Kangundo Sub-county. Simple random technique was used to select the actual 2 participating factories. The study employed Krejcie and Morgan (1970) sample size table that gives sample sizes for finite population. According to Krejcie and Morgan (1970) table, farmers’ population of 11,348 was matched with a sample size of 370 and was therefore sampled. From each of the participating factors, an equal number of farmers was randomly selected to participate in the study.
Data Collection Tools
Data was collected using vetted and validated questionnaire by research expert. The questionnaires were administered on respondents through face-to face method. The questionnaires consisted of both open ended and closed questions to allow variety and in-depth information.
Analytical Approach
Licensed under Creative Common Page 446 ANALYSIS AND RESULTS
Response Rate
The study sampled 370 smallholder farmers. Out of 370 questionnaires, ten (10) questionnaires were incompletely filled and were not analysed. The response rate was therefore 97.3%. The results are presented in figure 1 below.
Figure 1: Response Rate
According to Mugenda & Mugenda (2003), a response rate of 50% is adequate enough for analysis and reporting while a response rate of more than 60%-69% is considered to be good and that of above 70% is excellent. This study achieved high response rate because farmers were interviewed using a translated questionnaire in Kikamba.
Demographic Information of Respondents
The study investigated farmers’ demographic information. Bio data for farmers was obtained and analyzed. The study sought farmers’ information on demographic profile.
Gender of the Farmers
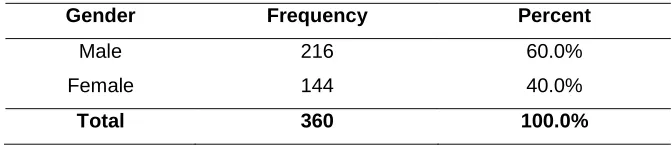
The study collected farmers’ information on their gender. The results are presented in table 1.
Table 1: Gender of Coffee Farmers
Gender Frequency Percent
Male 216 60.0%
Female 144 40.0%
Total 360 100.0%
97.3% 2.7%
Licensed under Creative Common Page 447 The results show that majority (60.0%) of smallholder farmers in Kangundo Sub-county are males while females were slightly lower (40.0%).
Age of Coffee Farmers
The study obtained information on farmers’ age in Kangundo Sub-county. Figure 2 provides the information.
Figure 2: Age of Coffee Farmers
The results show that majority (50.8%) of coffee farmers in Kangundo Sub-county are above 50 years followed by 41 – 50 age bracket at 25.8%. Only few (23.3%) farmers are below 40 years, as represented by 17.5% who are between 31 – 40 bracket and 5.8% who are aged between 21 – 30 years. These findings indicate that either coffee farming in Kangundo Sub-county is
dominated by aged farmers who probably own the coffee farms or youthful farmers are not interested in coffee cultivation.
Farmers’ Level of Education
The study obtained information on the level of education of smallholder farmers in Kangundo Sub-county. Figure 3 provides the information.
Figure 3: Farmers’ Level of Education
5.8% 17.5%
25.8%
50.8% 21 - 30
31 - 40 41 - 50 Above 50
37.2% 41.9%
16.7%
4.2% 0.0%
10.0% 20.0% 30.0% 40.0% 50.0%
Primary
Secondary
College
University
Licensed under Creative Common Page 448 The results show that majority of farmers have attained primary (37.2%) and secondary (41.9%) education while minority have attained college (16.7%) and university (4.2%) qualifications. The findings are indicative that a significant population of Kangundo’s educated population may not be interested in coffee farming.
Land under Coffee
The study probed farmers on their size of land under coffee. Table 2 provides the information.
Table 2: Area under Coffee in Acres
Land Size Frequency Percent
Below 1 175 48.6%
Between 1 to 2 131 36.4%
Between 2 – 4 33 9.2%
5 and above 21 5.8%
Total 360 100.0%
The findings show that nearly half (48.6%) of coffee farms in Kangundo Sub-county are below 1 acre. Slightly more than a third (36.4%) of coffee farms are between 1 to 2 acres. In total, the findings show that majority (85.0%) of coffee farms in Kangundo Sub-county are below 2 acres and thus cannot meet the minimum acreage requirement of 5 acres to be issued with pulping license.
Effect of Marketing Factors on Coffee Production
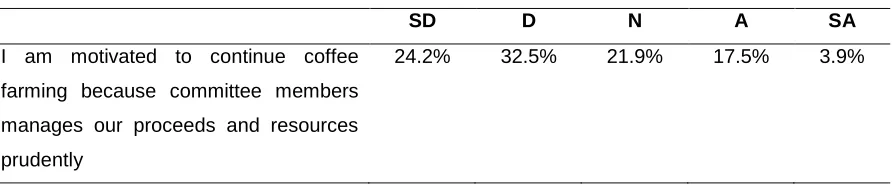
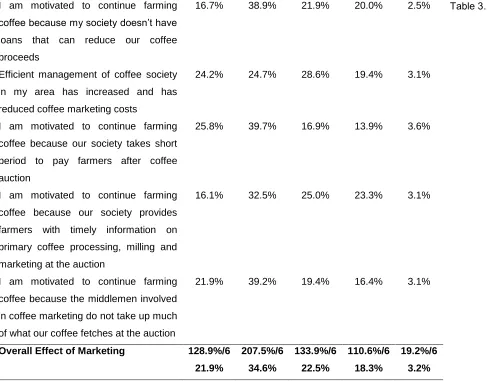
The objective of this study is to investigate the effect of coffee marketing processes on smallholder coffee production in Kangundo Sub-county. To understand how the factors surrounding the marketing of coffee motivate or demotivate farmers into coffee production, farmers were presented with 6 statements to rate using a 5 – item likert scale that included Strongly Disagree, Disagree, Neutral, Agree and Strongly Agree (Table 3).
Table 3: Farmers’ Responses on effect of Marketing Factors on Coffee Production
SD D N A SA
I am motivated to continue coffee farming because committee members manages our proceeds and resources prudently
Licensed under Creative Common Page 449 I am motivated to continue farming
coffee because my society doesn’t have loans that can reduce our coffee proceeds
16.7% 38.9% 21.9% 20.0% 2.5%
Efficient management of coffee society in my area has increased and has reduced coffee marketing costs
24.2% 24.7% 28.6% 19.4% 3.1%
I am motivated to continue farming coffee because our society takes short period to pay farmers after coffee auction
25.8% 39.7% 16.9% 13.9% 3.6%
I am motivated to continue farming coffee because our society provides farmers with timely information on primary coffee processing, milling and marketing at the auction
16.1% 32.5% 25.0% 23.3% 3.1%
I am motivated to continue farming coffee because the middlemen involved in coffee marketing do not take up much of what our coffee fetches at the auction
21.9% 39.2% 19.4% 16.4% 3.1%
Overall Effect of Marketing 128.9%/6
21.9%
207.5%/6
34.6%
133.9%/6
22.5%
110.6%/6
18.3%
19.2%/6
3.2%
Results show that majority 59.7% of coffee farmers are demotivated by poor management of their coffee societies, as was affirmed by 24.2% who strongly disagreed and 32.5% who disagreed to the statement that their committee members manages coffee proceeds and resources prudently. Similarly, majority 56.6% also indicated that they are discouraged from coffee production because their societies are highly indebted as indicated by 16.7% who strongly disagreed and 39.9% who disagreed that their societies do not have loans that can reduce their net proceeds. Slightly less than half (48.9%) of farmers, as was affirmed by 24.2% who strongly disagreed and 24.7% who disagreed, indicated that the management of their societies is not efficient so as to reduce their coffee marketing costs. Majority (65.5%) of farmers indicated that their coffee societies takes long to pay them long after auction, as indicated by 25.8% who strongly disagreed and 39.7% who disagreed that their societies takes a short period to pay them after coffee auction. Nearly half (48.6%) of farmers indicated that their societies do not provide them with marketing information as was affirmed by 16.1% who strongly disagreed and 32.5% disagreed to the statement that their society provides them with
Licensed under Creative Common Page 450 timely information. Majority (61.1%) of the coffee farmers indicated that they are discouraged by the presence of many middlemen who are tax collectors as was affirmed by 21.9% who strongly disagreed and 39.2% disagreed that middlemen do not take up much of their proceeds.
This study finds that there is an association between farmers’ motivation and different
aspects of coffee marketing factors. The findings agree with Kuguru (2016) study on effects of marketing processes on performance of coffee industry conducted in Mathira constituency of Kenya. The study results showed that 67.90% of the respondents agreed and strongly agreed that marketing process played a significant role in the performance of coffee industry. The study findings also show that coffee societies in Kangundo Sub-county do not provide farmers with timely marketing information. The results are consistent with Mutua and Kioko (2016) study the contribution of agribusiness support projects on coffee production in Machakos County. The study results showed that farmers who were not provided with market information on timely basis.
Farmers’ Satisfaction Level with Cooperative Coffee Marketing System
The study sought to establish the satisfaction level of farmers with current legal regime that dictate that smallholder coffee farmers are required to only market their coffee through coffee societies. Results are presented in figure 4.
Figure 4: Farmers’ Level of Satisfaction with Cooperative Marketing System
The results show that only less than half (46.2%) of farmers are satisfied with the current coffee marketing regime as indicated by 8.1% who indicated that they are highly satisfied and 38.1% who affirmed that they are satisfied with the requirement that they are supposed to sell their coffee through their societies. This could imply that majority of the farmers are not comfortable marketing their coffee through their societies. The study findings are consistent with Nduati
0.0% 50.0%
8.1%
38.1%
24.4% 29.4%
Licensed under Creative Common Page 451 (2012) study on factors influencing service provision by cooperative societies in Kigumo District of Muranga County. Results showed that farmers’ dissatisfied with management of their
cooperative society did not deliver their coffee to the society.
Farmers’ Coffee Marketing Channels Preferences
This study sought to seek farmers’ views on the marketing channel they would prefer were they
to be offered that option. The results are presented in Figure 5.
Figure 5: Farmers’ Preferred Coffee Marketing Channel
The results show that most (65.3%) farmers, as indicated by 30.3% who agreed and 35.0% who strongly agreed, would prefer to process and add value to their coffee before marketing; followed by selling to a regional organization centrally located, as indicated by 38.9% who agreed and 13.1% who strongly agreed; followed by cooperatives, at 41.6% and then middlemen. It is significant to note that cooperatives were preferred by farmers at position 3 clearly showing that majority of farmers are forced to sell their coffee through the cooperative system. These could be the reason why Nduati (2012) study established that farmers dissatisfied with the management of their cooperative societies did not deliver their produce to factories and resulted to uprooting the crop. It can be claimed that the reason why coffee production is declining in Kenya is largely due to archaic and rigid marketing system that does not allow the smallholder farmer other marketing channels should s/he be dissatisfied with the cooperative marketing system.
0.0% 5.0% 10.0% 15.0% 20.0% 25.0% 30.0% 35.0% 40.0%
Licensed under Creative Common Page 452 According to ICO (2014) report, Indonesia has managed to retain its competitive advantage and overcome volatile global prices to maintain positive production growth. Roshetko (2015) reveals that farmers in Indonesia can sell their coffee either through large distributors, medium distributors or to individual buyers. Coffee sold to distributors can be cherry or beans but it is powdered and packed in different sizes when sold to individual consumers. In the current study, majority (65.3%) of farmers indicated that they would prefer to process and add value to their coffee before marketing; followed by selling to a regional organization centrally located at 52.0%; followed by cooperatives at 41.6% and then middlemen.
These study findings also agree with the findings from a study by Asefa et al (2016) on determinants of farmers’ preference to coffee market outlets conducted in Ethiopia that show
that Ethiopian coffee farmers are motivated into coffee cultivation by presence of many marketing options. The study results show that farmers prefer to sell their coffee to different outlets but the most frequently used coffee markets include informal buyers, formal coffee traders, brokers and farmer groups/cooperatives. According to ICO (2014) report, Ethiopia has consistently maintained positive coffee production. It can therefore be concluded that while farmers are motivated by the presence of different coffee marketing options, their peers in Kenya are demotivated by the rigidity of their coffee marketing system that gives them no other marketing option.
Uganda is another country in Africa with a positive coffee production growth. Abtew et al (2014) reports that coffee farmers can choose between selling their coffee to the rural traders (farm gate) or to the regional dehusking factory available in the Ggolo parish, Mpigi District in Uganda. He reports a significant number (58%) of the farmers combine both strategies, while 25% sales to rural traders and 16% only sale to the regional factory respectively. From the findings of this study, it can be concluded that farmers in Uganda are free to market their coffee either to rural traders or the regional factory and this could be the reason why farmers continue to increase their production.
CONCLUSION AND RECOMMENDATIONS
Licensed under Creative Common Page 453 cooperative society that they consider inefficiently and poorly managed. Further, the results show that, the first preference option would be to process and add value to their coffee before selling, the second preference option would be to sell their coffee produce to a regional organization centrally located then the third preference option would be to sell through cooperative societies. The fourth marketing preference would be middlemen. Given that majority of farmers are dissatisfied with the current coffee marketing system, the paper concludes that a constellation of marketing factors are responsible for declining coffee production in Kangundo Sub-county. To revitalize the declining coffee industry, this paper recommends to the government of Kenya to consider amending the Crops Act (2013) to allow for different marketing channels on top of the cooperative system.
LIMITATIONS
In terms of participants, the study was limited to responses from smallholder farmers and therefore, it did not get views from cooperative societies’ managements. The study was limited
to descriptive methods of data analysis and therefore, it did not test the relationship between marketing processes and coffee production.
REFERENCES
Abtew, A., Leitz, E. U., Tamubula, I. & Oyugi, M. (2014). Factors influencing coffee marketing strategies among coffee farmers in Ggolo Parish, Uganda, Tropentag, 17-19.
Asefa, S., Mulugeta, W. & Hadji, J. (2016). Determinants of farmers’ preference to coffee market outlet in Jimma zone: The case of coffee potential districts. Developing Country Studies, 6(6), 9 – 19.
Bichanga, W. & Mwangi, J. K. (2013). Effects of Liberalization on Coffee Production in Kenya. European Journal of Business and Management. 5(3).
Chemiat, N. J. (2014). Effect of advance payment of coffee delivered to farmers cooperative societies on farmers’ satisfaction a case of Gusii cooperative societies, Kenya. International Journal of Innovative Research and Development. 3(13).
Cooper, D.R. & Schindler, P.S. (2008).Business Research Methods (10th edn). Boston. McGraw-Hill
Government of Kenya (GoK) (2009). Agricultural Sector Development Strategy. Nairobi. Government printer International Coffee Organization (ICO). (2014).World Coffee Trade (1963 – 2013): A Review of the Markets, Challenges and Opportunities Facing the Sector. Author.
International Coffee Organization (ICO) (2019). Total production by all exporting countries. Retrieved from http://www.ico.org/prices/po-production.pdf
Karanja, A. and Nyoro, J. (2002).Coffee prices and regulation and their impact on livelihoods of rural community in Kenya. Kenya Coffee, 74 (387).
Kegode, P. (2005). Economic Governance of coffee sector-Focus central Province. Nairobi. Center for Governance and Development
Kothari, C. R.& Gaurav, G. (2014).Research methodology, (3rd Ed).New Delhi. Age International Publishers.
Licensed under Creative Common Page 454 Krejcie, R. V. & Morgan, D. W. (1970). Determining sample size for research activities. Educational and Psychological Measurement.
Lugando, C. & Omukoko, C. (2017). Factors leading to decline of coffee in Vihiga County, Kenya. Asian Journal of Agriculture Extension, Economics and Sociology. 16(4): 1 – 5.
Monroy, L., Mulinge, W. & Witwer, M. (2013). Analysis of incentives and disincentives for coffee in Kenya: Technical notes series. Rome. FAO.
Mude, A. (2006). Weaknesses in institutional organization: Explaining the dismal performance of Kenya’s coffee cooperatives. Paper Presented at International Association of Agricultural Economists Conference.
Mugenda, O.M. & Mugenda, A. G. (2003). Research Methods: Quantitative and Qualitative Approach. Nairobi. Acts Press.
Mutua, A. M. & Kioko, M. F. (2016). An analysis of agribusiness support projects contribution on coffee production in Machakos county-Kenya. International Journal of Education and Research, 4(7).
Mureithi, L. (2008). Coffee in Kenya: Some challenges for decent work. Washington D. C., International Labour Office.
Murthy, P. S. & Madhava Naidu, M. (2012).Sustainable management of coffee industry by products and value addition—A review. Resour. Conserv. Recycl. 66, 45–58.
Nduati, S. (2012).Factors influencing service provision by cooperative societies in Kigumo District, Muranga County, Kenya. Nairobi. University of Nairobi.