http://dx.doi.org/10.4236/msa.2014.514109
How to cite this paper: Günay, E., Golmohammadi, H. and Kaya, Ş.T. (2014) Microscopic Characterisation of Pinus sylvestris Cell Structures under Compression Loading. Materials Sciences and Applications, 5, 1060-1073.
http://dx.doi.org/10.4236/msa.2014.514109
Microscopic Characterisation of
Pinus
sylvestris
Cell Structures under
Compression Loading
Ezgi Günay
1*, Hamad Golmohammadi
1, Şükrü Tayfun Kaya
2 1Mechanical Engineering Department, Gazi University, Ankara, Turkey 2TCDD High Speed Train District Office, Altındağ, Ankara, TurkeyEmail: *[email protected]
Received 11 September 2014; revised 8 October 2014; accepted 24 November 2014
Copyright © 2014 by authors and Scientific Research Publishing Inc.
This work is licensed under the Creative Commons Attribution International License (CC BY).
http://creativecommons.org/licenses/by/4.0/
Abstract
This study is mainly focused on the 3D mechanical cell deformations of 20 × 20 × 60 mm sized softwood specimens under 35 - 40 MPa compression loading at room temperature of 20˚C. The
moisture content of the specimens was 6% - 7%. The data of microscopic images were measured
and compared in terms of the permanently degenerated individual cell structures each in mi-cro-scale
( )
μm . 3D cell deformations of tissues were observed with a magnification of (×100) - (×1500) and in the range of 3.0 - 5.0 kV voltage under the SEM microscope. The specimens wereexamined under magnification and photographed before and after the compression loading ap-plied parallel to the grain angles to the wood samples. Specimens were painted with gold liquid
(12 × 12 × 12 mm sized specimens) in obtaining the SEM images. Under the SEM, these specimens
were photographed and lengths between the cell walls ranged between 15 to 40 micrometers. In
this study, relative deformations of pinewood cells were determined statistically considering the
percentage permanent deformation under the compression loading. It was performed by using knowledge of structural mechanics, considering the measurement of permanent deformation in honeycomb-pinewood structure material.
Keywords
Biomechanics, Nano-Composites, Micromechanics, Pinus silvestris L., Compression Loading, Cell
Deformation, SEM
1. Introduction
Reviewing the literature, a study on axial compression tests was performed on samples of Norway spruce wood with different orientations of the annual rings relative to the load direction performed to obtain the stress-strain measurement results. The results of this study showed us that permanent deformation in honeycomb-pinewood exhibited a nonlinear mechanical behavior [1].
According to the results of another study, a micromechanical model was developed in which shear modulus was related to the density gradient of the annual ring. The purpose of this study was to understand the low transverse shear modulus in spruce. A hexagonal honeycomb model in the transverse spruce softwood plane was combined with finite element analysis, so that local shear strains were modeled. Testing procedures on a spruce sample were performed in terms of shear to determine the strain profile at the annual ring scale as a function of radial position [2].
In another study, the proportion of bending and stretching deformation associated with different cases were investigated considering the important parameters including cell shape angle, relative density and cell wall modulus. A two-phase wood model is introduced based on a layered early wood and latewood material. In place of a one-phase model, a two-phase model was developed based on two different regions with constant densities of early wood and latewood. Each of the two regions was two honeycombs, and the free parameters of the two honeycombs (cell wall modulus and cell shape angle) were determined using a fitting procedure to global expe-rimental data for wood. The resulting values for cell wall modulus and cell shape angle were then compared with previously reported data. The predicted cell shape angle was 12.5˚, which was in good agreement with ex-perimental observations. The resulting average cell wall modulus is 20.5 GPa [3].
A research made on the mechanical properties of a few common porous materials: carbon rods, ceramics, po-lymeric foams and bricks were performed by experimental and analytical methods. The characterization of pore structures was performed using a Mercury Porosimeter technique. Using this technique, detailed information was obtained on the density, porosity, surface area and pore size distribution. Scanning Electron Microscopy (SEM) with an image analyzer was employed to determine the porosity of foams. A large number of experi-ments were conducted with either bending or compression setup and their macro-mechanical properties such as Young’s modulus, hardness and strength were obtained [4].
Another research evaluates in parallel wood fibers and plant fibers to highlight their similarities and differ-ences regarding their use as reinforcement in composites [5].
Fratzl, Burgert and Keckes studied on the molecular mechanisms and its responsibility for the deformation of wood, as well as the mechanical interaction of cell-wall components, such as cellulose, lignin and hemicellulos-es, which were not well understood. In a recently published experiment, they have shown that wood foils and single cells of compression wood of spruce (Picea abies [L.] Karst.) could deform permanently under tensile load via a stick and slip mechanism at the molecular level occurring during shear of the matrix between cellu-lose micro fibrils [6].
Wood foils and fibers of compression wood of spruce (Picea abies [L.] Karst.) were investigated in cyclic tensile tests in laboratory condition. Additionally, wood foils and fibers were strained in a tensile stage while simultaneously monitoring stress response and collecting X-ray diffraction pattern (XRD) by using a two-di- mensional detector. It was found that micro fibril angle decreased in the cell wall while stretching. The cyclic load tests indicated a recovery mechanism after irreversible deformation, which was interpreted as a stick-and- slip mechanism on the molecular level of the cell wall [7].
The irreversible behavior of wood cell-walls has been investigated by means of a finite element-based com-putational multi scale approach. A finite strain three-scale model has been proposed where the overall response of the cell-wall composite was obtained by the computational homogenization of a Representative Volume Ele-ment (RVE) of cell-wall material, whose mechanical response prediction, in turn, was described by the compu-tational homogenization of a cellulose core-RVE [8].
In this research, the Pinus Sylvestris L. (acronym: P. Sylvestris) pinewood specimen was examined in both macro mechanical and micromechanical aspects by using the scanning electron microscopy (SEM). In the macro mechanical review step, axial compression tests were performed on wood samples with parallel annual ring orientations relative to the load direction in obtaining the stress-strain measurement results. In the microme-chanical review step, the change of shapes of the tracheid cell walls and sieve-plate structural parts were ex-amined by comparing the SEM images obtained from unloaded and loaded specimens.
2. Macromechanical Studies
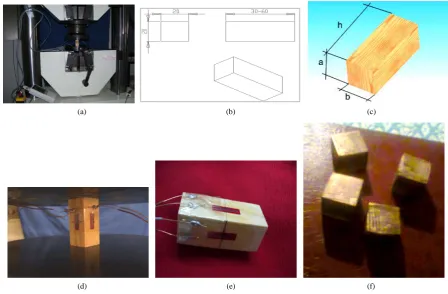
Compression tests were conducted by Dartec tensile test machine (Figure 1(a)) in laboratory conditions [11]. Test specimens of pinewood in size 20 × 20 × 60 mm were prepared ((a × a × h) (Figure 1(b)& Figure 1(c)). These specimens were prepared by cutting pieces from the tree trunk in such a way that the fiber directions of the specimens extending along with the parallel direction to the longer side of them (h = 60 mm,Figure 1(c)).
On the pinewood specimens the compression tests were applied and normal strain data was gathered with strain gages that affixed to two neighboring face of the specimens (Figure 1(d) & Figure 1(e)).
Then the specimens were separated into two categories. The first category was the wood grain orientations situated parallel to the loading direction. The second category was the perpendicular situated wood grain orien-tations to the loading direction. Our study was performed considering the first category and the experimental results obtained from macro scale were used in understanding the micromechanical behavior of wood cells un-der compression.
The samples were placed in such a way that not to slip during the pressure application. Compression testing was started from scratch, enhanced with specific steps and the experiment was terminated when the stress reached to the available maximum stress levels. Maximum applicable stress levels and the corresponding de-veloped strains measured by using strain gauges were presented inFigure 2andTable 1.
The ninth experiment among the performed eighteen experiments was chosen for studying under SEM and according to the results of microscopic investigation, two slope lines were plotted starting from the origin
(a) (b) (c)
[image:3.595.87.536.402.696.2](d) (e) (f)
Figure 2.Compression test results of the (P. Sylvestris) pinewood specimen.
Table 1. Summary of compression test specimen properties and data of the original and modified slope lines.
Experimental Data
Geometric Properties of Wood Specimen-Size Measured Data Specifications Magnitude
i
: Undeformed length (mm): 50.40 mmod1: Original slope of stress-strain data obtained from gauge_1 (GPa) 1
m : Modified slope of stress-strain data obtained from gauge_1 (GPa)
5.08 4.83
f
: Deformed length (mm): 50.31 m2: Original slope of stress-strain data obtained from gauge_2 (GPa)
mod 2
m : Modified slope of stress-strain data obtained from gauge_1 (GPa)
7.01 6.66
1i
t : Undeformed thickness_1 (mm): 19.98 θ1: Orientation of stress-strain curve obtained from for gauge_1
mod 1
θ : Modified orientation of stress-strain curve obtained from for gauge_1
78.87˚ 74.92˚
1f
t : Deformed thickness_1 (mm): 19.98 θ2: Orientation of the curve stress-strain curve obtained from gauge_2 mod
2
θ : Modified orientation of stress-strain curve obtained from for gauge_1
81.877˚ 77.78˚
2i
t : Undeformed thickness_2 (mm): 20.30 Applied maximum stress σc (MPa) and measured corresponding strain c
ε from gauge_1
−37.01 −7.48E−3
2f
t : Deformed thickness_2 (mm): 20.31 Applied maximum stress σc (MPa) and measured corresponding strain
c
ε from gauge_2
−40.79 −5.5E−3
Cross sectional area (mm2): 405.59
i
V: Initial volume (mm3): 20.44
f
V : Final volume (mm3): 20.41
-0.005295014, -24.82778345 -0.005421646, -28.13157986 -0.007480422, -37.0074508 -0.003271661, -24.827783 -0.003370203, -28.131579 0 -0.0055, -40.787395 -45 -40 -35 -30 -25 -20 -15 -10 -5 0
-0.008 -0.007 -0.006 -0.005 -0.004 -0.003 -0.002 -0.001 0
S
tr
es
s (
M P a ) Strain (mm/mm) G1 G2
G1 95% slope G2 %95 slope
[image:4.595.90.539.421.717.2]through the twostress-strain curves. By the application of maximum stresses σmax ≈ −40.787 MPa,
max 37.007 MPa
σ ≈ − to the specimen, two different strain values were obtained on the two adjacent faces.
max 0.00748
ε = − value was obtained from strain gauge_1 and εmax = −0.0055 was obtained from strain gauge_2 as shown inFigure 1.
The first stress strain curve represents the data obtained with the “G1-gauge_1” measurements. The second curve seen on the same graph represents the instantaneously measured data obtained with the “G2-gauge_2” (second gauge) which was located on the adjacent surface of the specimen. Slopes of the two stress-strain curves were determined as θ =1 78.87 and θ =2 81.88 respectively. The approximate yield stress value of a speci-men was determined by using the 5% offset principle on the related stress-strain diagram. These two offset new lines generates the other two modified slope angles as; θ1mod =74.92 and θ2mod=77.78 (Table 1). These straight lines were used to define the first physically failure point of the wood structure under compression. Be-side these slope lines, another slope line was drawn by 95% reduction of the original slope line which were re-ferred as the offset lines and the corresponding angle was θmod as previously mentioned. These second slopes were defined as the modified slopes and their lines cut the stress-strain curves at the definite points which define the yielding values of the materialFigure 2. As shown inFigure 2andTable 2, yield stress values were found
as σ = −y 24.82 MPa and σ = −35.00 MPa. The other critical stress values obtained from two strain gauges
were σ = −18.57 MPa and σ = −35.00 MP respectively.
3. Micromechanical Studies
The specimen chosen for investigation was divided into three equal (12 × 12 × 12 mm) cubic shape parts in or-der to visualize each of the six faces microscopically (Figure 1(f)). They were painted with gold liquid for SEM examination. The moisture content of the specimens was 6% - 7%. SEM microscopy was used in examination of cell structures of the uncompressed and the compressed wood samples. Selected sample images of the micro-scopic views were used for detail examination and for detection of the physical changes caused by the load compression to the cell walls and sieve-plates.
A living plant cell consists of two primary domains: the protoplast and the cell wall (Figure 4). The protoplast is the sum of the living contents that are bounded by the cell membrane (Figure 3(a)-(b), Figure 3(d)). The cell wall is a non-living, largely carbohydrate matrix extruded by the protoplast to the exterior of the cell membrane. The plant cell wall protects the protoplast from osmoticlysis and often provides mechanical support to the plant at large [12]-[15] (Figure 4).
Wood fiber is composed of layers of crystalline cellulose (fibrils) wrapped in a cylindrical shape with an open center, or “lumen” (Figure 3(b)). Wood fiber is broken down into five distinct layers and is referred to as layers ML, P, S1, S2, and S3. The fibrils in the “S2” layer form the major strength-producing portion of the wood fiber
[16]-[18] (Figure 5).
In this research, deformation of the cell walls and sieve-plates were explained according to the applied com-pression loading. The measured cell wall and sieve-plate sizes were obtained from the SEM images (Figure 4,
Figure 6), and all of the related data summarized inTable 3.
4. Results and Discussions
The results of our study could be assessed separately according to the macro mechanical and micromechanical
Table 2. Properties of the stress-strain curves of the specimen under compression loading.
Compression Loading Parallel to the Grains
The Slope Lines Cross the Stress-Strain Curve at Definite Points
(1) (2) (3)
(MPa) ε (10−3)
σ
(MPa)
ε
(10−3)
σ
(MPa)
ε
(10−3)
(
MPa)
Y σ
Modified Slope
(
MPa)
f σ
Stress-Strain Curve
Gauge-1 −4.08 − − − − − −24.82 −37.007
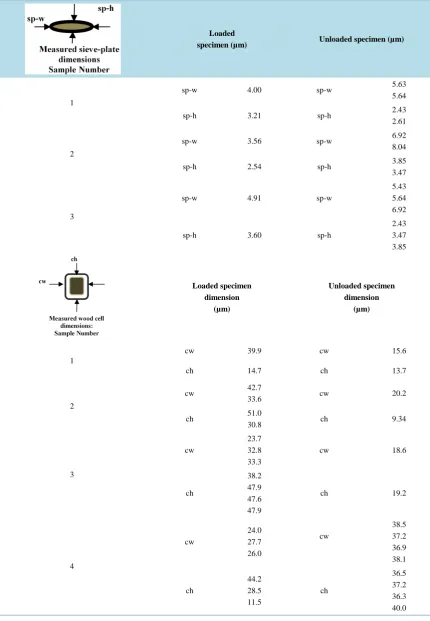
Table 3.Themeasured dimensional values of the pinewood specimen.
Loaded
specimen (µm) Unloaded specimen (µm)
1
sp-w 4.00 sp-w 5.63
5.64
sp-h 3.21 sp-h 2.43
2.61
2
sp-w 3.56 sp-w 6.92
8.04
sp-h 2.54 sp-h 3.85
3.47
3
sp-w 4.91 sp-w
5.43 5.64 6.92
sp-h 3.60 sp-h
2.43 3.47 3.85
Loaded specimen dimension
(µm)
Unloaded specimen dimension
(µm)
1
cw 39.9 cw 15.6
ch 14.7 ch 13.7
2
cw 42.7
33.6 cw 20.2
ch 51.0
30.8 ch 9.34
3
cw
23.7 32.8 33.3
cw 18.6
ch
38.2 47.9 47.6 47.9
ch 19.2
4
cw
24.0 27.7 26.0
cw
38.5 37.2 36.9 38.1
ch
44.2 28.5 11.5
ch
Continued
5
cw
21.7 20.3 21.6 22.1 25.4 23.5
cw
50.0 45.0 25.0 25.0 25.0
ch
12.2 13.4 12.1 11.0 13.1 15.1
ch
50.0 45.0 62.0 70.0 50.0
Loaded specimen dimension (µm)
Unloaded specimen dimension
(µm)
1
cwt 9.7 cwt 5.0
cht 7.9 cht 5.0
2
cwt 5.9 cwt 7.0
cwt 5.9 cwt 7.0
3
cwt 6.15 cwt 6.0
cht 10.11 cht 6.0
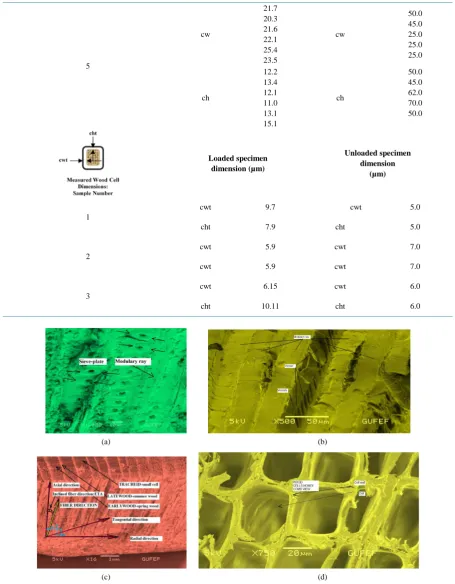
(a) (b)
[image:7.595.85.541.97.682.2]
(c) (d)
Figure 3. Microscopic transverse section views of P. Sylvestris. (a) Microscopic images (×1000) of sieve-plates; (b) Microscop-ic images (×500) of crystalline cellulose (fibrils) wrapped in a cylindrMicroscop-ical shape with an open center; (c) The fibril angle Eta
aspects. The obtained results were explained as below:
1) In terms of macroscopic scale; under the maximum stress application of 37 MPa, two different compression strains of −7.5E−3 and −5.5E−3 were obtained (Figure 2). These two different strain values were measured
[image:8.595.100.520.131.281.2]
(a) (b)
[image:8.595.190.505.313.739.2]Figure 4.The general honeycomb views of P. Sylvestris that is composed of tubular fibers shown in transverse section bounded together by a lignin “glue” material: Microscopic views of the P. Sylvestris cells (a) before (×750) and (b) after (×1500) compression test. (a) 5 kV voltage and ×750 magnification; (b) 5 kV voltage and ×1500 magnification.
Figure 5.A typical tracheid cell wall [16].
(a1) 5 kV voltage and ×200 magnification
(b1) 5 kV voltage and ×200 magnification
(a3) 5 kV voltage and ×100 magnification
(b2) 5 kV voltage and ×25 magnification
(a4) 5 kV voltage and ×500 magnification
(b3) 5 kV voltage and ×750 magnification
(a5) 5 kV voltage and ×1000 magnification
(b4) 5 kV voltage and ×750 magnification
(a6) 5 kV voltage and ×1500 magnification
(b5) 5 kV voltage and ×1000 magnification
(a7) 5 kV voltage and ×750 magnification
(b6) 5 kV voltage and ×600 magnification
(a8) 5 kV voltage and ×750 magnification
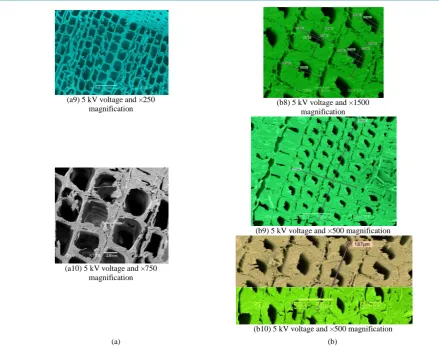
(a9) 5 kV voltage and ×250
magnification (b8) 5 kV voltage and ×1500 magnification
(a10) 5 kV voltage and ×750 magnification
(b9) 5 kV voltage and ×500 magnification
[image:10.595.75.515.78.425.2](b10) 5 kV voltage and ×500 magnification (a) (b)
Figure 6. Images of P. Sylvestris under SEM. (a) Unloaded cell and sieve-plate structures; (b) Loaded cell and sieve-plate structures.
through two adjacent surfaces of the specimen. The difference between these two strains was calculated as 2.0E−3. This deformation difference can be explained by the different fiber arrangement (fibril angles) lo-cated on the two adjacent sides of the specimen. So, the fiber angles or the micro fibril angles in the S2 layer were larger than the S1 layer so that the compression strength and modulus elasticity of this layer was found to be less [19] (Figure 3(c)). According to these results, the implication is that mechanical compression load-ing gives two different slope lines instantaneously measured for the modulus of elasticity in compression. 2) SEM view examinations showed a non-symmetrical arrangement of cells and sieve plates; therefore wood
material should be evaluated in anisotropic biocomposite category (Figure 3(c)).
3) The obtained volumetric change (dilatation) (Table 1) of the compressed specimen was as follows:
1.2919 3
f i
i i
V V V
e E
V V
− ∆
= = = − − (1)
4) Implementation of compression loading to the specimen causes considerable amounts of reduction in width and height of the wood cell in micro scale.
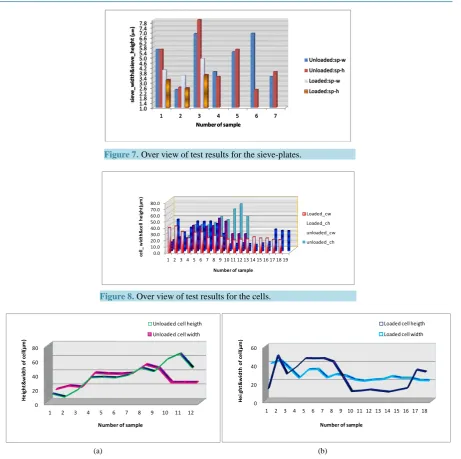
5) During testing; the maximum compression stress values obtained from two strain gauges ranged between −37 and −42 MPa. In the light of these findings, the results can be evaluated as follows: The contraction rates in the width and height of the cell wall were 14.0% and 27.26% respectively. Secondly; as well as 31.13% average height reduction, a 15.95% average width reduction was detected in the sieve-plate (Figure 7,
Fig-ure 8).
6) Compression loading causes significant changes in the height and width dimensions of the cell walls (Figure
Figure 7.Over view of test results for the sieve-plates.
Figure 8.Over view of test results for the cells.
[image:11.595.90.538.568.692.2](a) (b)
Figure 9.Comparison of P. Sylvestris cell dimensions under compression: (a) Unloaded cell height/width dimensions; (b) loaded cell height/width dimensions.
(a) (b)
Figure 10.Comparison of P. Sylvestris cell dimensions under compression: (a)Width changes considering loaded/unloaded cases; (b) Height changes considering loaded/unloaded cases.
0.0 10.0 20.0 30.0 40.0 50.0 60.0 70.0 80.0
1 2 3 4 5 6 7 8 9 10 11 12 13 14 15 16 17 18 19
ce ll_ w id th & ce ll he ig ht (µ m )
Number of sample
Loaded_cw Loaded_ch unloaded_cw unloaded_ch 0 20 40 60 80
1 2 3 4 5 6 7 8 9 10 11 12
He ig ht & w id th o f c ell( µm )
Number of sample
Unloaded cell heigth Unloaded cell width
0 20 40 60
1 2 3 4 5 6 7 8 9 10 11 12 13 14 15 16 17 18
H ei g ht & w id th o f c ell( µm )
Number of sample
Loaded cell heigth Loaded cell width
0 10 20 30 40 50
1 2 3 4 5 6 7 8 9 10 11 12 13 14 15 16 17 18
W id th o f c ell( µm )
Number of sample
Loaded cell width Unloaded cell width
0 20 40 60 80
1 2 3 4 5 6 7 8 9 10 11 12 13 14 15 16 17 18
He ig ht of ce ll( µm )
Number of sample
1 1 2.726 10 1.4038 10 ch cw ch ch cw cw ε ε − − ∆ = = − × ∆ = = − × (2)
7) The sieve-plate height and width strain values were calculated in terms of average values as follows;
1 1 3.112 10 1.5959 10 sph spw sp h sp h sp w sp w
ε
ε
− − ∆ − = = − × − ∆ − = = − × − (3)8) The cell wall average thickness values that obtained by measuring the width and height of the cells after loading were; cwt=7.965 mµ and cwh=7.65 mµ (Table 3, Figure 6(b)). The average wall thickness values of the wood cells before load application were approximately equal to cwt≅cwh= µ6 m (Table 3,
Figure 3(d)). To explain this phenomenon, a figure is provided in which the failed cell wall surfaces can be
observed (Figure 6(b)).
9) The measured average values of the width and height of the cell walls after loading were cw=26.87 mµ
and ch=28.44 mµ (Table 3). The measured average values of the width and height of the cell walls before loading were approximately equal to cw=31.25 mµ and ch=39.10 mµ (Table 3). To explain this phe-nomenon, a figure is provided that the cell wall deformation can be seen easily (Figure 6(b10)).
5. Conclusions
This study mainly focused on the 3D-mechanical cell deformations of 20 × 20 × 60 mm sized P. Sylvestris wood specimens under 35 - 40 MPa compression loading at room temperature of 20˚C. The moisture content of the specimens was 6% - 7%. In this research, wood specimens before and after the loading were visualized and photographed under the (Scanning Electron Microscope) SEM. The data of microscopic images were measured and compared in terms of the permanently degenerated individual cell structures each in micro-scale
( )
µm(Figure 11,Figure 12). It was concluded that a considerable amount of deformation occurred both in cell and
sieve-plate dimensions of the wood specimen under compression loading. Beside this conclusion, it was de-tected that both cell and sieve-plate dimensions showed negative average straining values under mechanical compression loading.
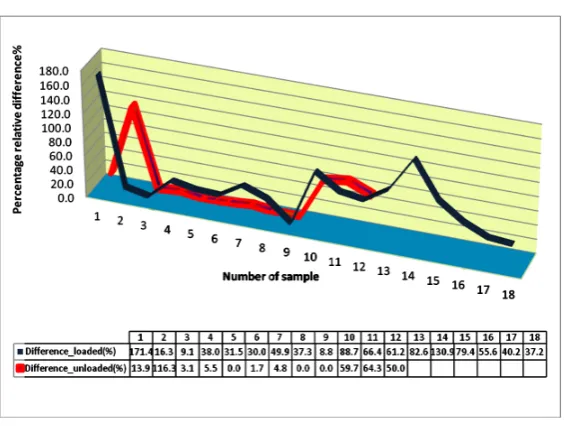
The average percentage difference between height and width dimension measurements of cells for loaded and unloaded cases were as follows: 1) for loaded case: 57.475%; 2) for unloaded case: 26.592% (Figure 13).
The average percentage difference measured between height and width dimensions of sieve-plates for loaded and unloaded cases were: 1) for loaded case: 33.718%; 2) for unloaded case: 32.938% (Figure 14). As a conclu-sion of our study we can claim that, the largest deformation between the wood-cell and sieve-plates took place within the cell sections of the wood microstructure.
Figure 11.Dimensional comparison of loaded and unloaded cells. 0 5 10 15 20 25 30 35 40 M ea su re d l en gh t( µm )
Measured cell segments
Figure 12.Dimensional comparison of loaded and unloaded sieve-plates and cells.
Figure 13. The average percentage change of the cells in terms of height and width values for loaded and unloaded cases. (Average changes; loaded: 57.475%, unloaded: 26.592%).
Figure 14. The average percentage change of the sieve-plate in terms of height and width values for loaded and unloaded cases. (Average changes; loaded: 33.718%, unloaded: 32.938%).
0 5 10 15 20 25 30 35 40
M
ea
su
re
d l
en
gh
t(
µm
)
Measured cell and sieve-plate sections
UNLOAD_CH(All) UNLOAD_CELL_DIM(All) UNLOAD_CW LOAD_CH LOAD_CELL_DIM(All) LOAD_CW
[image:13.595.173.456.490.685.2]Acknowledgements
Compression tests were performed in the Mechanics Laboratory, Mechanical Engineering Department Gazi University. SEM microscopic images were obtained in the SEM-Laboratory of Biology Department, Science Faculty, Gazi University. We also owe thanks to Professor S. Candan, N. Özyurt, D. Amutkan for providing the SEM laboratory. The macromechanical aspect of our study was supported by Gazi University Scientific Re-search Projects Department with Grant Ref No: 6/2006-07.
References
[1] Miksic, A., Myntti, M., Koivisto, J., Salminen, L. and Alava, M. (2013) Effect of Fatigue and Annual Rings’ Orienta-tion on Mechanical Properties of Wood under Cross-Grain Uniaxial Compression. Wood Science and Technology, 47, 1117-1133. http://dx.doi.org/10.1007/s00226-013-0561-8
[2] Hassel, B.I., Modén, C.S. and Berglund, L.A. (2009) Functional Gradient Effects Explain the Low Transverse Shear Modulus in Spruce Full Field Strain Data and a Micromechanics Model. Composites Science and Technology, 69, 2491-2496. http://dx.doi.org/10.1016/j.compscitech.2009.06.025
[3] Modén, C.S. and Berglund, L.A. (2008) A Two-Phase Annual Ring Model of Transverse Anisotropy in Softwoods.
Composites Science and Technology, 68, 3020-3026. http://dx.doi.org/10.1016/j.compscitech.2008.06.022
[4] Lu, G., Lu, G.Q. and Xiao, Z.M. (1999) Mechanical Properties of Porous Materials. Journal of Porous Materials, 6, 359-368. http://dx.doi.org/10.1023/A:1009669730778
[5] Madsen, B. and Gamstedt, E.K. (2013) Wood versus Plant Fibers: Similarities and Differences in Composite Applica-tions. Advances in Materials Science and Engineering, 2013, Article ID: 564346.
[6] Fratzl, P., Burgert, I. and Keckes, J. (2004) Mechanical Model for the Deformation of the Wood Cell Wall. Zeitschrift fur Metallkunde Metallurgy & Metallurgical Engineering, 95, 579-584.
[7] Burgert, I., Keckes, J. and Fratzl, P. (2006) Mechanics of the Wood Cell Wall. In: Stokke, D.D. and Groom, L.H., Eds.,
Characterization of the Cellulosic Cell Wall, Wiley, Grand Lake, 30-37.
[8] Flores, E.S., Souza Neto, E.A. and Pearce, S.C. (2011) A Large Strain Computational Multi-Scale Model for the Dis-sipative Behaviour of Wood Cell-Wall. Computational Materials Science, 50, 1202-1211.
http://dx.doi.org/10.1016/j.commatsci.2010.11.023
[9] Qing, H. and Mishnaevsky Jr., L. (2010) 3D Multiscale Micromechanical Model of Wood: From Annual Rings to Mi-crofibrils. International Journal of Solids and Structures, 47, 1253-1267.
http://dx.doi.org/10.1016/j.ijsolstr.2010.01.014
[10] Moëll, M.K. and Minoru Fujita, M. (2004) Fourier Transform Methods in Image Analysis of Compression Wood at the Cellular Level. IAWA Journal, 25, 311-324. http://dx.doi.org/10.1163/22941932-90000368
[11] Kaya, Ş.T. (2007) Determination of the Failure Curve of Transversely Isotropic Fiber Composite Pinewood (Pinus Sylvestris) by the Help of Experimental Studies. M.Sc. Thesis, Gazi University, Institute of Science and Technology, Turkey.
[12] Wiedenhoeft, A. (2014) Structure and Function of Wood: Wood Handbook. Chapter 3, Forest Products Library. http://www.fpl.fs.fed.us/documnts/fplgtr/fplgtr190/chapter_03.pdf.htm
[13] Esau, K. (1977) Anatomy of the Seed Plants. 2nd Edition, John Wiley & Sons Ltd, New York.
[14] Raven, P., Evert, R. and Eichhorn, S. (1999) Biology of Plants. 6th Edition, W.H. Freeman & Company, New York.
[15] Dickison, W. (2000) Integrative Plant Anatomy. Academic Press, New York.
[16] Côté, W.A. (1967) Wood Ultrastructure. University of Washington Press, Seattle.
[17] Josza, L.A. and Middleton, G.R. (1994) Wood Quality Attributes and Their Practical Implications. Forintek Canada Corp., 2655 East Mall, Vancouver BC Canada V6T 1W5.
[18] Logan, J.D. (2014) Sensitivity to Fundamental Wood Properties in the Metriguard Model 7200 HCLT and the CLT. http://www.metriguard.com/fiber.htm