Recent developments in use of analytic and quantitative
tools for the modelling, analysis, design, and
management of telecommunication system
Nabil Y. M. Salih*
*
Department of electrical & electronic engineering, Higher Institute of Science and Technology \ Al Garaboulli
DOI: 10.29322/IJSRP.8.7.2018.p7977
http://dx.doi.org/10.29322/IJSRP.8.7.2018.p7977
Abstract- This paper focusses on the recent development in modelling, simulation and evaluation of a telecommunication system. Some of the changes in the modelling and analysing system are in the hierarchal, object oriented and intelligent modelling. A comparison on the various simulation programs being applied to day have been analysed with their mode of operation, benefits and drawbacks.
Index Terms- Modelling, network, simulation, telecommunication system
I. Introduction
The telecommunications field has experienced an unprecedented evolution in the transmitted traffic, applied technologies and the user’s universality. In the past, the telecommunication networks focused on transmitting voice traffic through the use of circuit switching technologies. This has gradually evolved to use of packet switching thus enabling voice digital transmission of videos, data and voice.
This sudden change in the telecommunication services and technology in the processes of switching, computing, transmission and integration of digital data, has brought about an evolution in the analysing, designing and evaluation of the networks. This has increased the system’s complexity and has commenced the use of computer modelling and simulating in designing complex telecommunication system because of their high capacity, required efficiency and versatility1. It has also been done to overcome the complexity of distributed working environments such as grids, P2P networks and grids in computations.
II. SIMULATION
In simulating a telecommunication system, there are three main simulation languages that are used. These are;
• Communication oriented languages.
• Communication oriented simulators.
• General-purpose simulation languages.
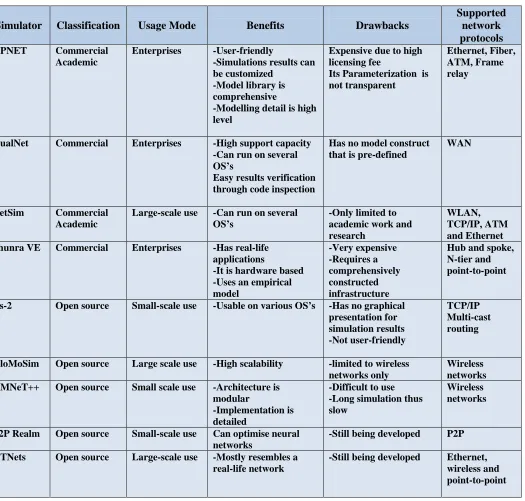
III. RECENT NETWORK SIMULATORS
There have been various developments in the simulation networks. An example is in OPNET, where it has had its performance capabilities improved. Its end-to end visibility has been increased. It also has upgrades on its analyst software, ACE. Other simulators have been improved to increase their versatility. The following table indicates the various simulators and their improved adaptations.
1Juang, J., Huang, Y.-C., & International Conference on Intelligent Technologies and Engineering Systems. (2013). Intelligent technologies and
Table 1: Comparison of network simulators
Simulator Classification Usage Mode Benefits Drawbacks
Supported network protocols
OPNET Commercial Academic
Enterprises -User-friendly
-Simulations results can be customized
-Model library is comprehensive
-Modelling detail is high level
Expensive due to high licensing fee
Its Parameterization is not transparent
Ethernet, Fiber, ATM, Frame relay
QualNet Commercial Enterprises -High support capacity -Can run on several OS’s
Easy results verification through code inspection
Has no model construct that is pre-defined
WAN
NetSim Commercial Academic
Large-scale use -Can run on several OS’s
-Only limited to academic work and research
WLAN, TCP/IP, ATM and Ethernet Shunra VE Commercial Enterprises -Has real-life
applications
-It is hardware based -Uses an empirical model -Very expensive -Requires a comprehensively constructed infrastructure
Hub and spoke, N-tier and point-to-point
Ns-2 Open source Small-scale use -Usable on various OS’s -Has no graphical presentation for simulation results -Not user-friendly TCP/IP Multi-cast routing
GloMoSim Open source Large scale use -High scalability -limited to wireless networks only
Wireless networks OMNeT++ Open source Small scale use -Architecture is
modular
-Implementation is detailed
-Difficult to use -Long simulation thus slow
Wireless networks
P2P Realm Open source Small-scale use Can optimise neural networks
-Still being developed P2P
GTNets Open source Large-scale use -Mostly resembles a real-life network
-Still being developed Ethernet, wireless and point-to-point
IV. SIMULATION STRUCTURE
A simulation is defined as a stochastic functional relationship that links the input and output parameters. In this process, the
programmed model indicates values which act as representatives of the network. This is as a function of the input parameters that are assigned to the model and its operational characteristics. The reason as to why the network systems are modelled is the needed relationship is not known thus important to obtain the design process characteristics.
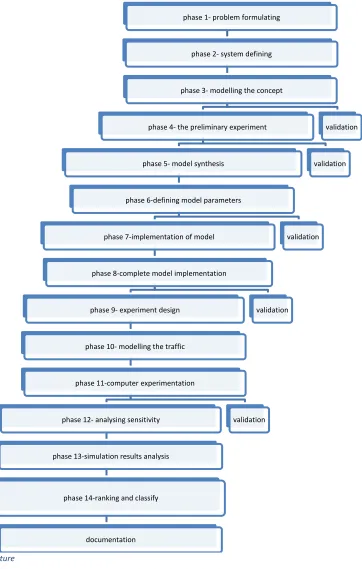
The following is an example of a simulation structure;
[image:3.612.129.491.80.649.2]
Figure 1: Simulation structure
V. NETWORKS MODELLING
There have been severally changes in modelling of networks. For instance, there has been a shift from the use of general-purpose simulation languages to the use specific software packages designed to specifically model the discrete event systems. This has greatly improved the validity of the simulating models. An example of simulating software under use is COMNET III. The structure of this software eases the process of modelling a network topology, communication protocols and traffic. It also has a comprehensive performance report which aids the user in evaluation of every applicable phase of the modelled network.
phase 1- problem formulating
phase 2- system defining
phase 3- modelling the concept
phase 4- the preliminary experiment
phase 5- model synthesis
phase 6-defining model parameters
phase 7-implementation of model
phase 8-complete model implementation
phase 9- experiment design
phase 10- modelling the traffic
phase 11-computer experimentation
phase 12- analysing sensitivity
phase 13-simulation results analysis
phase 14-ranking and classify
documentation
validation validation
validation validation
VI. TRAFFIC MODELLING
There are various methods used in validation of the process of network traffic such as its identification, classifying, parametrization and statistically validating it. The method used in analysing the traffic data is statistical inference. The first step in this process is identifying the probability distribution for the collected data. Afterwards, the probability distribution parameters are projected where their accuracy degree is evaluated statistically. A diverse stochastic process is best represented using both continuous and discrete probability distributions. In this case it displays a high degree of fidelity.
In modelling network traffic using the probability distribution technique, there must be identification of the real data. Data generation is done through the use of a theoretical probability distribution that is known. Such a distribution parameters are calculated. These two processes, classification and parametrization, need a formally conducted evaluation in determination of the similarity between the theoretically generated distribution data and real data, with a high confidence level.
The determination of resemblance degree of the real and theoretical distribution data is subjective. The technique subjectivity is centred on graphical methods. These are very essential in the data validation stages.
The statistical validation techniques are based on the hypothesis formal evaluation. The hypothesis is that the observed traffic is distribution function samples,𝐹(𝑥). The null hypothesis evaluation applies statistical methods such as the Chi-square, Kolmogorov Smirnov and Anderson Darling tests. The procedure for using the Chi-square method would be2;
I. Raw traffic data pre-processing
II. Definition of data and constructing the traffic histogram
III. Parametrization the model selected by applying the technique of maximum-likelihood estimators IV. Creating the histogram of the model
V. Evaluating the Chi-square method, histograms and data similarity.
The experimental design is rarely used in project simulations. The reason is that one is required to have a broad understanding of the statistical principles and the simulation process. However, it has a benefit in that one requires a minimal background of computer tools.
Some of the design techniques used are factorial, random design with blocking, fractional factorial design and a complete random design. The complete random design is applied as it is simple to analyse and design. It is centred on random distribution of the experimental and treatment units. If the blocking factor is included, homogeneity of the environment for the experimental blocks through the distribution of the experimental and simulation blocks. A 2k binary factorial design is a simple concept that is applied in numerous design problems. In this type of a design, the impact of k factors on the system’s performance is analysed. Each of the factors which is taken as the control input, is only allowed to have one of the two values that are possible.
If the factor’s number is high and the outcome of combining more than two factors is taken as negligible, the fractional factorial design can be used to reduce the number of experiments. In this fractional factorial concept, 2𝑘−𝑝, a fraction, 1
2𝑝, of the 2𝑘 experiments is done3. This is expected to give the relevant effects of the k number of factors. However, because of the sampling and simulation process stochastic nature, only a particular realization of the model will be achieved. This can lead to drawing of erroneous conclusion about the system being modelled4.
Due to the stochastic nature of the system, there is no identification, and definition of the model’s operating process using a deterministic mathematical model. However, a limitation in information obtaining of a simulated model is still possible.
VI. MODELLING TECHNIQUES
INTELLIGENT MODELLING SYSTEM
The basis for an intelligent modelling system is a dynamic multi-agent resource conversation process. Its approach is based on graphs and frames concept. This can be implemented using an SQL server DBMS. Knowledge formalization is achieved using an expert
2International Conference on Trends in Information, Telecommunication and Computing, & Das, V. V. (2017). Proceedings of the third International
Conference on Trends in Information, Telecommunication and Computing. New York, NY: Springer.
3In Hilt, B., In Berbineau, M., In Vinel, A., & In Pirovano, A. (2017). Networking simulation for intelligent transportation systems: High mobile wireless
nodes.
4Gupta, A., Galler, B. A., University of Michigan., & University of Michigan. (2017). Modelling a system architecture. Ann Arbor, MI: University of
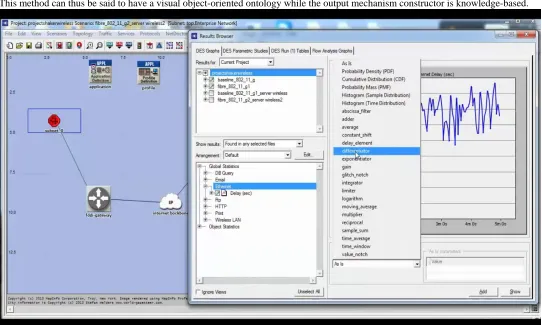
system shell. At the system analysis stage, extended UML class diagrams are used for the semantic network which is frame based. The builder implementation is carried out using an UML sequence diagram. In this method, a flow chart is visually used to indicate the solution flow for the problem at hand. If the solution is in a form of a procedure sequence, the method hops from one frame to another. This method can thus be said to have a visual object-oriented ontology while the output mechanism constructor is knowledge-based.
Figure 2: Simulation of a WLAN using OPNET
The algorithm for the frame concept is as follows5;
𝐹𝐶=〈𝐹𝑁,𝐹𝑇,𝐴𝐼,𝐵𝑆𝑆,𝑆𝐿𝑆〉 𝑆𝐿𝑆=〈𝐶𝑆,𝐴𝑆〉
𝐶𝑆=〈�𝐶𝑁1,𝐶𝑅1�, (𝐶𝑁2,𝐶𝑅2) … … (𝐶𝑁𝑁,𝐶𝑅𝑁)〉
𝐴𝑆= {(𝐴𝑁1,𝑉𝑅1,𝐴𝑉1), (𝐴𝑁2,𝑉𝑅2,𝐴𝑉2) … …𝐴𝑁𝑚,𝑉𝑅𝑚,𝐴𝑉𝑚)}
In the above FC is the frame concept while FN is the frame name. FT is the frame type while AI is the application information.
Some of the techniques applied in artificial modelling techniques are the fuzzy logics and Artificial Neural networks6.
This modelling allows the on and off switching of base stations and the transport networks. If modelled for a particular region, if there is need to rent or construct a certain element, the parameters are changed.
HIERARCHICAL MODELLING APPROACH
For most intelligent systems design and modelling, the biggest bottleneck is conceptual analysis. The hierarchical system is a
methodological design used formally defining the system and decomposing it into tiers or blocks. At the top of the hierarchy, the tiers have the least comprehensive views. They only indicate the design system characteristics and common features. As the hierarchy lowers, details increase as the system is not taken as one unit but as sections of a block.
5Castillo, O., Xu, L., & Ao, S.-I. (2018.). Trends in Intelligent Systems and Computer Engineering. Guildford: Springer London.
Each of the tiers gives its own views about the system. A tier element, k-th, is taken as a k-1 th tier system7. Any advancement from tier to tier is directional. It can either be a top to down system, known as deductive descending or bottom up system known as inductive ascending. An example of this is using OPNET.
VII. STATISTICAL ANALYSIS OF A SIMULATED MODEL
There are three main methods used in the statistical analysis of a simulated model. Various improvements have been made to these methods to eliminate any erroneous conclusions. The analysis methods are8;
• point estimation technique- network packet delay and average link utilization
• Estimation of the intervals - this is for parameters determination using a certainty degree estimation
• Testing the hypothesis
VIII. FUTURE RESEARCH
There is minimal research on the development of non-linear models. The NARMAX model used to investigate this, indicated that the results displayed adaptive control mechanisms. This forms a great future research area9.
IX. CONCLUSION
There have been various developments in the modelling, simulation and analysis of a telecommunication network system. This has been done to overcome the complexity of distributed working environments such as grids, P2P networks and grids10. Parametric approaches have been undertaken to improve the robustness of the systems. This is done in bid to increase its versatility, correctness and capacity without burdening the actual telecommunication network. The various techniques used include hierarchical and intelligent modelling.
.
REFERENCES
[1] Juang, J., Huang, Y.-C., & International Conference on Intelligent Technologies and Engineering Systems. (2013). Intelligent technologies and engineering systems. New York, NY: Springer.
[2] International Conference on Trends in Information, Telecommunication and Computing, & Das, V. V. (2017). Proceedings of the third International Conference on Trends in Information, Telecommunication and Computing. New York, NY: Springer.
[3] In Hilt, B., In Berbineau, M., In Vinel, A., & In Pirovano, A. (2017). Networking simulation for intelligent transportation systems: High mobile wireless nodes.
[4] Gupta, A., Galler, B. A., University of Michigan., & University of Michigan. (2017). Modelling a system architecture. Ann Arbor, MI: University of Michigan, Transportation Research Institute.
[5] Castillo, O., Xu, L., & Ao, S.-I. (2018.). Trends in Intelligent Systems and Computer Engineering. Guildford: Springer London. [6] Flood, J. E. (2015). Telecommunication networks. Stevenage, Eng: P. Peregrinus on behalf of the Institution of Electrical Engineers.
7Mitrani, I. (2017). Modelling of computer and communication systems. Cambridge [Cambridgeshire: Cambridge University Press
8IEE Seminar and Exhibition on Simulation and Modelling of Satellite Systems, Institution of Electrical Engineers. & IEE Professional Networks.
(2016). Simulation & modelling of satellite systems: Tuesday, 23 April 2002, IEE Savoy Place, London, WC2 0BL. London: Institution of Electrical Engineers.
9Lamers, E. (2018). Contributions to simulation speed-up: Rare event simulation and short-term dynamic simulation for mobile network planning.
Wiesbaden: Vieweg
10IEEE International Workshop on Computer Aided Modelling and Design of Communication Links and Networks, & Institute of Electrical and
[7] Mitrani, I. (2017). Modelling of computer and communication systems. Cambridge [Cambridgeshire: Cambridge University Press.
[8] IEE Seminar and Exhibition on Simulation and Modelling of Satellite Systems, Institution of Electrical Engineers. & IEE Professional Networks. (2016). Simulation & modelling of satellite systems: Tuesday, 23 April 2002, IEE Savoy Place, London, WC2 0BL. London: Institution of Electrical Engineers. [9] Lamers, E. (2018). Contributions to simulation speed-up: Rare event simulation and short-term dynamic simulation for mobile network planning.
Wiesbaden: Vieweg