International Journal of Emerging Technology and Advanced Engineering
Website: www.ijetae.com (ISSN 2250-2459, ISO 9001:2008 Certified Journal, Volume 4, Issue 8, August 2014)
Study and Optimization of Performance Parameters of
Air-Conditioner by Using Waste Water of Water-Cooler
Nikhil Sharma
1, Jujhar Singh
2Mechanical Engineering Department, Rayat-Bahra Institute of Engineering & Bio-Technology, Kharar, Distt. Mohali, Punjab, India.
Abstract- Reduction of energy consumption and rise of
cooling is a major concern in the air conditioning system especially in the area with very hot weather conditions. In hot weather conditions, the air conditioner takes more electrical power consumption to bring the comfort in specified area. In many Middle East countries, the atmospheric temperature approaches 40°C to 50°C or sometimes higher. During these temperature conditions, the air conditioner compressor continuously works and consumes more electrical power. On the other hand, the waste water of water cooler is drained out freely in atmosphere. This waste water generally leaves at its minimum to maximum temperature which is shear wastage of energy. These two areas are identified where the compressor is working continuously due to more temperature of condenser environment. To extract the energy from the wastage, a combination of air conditioner and water cooler is purposed in the present investigation. The waste water of water cooler can be sprayed on the condenser of air conditioner so that efficiency of air conditioner can be increased. To investigate the effect, Drip Rate, Drip Position and Fan Speed were taken as process parameters whereas Amperage, Sucking Temperature and Humidity were taken as response parameters. In this experiment, L9 orthogonal array was used. Results show that the effect of running amperage is found to affect the performance significantly & its low value for optimum performance is recommended.
Keywords- Humidity, power consumption, running
amperage, sucking temperature, window-air-conditioner.
I. INTRODUCTION
Air condenser is generally used in small size residential air conditioners like window or split type, for heat rejection process in the cycle. The reason is to make the system as simple as possible without any need to the water connection line and other equipments. This idea seems reasonable as far as the air temperature in summer is moderate and not too high (about 40 °C). But when the air temperature increase and approach 50 °C or higher, as it happens in many Middle East countries, the performance of the air condenser drops down and the air conditioner works improperly since the temperature and the pressure of the condenser increase and the compressor is forced to work under the greater pressure ratio, which results in more power consumption.
Another problem which was reported with application of water-coolers is related to the waste cool water ejecting through the drain pipe. The water-coolers are used for drinking purposes at offices, schools, colleges, govt. buildings etc., so after drinking, the waste cool water ejects through the drain pipe into the gutters or severage holes. Which directly means that the wastage of energy. In order to prevent this problem the waste cool water is required to use so that we can use energy at somewhere useful work.
It is generally believed that the coefficient of performance (COP) of an air conditioner decreases about 2–4% by increasing each °C in condenser temperature [1]. So the COP of an air conditioner could drop down as much as 40% in hot weather condition. This large reduction of COP means more electric power consumption for air conditioners in summer when the demand for electric power is already high and the increase in power consumption of air conditioners create more pressure on the power network which is not desirable. Therefore, it is very important to decrease the power consumption of air conditioners in very hot ambient temperature. To do this, it is required to decrease the temperature of the ambient air before it passes over the condenser coil, in order to decrease temperature and pressure of the condenser. The simple and cheapest way for cooling the ambient air temperature is employing the evaporative cooling system. This could result in significant energy and demand savings overall since there are millions of air conditioners in the residential sector and any small reduction in power consumption of an air conditioner could save huge amount of megawatt in the network.
International Journal of Emerging Technology and Advanced Engineering
Website: www.ijetae.com (ISSN 2250-2459, ISO 9001:2008 Certified Journal, Volume 4, Issue 8, August 2014)
514 Hajidavalloo [5] investigated the effect of evaporative cooling of window- air-conditioner by injecting water directly on the condenser and reported 10% reduction in power consumption. Although the problem in air conditioner performance in very hot weather condition have been reported for long time but there is little work to address the problem and offer appropriate solution. There are many questions about the ways of applying evaporative cooling in the system and also the amount of expected improvement in COP after retrofitting especially in very hot weather condition. In order to specify the best arrangement and optimum design of evaporative cooling in the residential air conditioner, much works are required. In this work an experimental study and investigation was performed to optimize performance parameters of air-conditioner by using waste water of water-cooler in a 1 ton window-air-conditioning system in very hot weather condition
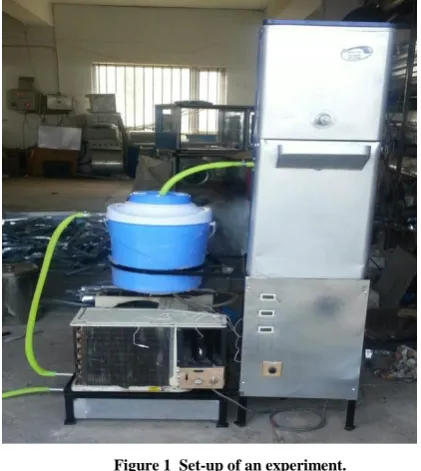
[image:2.595.316.527.406.642.2]II. SYSTEM DESIGN AND EXPERIMENT SET-UP Different designs for applying evaporative cooling in an existing residential air conditioner could be introduced. Concern should be taken to employ a design with best performance and minimum side effects. In present investigation, the main focus was on the flow of waste cool water on the condenser of an air-conditioner and then performance of an air-conditioner. Also, the effects to be studied by correlating it with the other process parameters i.e. drip rate, drip position and fan speed are given in table 1. The response parameters, on which its effects are to be measured is running amperage, sucking temperature from room and humidity is shown in table 2.
TABLE 1 PROCESS PARAMETERS
Parameters Symbol
Drip Rate ml/sec
Drip Position %
Fan Speed r.p.m
TABLE 2 RESPONSE PARAMETERS
Parameters Symbol
Running Amperage A
Sucking Temp. °C
Humidity %
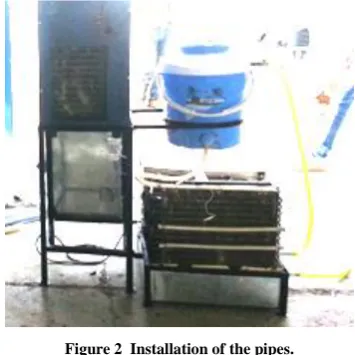
In this method, the waste cool water which is ejected through the drain pipe is stored in the insulated water tank which is of 27 liters, so that if the water-cooler stop working or the supply of water may stopped, so there would be no chance of affecting the performance of an air-conditioner is injected in the pipes and sprayed through the holes of the pipe which is located over the condenser and provides cooling effect by evaporation of water. The overflow tank is also placed below the air-conditioner so that over-flowed water directly comes to the tank. Pipes were varying by the 11, 9 and 7 holes. The places where the pipes should be installed is an important aspect of the design. The pipes should be placed where it gives the best cooling performance and also takes minimum space from air conditioner. Since the window-air-conditioners are designed to have minimum space, therefore the limitation of space should be considered in the design. In this work 3 pipes, each with 17 cm length were installed at 100%, 50% and 25% area of the condenser. The speed of the fan motor is controlled with the help of fan regulator so that the speed of the motor can vary easily. Fig. 1 below shows the set-up of an experiment.
Figure 1 Set-up of an experiment.
[image:2.595.60.270.528.693.2]International Journal of Emerging Technology and Advanced Engineering
Website: www.ijetae.com (ISSN 2250-2459, ISO 9001:2008 Certified Journal, Volume 4, Issue 8, August 2014)
[image:3.595.322.542.135.426.2]Many preliminary experiments were performed to prepare the set up for getting reliable data. The time difference between the experiments was small, so the weather condition for the experiments was the same. In all experiments the data were recorded after steady state condition was established.
Figure 2 Installation of the pipes.
The Taguchi Array along with parameters assigned to various columns. The plan of experiment is shown in Table 3. The experiments were conducted according to Taguchi orthogonal array. This helps in reducing the number of experiment. In the present work 4 parameters considered for experimental study. Optimization for response parameters was carried out with signal to noise ratio converted to lower the better characteristics and analysis of variance (ANOVA).The signal to noise ratio (S/N ratio) is a statistic that combines the mean and variance.
10
log
MSD
LB
LB
N
S
Where,
R1 j
2 j
LB
y
R
1
M SD
TABLE 3
L9 TAGUCHI ARRAY WITH PARAMETERS AND RESULT
Ex
p
.
N
o
.
Dr
ip
Ra
te
(m
l/
se
c)
Dr
ip
Po
siti
o
n
(%)
Fa
n
S
p
ee
d
(r
.p
.m
)
Run
n
in
g
Am
p
er
a
g
e(
A
)
S
u
ck
in
g
Te
m
p
.
(°C)
H
u
m
id
it
y
(%)
1. 1015 25 650 5.3 29.8 89
2. 1015 50 721 5.8 31.2 82
3. 1015 100 930 4.5 30.7 80
4. 1035 25 721 5.2 30.9 84
5. 1035 50 930 5.3 31.9 59
6. 1035 100 650 5.8 31.1 79
7. 1051 25 650 4.8 30.7 89
8. 1051 50 930 4.5 29.8 51
9. 1051 100 721 5.3 31.1 82
Since the study involves 4 parameters, a L9(3³) Taguchi array is used for the analysis and various parameters are assigned to various columns as per requirement to study main effect.
III. ANALYSIS OF RESULT
After performing experiment parameter are optimized by using Minitab software. Here Minitab 16 is used to optimize performance and response parameters. It is evident from the Fig. 3 that running amperage is minimum, if drip rate of water should be 1051 ml and dripped at 25% level of the condenser and also fan speed should be 930 r.p.m.
TABLE 3
RESPONSE TABLE FOR MEANS
Level Drip Rate Drip Position
Fan Speed
1 83.67 87.33 82.67 2 71.33 71.00 82.67 3 83.67 80.33 73.33
Delta 12.33 16.33 9.33
[image:3.595.74.252.210.388.2]International Journal of Emerging Technology and Advanced Engineering
Website: www.ijetae.com (ISSN 2250-2459, ISO 9001:2008 Certified Journal, Volume 4, Issue 8, August 2014)
[image:4.595.322.542.210.354.2]516 The fig. 4 clearly shows that the air-conditioner sucking the nominal temperature, if the drip rate of water should be 1051 ml and dripped at 50% position of the condenser and the fan speed is 721 r.p.m and the evidence are clearly shown from the fig. 5 that humidity decreases, if the drip rate of water should be 1035 ml dripped at 50% level of the condenser and the fan speed is 930 r.p.m.
TABLE 4
ANALYSIS OF VARIANCE FOR MEANS
P a ra m ete rs D.F . S eq . S S Adj. S S Adj. MS F v a lu e P v a lu e Re m a rk Drip Ra te
2 27.8 2
27.8 2
13.9 08
1.76 0.36 2 S ig n if ica n t
Drip Po
siti
o
n
2 41.7 3
41.7 3
20.8 67
2.65 0.27 4 Mo st S ig n if ica t nt F an S p ee d
2 19.5 5
19.5 5
9.77 4
1.24 0.44 6 No n S ig n if ica n t Re sid u a l Er ro r
2 15.7 6 15.7 6 7.88 2 To ta
l 8 104.
86
[image:4.595.51.273.235.669.2]S = 2.808 R-Sq = 85.0%
TABLE 5
RESPONSE TABLE FOR S/N RATIO
Level Drip Rate Drip Position
Fan Speed
1 38.44 38.82 38.33 2 36.86 36.83 38.35 3 38.44 38.10 37.07
Delta 1.58 1.99 1.28
Rank 2 1 3
The ANOVA for the means of experiment is given in Table 5. It is evident from the ANOVA for means data that Drip Position is most significant parameter affecting variability of running amperage and it’s F-value is 2.65 in running amperage, sucking temperature and humidity.
Drip Rate is found to be significant when compared to drip position gives 1.76 F-value and Fan Speed gives very low of 1.24 F-value in process parameters.
It is clear that statistical model can predict the running amperage with sufficient accuracy depending on the obtained correlation coefficients (R² = 85%).
[image:4.595.321.544.380.505.2]Figure 3 Main Effects Plot for Means for Running Amperage.
Figure 4 Main Effects Plot for Means for Sucking Temperature.
[image:4.595.325.538.531.664.2]International Journal of Emerging Technology and Advanced Engineering
[image:5.595.60.270.136.433.2]Website: www.ijetae.com (ISSN 2250-2459, ISO 9001:2008 Certified Journal, Volume 4, Issue 8, August 2014)
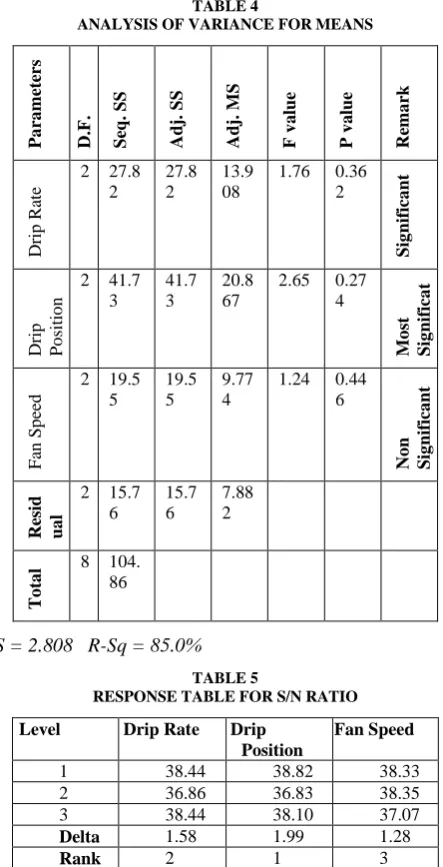
Figure 6 Main Effects Plot for SN Ratios.
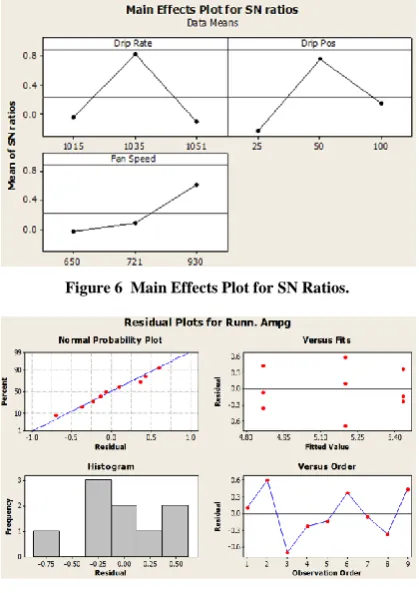
Figure 7 Residual Plots for Running Amperage.
In figure no 7, Analysis is done for residuals to check the authenticity of accuracy as given above. The histogram of Frequency vs. residuals suggests that the residuals (and hence the error terms) are not normally distributed. On the contrary, the distribution of the residuals is quite skewed to the right.
Corresponding normal probability plot of the residuals also points to the condition that the error terms are normally distributed is not met. The relationship between the sample percentiles and theoretical percentiles is not linear.
Non-constant error variance shows up on a residuals vs. fits (or predictor) plot. Note that the residuals "fan out" from left to right rather than exhibiting a consistent spread around the residual = 0 line. The residual vs. fits plot suggests that the error variances are not equal.
TABLE 6
PARAMETERS AND OPTIMUM LEVEL (FOR RUNNING AMPERAGE ONLY)
Parameter Symbol Optimum Level
Drip Rate
ml/sec 1051 ml/sec Drip Position
% 50% Fan Speed 930 r.p.m
The Main effect plots are analysed & shown as above. Running amperage, sucking temperature and humidity is the main parameters that affect the performance & at a known performance the different parameters are analysed so that the optimum performance of the air-conditioner can be decided.
IV. RESULTS AND DISCUSSIONS
We are analysing the performance at a fixed flow rates. Following observations were made on the Running amperage, Sucking temperature and Humidity.
1. The height of the dripping pipe need not be unnecessarily very high. The Taguchi results shown at a known performance gave optimum height of the pipe where running amperage and humidity is minimum.
2. Drip rate of water should be as more as possible, but at a fixed performance under the constraints, the optimum drip rate of water was determined. The results showed that it is significant. It was noticed that running amperage and humidity varies with the drip rate of water and also is optimum at a certain known rate.
3. Speed of the fan does not have much effect on the performance of the system. The chances of shortage of fan motor will increase as it will lower the speed. It was noticed that for the same performance & known constraints the optimum speed of the fan is sufficient.
4. Drip Position is the single most dominant factors and contributes to 2.65% of F-value in variation of Running amperage.
V. CONCLUSIONS
International Journal of Emerging Technology and Advanced Engineering
Website: www.ijetae.com (ISSN 2250-2459, ISO 9001:2008 Certified Journal, Volume 4, Issue 8, August 2014)
518 REFERENCES
[1] Y.A. Cengel, M.A. Boles, 1998. Thermodynamics An
Engineering Approach, third ed., McGraw-Hill, Boston.
[2] R.J. Dossat, 1991. Principal of Refrigeration, Prentice Hall, New
Jersey.
[3] W.K. Brown, 1990. Fundamental concepts integrating evaporative
techniques in HVAC systems, ASHRAE Transactions 96 (Part 1) 1227–1235.
[4] D.Y. Goswami, G.D. Mathur, S.M. Kulkarni, 1993. Experimental
investigation of performance of a residential air conditioning system with an evaporatively cooled condenser, Journal of Solar Energy Engineering 115, 206–211.
[5] E. Hajidavalloo, 2001. Increasing COP of window air conditioner