International Journal of Emerging Technology and Advanced Engineering
Website: www.ijetae.com (ISSN 2250-2459,ISO 9001:2008 Certified Journal, Volume 3, Issue 3, March 2013)
477
Survey on Graph-Hierarchy Visualization Techniques
Akshata D. Deore
1, Prof. R. L. Paikrao
21M.E. Computer Engineering, AVCOE, Sangamner. Affiliated – University of Pune
2Associate Prof. and HOD of Computer Engineering, AVCOE, Sangamner. Affiliated – University of Pune
Abstract— A graph is now widely used in many real time applications. These applications require displaying graphs using computers. Small graphs can be easily displayed on screen. But graphs with much number of nodes and connecting edges are difficult to display. These graphs when arranged in a hierarchical structure are called as Tree. Visualization of this graph hierarchy is an important issue. This paper presents information about visualizing graphs using computers and a survey on graph hierarchy visualization technique. Two techniques are explained; Node-Link technique and Space-Filling technique.
Keywords—Display Graph, Graph Visualization, Hierarchical Structure, Node-Link, Space-Filling.
I. INTRODUCTION
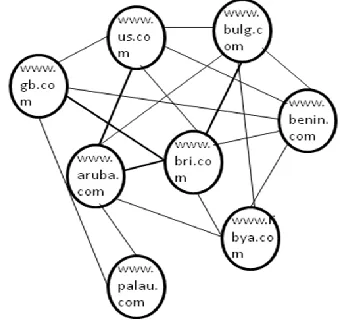
A Graph normally contains set of nodes and edges connecting those nodes. Many recent applications tend to use these graphs in real time scenario for various reasons. The relationship network uses graph to point out friends as nodes and relation of friends as nodes, the graph may be employed in macromolecule macromolecule Interaction information analysis so as to discover macromolecule complexes or discover the practicality of unknown proteins, molecular graphs of acyclic compounds square measure employed in Chemistry [1]. For these globe applications, a graph will include many nodes and thousands of edges. For instance, fig. 1 describes a graph containing web pages as nodes pointing to others with hyperlinks as edges. This graph includes a massive collection of nodes and edges between these web pages. During this form of scenario displaying an oversized graph on the screen becomes a significant concern. Excessive process demand is required and drawing these massive graphs could lead to untidy pictures that are hard to understand. Hence graph visualization grabs the attention of many programmers. It illustrates two major graph visualization problems [2]:
1.Too many pages to be displayed on a single screen
and the layout of such a large geometrical area cannot be good enough to show large graph.
2.The display may comprise unused area which results
[image:1.612.356.526.210.370.2]in inefficient utilization of display space.
Figure 1: Graph representing web page communication
To solve these problems many visualization techniques exist. This paper represents a survey of some of these hierarchical visualization techniques. Section II gives introduction of information visualization as a base of visualization techniques. Section III defines basic concept of Graph drawing. Study of hierarchical graph visualization techniques is given in Section IV and this paper is concluded in section V.
II. INFORMATION VISUALIZATION
Information Visualization is a part of data exploration. Data exploration is a technique which processes big amount of data, located in different databases to produce patterns, structures and other characteristics. This activity allows user to perform interactive examination to find out new information about complex data relationships. The science of visually representing the data which has been extracted in a diagrammatic form is called as Data Visualization [3].
Being a part of data exploration, information visualization concentrates on visualization techniques to organize digital data into some interactive graphical tool. Large set of data can be supplied to visualization system to get the meaning which may remain hidden when displayed
in other forms. Information
visualization works to
International Journal of Emerging Technology and Advanced Engineering
Website: www.ijetae.com (ISSN 2250-2459,ISO 9001:2008 Certified Journal, Volume 3, Issue 3, March 2013)
478
This represents large amount of information in the form of graphical model, which will provide us a different way to look at the same information.
Information visualization may reduces search by representing a large amount of data in a small space; enhances the recognition of patterns; supports the easy perceptual inference of relationships that are otherwise more difficult to induce; allows for the perceptual monitoring of a large number of potential events. Knowledge integration is one of the key features of information visualization. Large and complex data can be processed to extract knowledge and useful information. This knowledge will be applied in many areas of research.
A. Visual Analytics:
The science of analytical reasoning supported by the interactive visual interface is called as Visual Analytics [4]. The existing data is visualized in combination with automated analysis to have more impressive reasoning and understanding. Analytical reasoning is the key part for the task of applying human judgment to reach to the conclusion by merging assumptions and proofs.
III. GRAPH DRAWING
Graph drawing technique relates to the problem of locating a huge set of vertices and edges such that it will communicate the most possible meaning [5].It enables visualization of these sets of edges and vertices. Components of graph drawing are explained below:
1. Drawing Conventions:
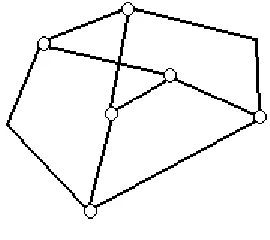
Keeping the control of drawing algorithms while making final drawing are drawing constraints [6]. For example a constraint for one graph does not allow bend in the final drawing but for another graph bend is allowed, only at right angles. Here, keeping track of bend for particular type is a drawing convention. Consider fig. 2 representing the bend constraint for different graphs:
a. Polyline Drawing
[image:2.612.105.240.588.708.2]b. Straight Line Drawing
Figure 2: Drawing Conventions
A poly line drawing permits to have as many bends in the edges as desired. Whereas, straight line drawing contains only straight lines therefore no bends are permitted.
2.Aesthetic criteria:
Different graphs can transform different level of information. A good graph will transform most of the possible information [7]. Aesthetic criteria describe the qualities and attributes to define a good graph. Criteria which determine a good graph are given below:
a. Minimize crossing – The number of lines crossing
should be minimum.
b. Minimize area – Minimize the graph representation
area by producing a compact graph
c. Minimize the sum of the edge lengths.
d. Obtain a uniform edge length – Each of the edges
should be at the same lengths.
e. Minimize bends – Number of bends should be
minimum.
3.Drawing Constraints:
Conditions placed on graph drawing while making the final graph layout are drawing constraints. It allows user to control the final outcome as well as it speeds up the process of graph drawing. The conditions are mentioned below:
Center – place a given vertex in the center
External – place a given vertex on the boundary
Cluster – place a group vertices together
Pre-arrange a path
Draw a subgraph with a certain shape
A. Graph Drawing Algorithms:
International Journal of Emerging Technology and Advanced Engineering
Website: www.ijetae.com (ISSN 2250-2459,ISO 9001:2008 Certified Journal, Volume 3, Issue 3, March 2013)
479
Topology-Shape-Metrics
Hierarchical
Augmentation
Force-Directed
Divide and Conquer
IV. VISUALIZATION TECHNIQUES
A. Hierarchical Representation of Graphs:
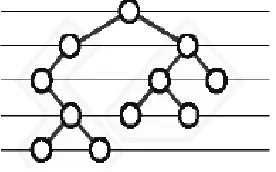
[image:3.612.100.231.339.430.2]A Graph is represented as hierarchical structures using Trees [8]. A Tree is a simple undirected connected graph with no cycles. A node which has no parent or ancestor is called as a Root Node and remaining node i.e. predecessors of that root are called as Children. A tree with this kind of relationship is called as a Rooted Tree. Fig. 3 shows a simple undirected acyclic graph which is also a rooted tree. A rooted tree shares parent-child relationship.
Fig. 3: An undirected acyclic Graph (Rooted Tree)
B. Techniques of Graph Visualization:
The hierarchical structure of a graph can be displayed using two methods. The first type is Node-Link technique and second type is Space-Filling technique. Both of these types and their respective tools are explained below:
1. Node-Link Technique:
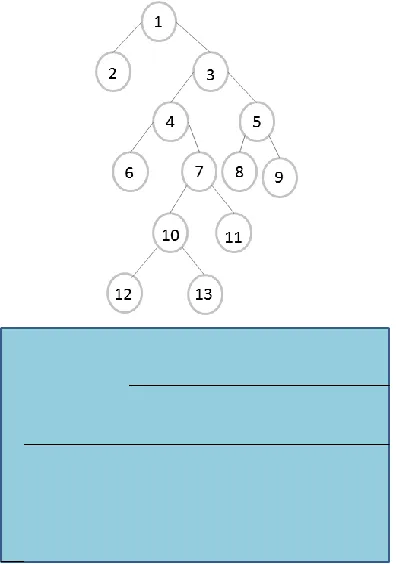
This technique uses a link to show relationship between nodes of a hierarchical graph. All the nodes in the graph are connected to other nodes which defines parent-child relations between theses visual objects [9]. This representation technique is simple to understand. Fig. 4 shows Node-Link representation. In this figure node 1 is the root or parent of the hierarchy and nodes 2 and 3 are the children. Node 2 and 3 are adjacent to each other or they belong to the same parent that is why they are also called as siblings of each other.
Figure 4: Node-Link Representation
[image:3.612.375.513.417.503.2]The best known algorithm to draw these structures on the screen is given by Reingold and Tilford [10]. The algorithm called as “Tidier Tree” algorithm is similar to divide-and-conquer strategy. It states that if a single node is present in the graph then draw that node, else apply the algorithm recursively to draw left and right sub trees. It checks the horizontal distance for each layer and stops scanning layers, if this distance is equal to 2 then places its root r vertically one level above and horizontally half way between its children. Fig. 5 roughly displays this process. The root is placed at distance 1 from the child when there is only one child. It produces Top-down as well as left-to-right tree layout. In this way the Node-Link visualization technique works.
Figure 5: Sub dividing a Graph into layers
Node-Link techniques are useful for visualizing small sparse graphs effectively [11]. When the graph tends to become complex in nature, the effectiveness of visualization reduces and use up screen space rapidly. The remarkable empty background space is created on the screen by this method. So scalability becomes an issue with complex graphs. Also interface is delayed because of cluttering and edge crossing problems.
Following tools uses Node-Link representation
techniques for visualizing graphs:
i.Tug Graph
ii. GrouseFlocks
International Journal of Emerging Technology and Advanced Engineering
Website: www.ijetae.com (ISSN 2250-2459,ISO 9001:2008 Certified Journal, Volume 3, Issue 3, March 2013)
480
The scalability problem of this technique can be solved using next technique.
2. Space-Filling Technique:
This technique replaces the links with spatial positions of nodes to represent the node relationship. This method tries to use complete area of the display screen to show hierarchies. Closeness or enclosure is used to calculate spatial positions [12].This makes maximum use of display space. In addition to this color and height can be added to show additional data attributes. Space-filing is achieved by juxtapositioning to state relationship. By placing the elements side by side makes full use of display space. Radial and Rectangular layout methods are mostly used for technique.
[image:4.612.390.496.245.535.2]In Rectangle space-filling technique, the display screen is subdivided into vertical and horizontal rectangular strips. This recursive division of a rectangle into slices is based on the subtree population at a given level. The hierarchy of information is conveyed using vertical and horizontal divisions also called as Slice and Dice operations. Fig. 6 shows example of this method. In this figure a simple hierarchy and its corresponding representation using rectangle space-filling technique is displayed.
Figure 6: A simple graph hierarchy and its corresponding space-filling representation
Another space-filling technique is Radial method. In this method root of the hierarchy is displayed in the center of the display and the layers of the hierarchy are shown as nested rings to the root. The ring is division is dependent on the nodes at that level. Color can be used as an additional attribute to display hierarchical relationship of parent and siblings using same color. Fig. 7 shows a simple graph hierarchy represented as a radial space-filling technique.
[image:4.612.70.269.414.696.2]
Figure 7: A simple graph hierarchy represented as a radial space-filling technique
Following tools uses Space-Filling representation techniques for visualizing graphs:
i.Tree-Maps
ii. DAG maps
V. CONCLUSION
International Journal of Emerging Technology and Advanced Engineering
Website: www.ijetae.com (ISSN 2250-2459,ISO 9001:2008 Certified Journal, Volume 3, Issue 3, March 2013)
481
There are mainly two visualization techniques explored in this paper, the non-space filling technique i.e. node-link technique and a space-filling technique. The node-link technique is simple but results in wastage of display screen’s space. Therefore a space-filling technique is developed. This technique utilizes full display space and solves the scalability issue of node-link method but it is complicated to implement.
REFERENCES
[1] Raga’ad M. Tarawneh, Patric Keller, and Achim Ebert, A General Introduction To Graph Visualization Techniques.
[2] Mao Lin Huang and Quang Vinh Nguyen, A Space Efficient Clustered Visualization of Large Graphs, Fourth International Conference on Image and Graphics.
[3] Diana Burley, “Information Visualization As A Knowledge Integration Tool”.
[4] T. von Landesberger, A. Kuijper, T. Schreck, J. Kohlhammer, J.J. van Wijk, J.-D. Fekete, and D.W. Fellner, Visual Analysis of Large Graphs: State-of-the-Art and Future Research Challenges, COMPUTER GRAPHICS Forum (1/2011).
[5] Ivan Herman, Guy MelancËon, and M. Scott Marshall, Graph Visualization and Navigation in Information Visualization: A Survey, IEEE TRANSACTIONS ON VISUALIZATION AND COMPUTER GRAPHICS, VOL. 6, NO. 1, JANUARY-MARCH 2000
[6] Isabel F. Cruz, Roberto Tamassia, Graph Drawing Tutorial. [7] Andy Pavlo, Interactive, Tree-Based Graph Visualization, March 17,
2006.
[8] Danny Holten, Hierarchical Edge Bundles: Visualization of Adjacency Relations in Hierarchical Data, IEEE TRANSACTIONS ON VISUALIZATION AND COMPUTER GRAPHICS, VOL. 12, NO. 5, SEPTEMBER/OCTOBER 2006.
[9] Node-Link- Niklas Elmqvist, Thanh-Nghi Do, Howard Goodell, Nathalie Henry, ZAME: Interactive Large-Scale Graph Visualization, IEEE Pacific Visualisation Symposium 2008 4 - 7 March, Kyoto, Japan.
[10] EDWARD M. REINGOLD AND JOHN S. TILFORD, Tidier Drawings of Trees, IEEE TRANSACTIONS ON SOFTWARE ENGINEERING, VOL. SE-7, NO. 2, MARCH 1981.
[11] Node-Link- Michael Zinsmaier, Ulrik Brandes, Oliver Deussen, and Hendrik Strobelt, Interactive Level-of-Detail Rendering of Large Graphs , IEEE TRANSACTIONS ON VISUALIZATION AND COMPUTER GRAPHICS, VOL. 18, NO. 12, DECEMBER 2012. [12] Visualization Techniques for Trees, Graphs, and Networks, Chapter