International Journal of Emerging Technology and Advanced Engineering
Website: www.ijetae.com (ISSN 2250-2459, Volume 2, Issue 5, May 2012)204
Simulation Based Study of Routing Protocols in MANET
Using Different Scenarios and Traffic Pattern
Smita Singh
1, S.R.Biradar
2MITS University, Lakshmangarh, Rajasthan, India 1[email protected]
Abstract— Mobile ad hoc network (MANET) is an autonomous system of mobile nodes connected by wireless links. Each node operates not only as an end system, but also as a router to forward packets. The nodes are free to move about and organize themselves into a network. These nodes change position frequently. An important and essential issue for mobile ad hoc networks is routing protocol design that is a major technical challenge due to the dynamism of the network. The main classes of routing protocols are Proactive, Reactive and Hybrid. In recent years, a variety of routing protocols have been proposed and several of these have been already extensively simulated or implemented as well. This paper evaluates performance of two routing protocols, Ad hoc On-demand Multi-path Distance Vector (AOMDV) and Optimized Link State Routing (OLSR) routing protocols. We perform the analysis on three different performance metrics Average delay, Packet Delivery Ratio and Normalized Routing Load, using Network Model and Speed Model. Simulation is carried out using Ns-2.34.
Keywords— AOMDV, OLSR, MANET, NS-2, SIMULATION.
I. INTRODUCTION
A mobile ad hoc network (often referred to as MANET) is the one consisting of a collection of mobile nodes (MNs) sharing a wireless channel without any centralized control
or established communication backbone. Such networks
find applicability in military environments, wherein a platoon of soldiers of fleet of ships may construct an ad hoc network in the region of their deployment, as well as in non-military environments, such as classrooms and conferences room. Military network environments typically require quality-of-service (QoS) for their mission critical applications. In non-military environments, multimedia
applications also require routes satisfying QoS
requirements. Ad hoc networks have no fixed routers; all nodes are capable of movement and can be connected dynamically in an arbitrary manner. Usually, these nodes act as both end systems and routers at the same time. Nodes of these networks, which function as routers, discover and maintain routes to other nodes in the network.
The topology of the ad hoc network depends on the transmission power of the nodes and the location of the MNs, which may change with time. A working group namely ‗‗MANET‘‘ has been formed by the Internet Engineering Task Force (IETF) to study the related issues
and stimulated research in MANET [1]. A fundamental
problem in ad hoc networking is how to deliver data packets among MNs efficiently without predetermined topology or centralized control, which is the main objective of ad hoc routing protocols. Since mobile ad hoc networks change their topology frequently, routing in such networks is a challenging task. So far, much work has been done on routing in ad hoc networks. The routing protocol has two primary functions: selection of an appropriate route, Delivery of packet to its correct Destination. Routing protocols in MANET are based on the way the routing information is maintained by mobile nodes. The routing protocols are mainly classified in two types: Proactive and Reactive [2]. Proactive Protocols keep track of routes for all destinations in the ad hoc network are called Proactive protocols or Table-driven Protocols, as the routes can be assumed to exist in the form of tables. The main advantage is that Communications with arbitrary destinations experience minimal initial delay from the point of view of the application. The Disadvantages of proactive protocols is that Additional control traffic is needed to continually update stale route entries. Some of the Proactive Routing Protocols are: Optimized Link State Routing Protocol (OLSR), Fish-Eye State Routing (FSR), Destination Sequenced Distance Vector (DSDV), and Cluster Head
Gateway Switch Routing Protocol (CGSR). Reactive
International Journal of Emerging Technology and Advanced Engineering
Website: www.ijetae.com (ISSN 2250-2459, Volume 2, Issue 5, May 2012)205
Some of the Reactive Routing Protocols are: Ad-hoc On Demand Distance Vector (AODV), Dynamic Source Routing (DSR), Temporally Ordered Routing Algorithm (TORA), Associativity Based Routing (ABR) and many more algorithms.
Goal of this paper is to study and evaluate the performance of two prominent routing protocols of MANET, AOMDV and OLSR. To evaluate performance simulation is carried over two models, Network model, varying number of nodes and Speed model, varying moving speed of nodes. Performance metrics used for evaluation are packet delivery ratio, average delay and normalized routing load.
The remainder of this paper is organized as follows. Section II discusses AOMDV and OLSR routing protocols. Section III describes the simulation using Ns-2. Section IV discusses the simulation results of the two routing protocols with different backgrounds, Network model and Speed model. Finally, we conclude our paper in section V.
II. BACKGROUND
A. Ad-hoc On-demand Multipath Distance Vector Routing (AOMDV)
Ad hoc On-demand Multipath Distance Vector (AOMDV) [3] is an extension to the AODV protocol for computing multiple loop-free and link-disjoint paths. To keep track of multiple routes, the routing entries for each destination contain a list of the next-hops along with the corresponding hop counts. All the next hops have the same sequence number. For each destination, a node maintains the advertised hop count, which is defined as the maximum hop count for all the paths. This is the hop count used for sending route advertisements of the destination. Each duplicate route advertisement received by a node defines an alternate path to the destination. To ensure loop freedom, a node only accepts an alternate path to the destination if it has a less hop count than the advertised hop count for that destination. Because the maximum hop count is used, the advertised hop count therefore does not change for the same sequence number. When a route advertisement is received for a destination with a greater sequence number, the next-hop list and advertised hop count are reinitialized. AOMDV can be used to find node-disjoint or link disjoint routes. To find node-disjoint routes, each node does not immediately reject duplicate RREQs. Each RREQ arriving via a different neighbour of the source defines a node-disjoint path. This is because nodes cannot broadcast duplicate RREQs, so any two RREQs arriving at an intermediate node via a different neighbour of the source could not have traversed the same node.
In an attempt to get multiple link-disjoint routes, the destination replies to duplicate RREQs, the destination only replies to RREQs arriving via unique neighbours. After the first hop, the RREPs follow the reverse paths, which are node-disjoint and thus link-disjoint. The trajectories of each RREP may intersect at an intermediate node, but each takes a different reverse path to the source to ensure link-disjointness.
B. Optimized Link State Routing Protocol (OLSR)
International Journal of Emerging Technology and Advanced Engineering
Website: www.ijetae.com (ISSN 2250-2459, Volume 2, Issue 5, May 2012)206
To forward data traffic, a node selects its one hop symmetric neighbours, referred to as MPRset that covers all nodes that are two hops away. The MPRset is calculated from information about the node‘s symmetric one hop and two hop neighbours. This information in turn is extracted from HELLO messages. Similar to the MPRset, a MPR Selectors set is maintained at each node. A MPR Selector set is the set of neighbours that have chosen the node as a MPR. Upon receiving a packet, a node checks its MPR Selector set to see if the sender has chosen the node as a MPR. If so, the packet is forwarded, otherwise the packet is processed and discarded. Although the proactive nature of the routing protocols provides all routing information to all nodes in the network, they need to send periodic control message throughout the entire network, leading to the power, bandwidth and memory usages.
III. SIMULATION USING NS-2
We have used Network Simulator (NS)-2 in our evaluation. The NS-2 is a discrete event driven simulator developed at UC Berkeley. NS-2 is suitable for designing new protocols, comparing different protocols and traffic evaluations. It is an object oriented simulation written in C++, with an OTcl interpreter as a frontend. Simulation of protocols is performed on Linux operating system using ns-2.34.We have different simulations run in all over. Every simulation runs from 0s to 100s. Random waypoint mobility in a rectangular field of 500m * 500m is used. Traffic and mobility files are imported in TCL script at the time of execution. AOMDV and OLSR maintain send buffer of packets. All the data packets waiting for route are kept in send buffer. Interface queue maximum size is 50 packets. Simulation Methodology is described below:
A. Simulation Methodology
The Following steps are performed to carry out simulation process of above mentioned protocols.
Scenarios are generated using the setdest utility mentioned above which uses random waypoint mobility model. Here in this simulation 10 scenarios are generated varying maximum number of nodes and moving speed of node. Example to generate scenario is given as:
setdest -v1 -n 50 - p5 - m 4 -t 100 -x 500 -y 500 > scene5
Where -v : version 1 or 2 , -n: number of nodes , -p : pause time , -m : maximum speed , -x and - y : area of simulation, -t : simulation time , scene-5-5 : output file.
Traffic pattern is generated using cbrgen.tcl file given in indep utilities. In this simulation only one traffic pattern is generated using the following method:
ns cbrgen.tcl - type cbr -nn 50 - seed 1- mc 10 - rate 0.25
Where - type: type of traffic cbr or tcp, - nn: number of nodes, - seed: seed value, -mc: maximum connection sources, -rate: rate of sending packets.
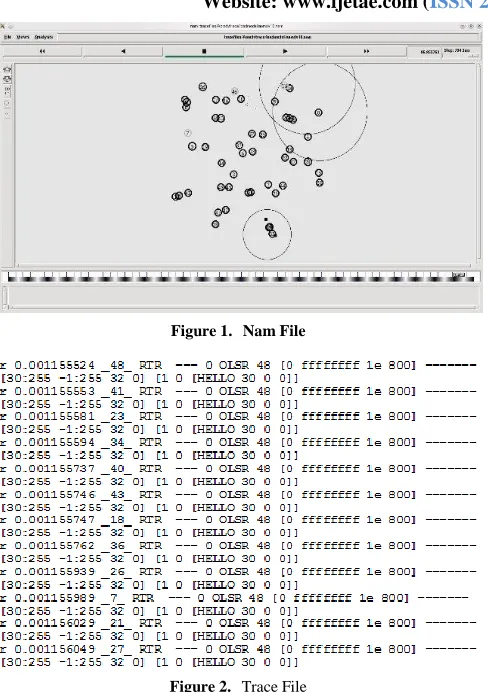
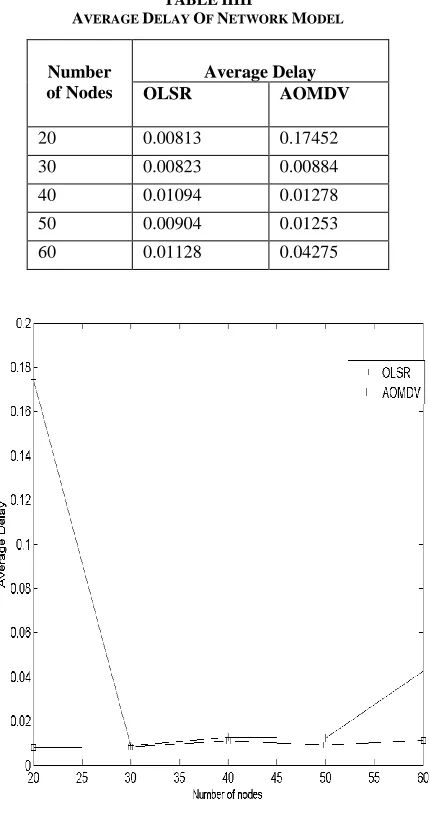
After generating traffic patterns and scenarios a tcl script is written for the generation of trace files. These created traffic patterns and scenarios are fed in to tcl script and then executed. On execution of tcl script trace files are generated. In this simulation two protocols namely AOMDV and OLSR are used to generate trace files which are saved with the extension *.tr which are old trace file formats. There are two trace file formats available one is old trace file format and other is new trace file format. With the generation of trace file a *.nam file is also generated which shows the animation of the moving nodes and routing of packets. Routing of packets and movement of nodes can be easily depicted by *.nam files.
When trace files are generated then it is needed to
analyse these files. To analyse the files awk or
perl scripts are written according to the
performance metrics which are to be used in the performance evaluation. This simulation is performed to evaluate the performance based on the three metrics namely Packet delivery ratio, Average delay and Normalized Routing Load. So three awk files are used for this simulation.
After the analysis of trace files the obtained results are stored in a text file or excel file then presented by the graphs using Matlab or Xgraph utility of ns-2. Here analysed result is stored in text file and then presented with the help of graphs.
International Journal of Emerging Technology and Advanced Engineering
Website: www.ijetae.com (ISSN 2250-2459, Volume 2, Issue 5, May 2012) [image:4.612.49.293.124.470.2]207
Figure 1. Nam File
Figure 2. Trace File B. Performance Metrics
Packet delivery ratio – It is the ratio of data packets delivered to the destination to those generated by the sources. It is calculated by dividing the number of packet received by destination through the number packet originated from source.
PDR = (Total number of Packets received/Total number of Packets sent)*100.
Average Delay - This includes all possible delay caused by buffering during route discovery latency, queuing at the interface queue, retransmission delay at the MAC, propagation and transfer time. It is defined as the time taken for a data packet to be transmitted across an MANET from source to destination.
D = (Receive time – Sent time) / total number of data packets received.
Normalized Routing Load - Number of routing
packets ―transmitted‖ per data packet ―delivered‖ at destination.
C. Testing Models And Simulation Parameters
Title Two types of testing models are used for the simulation which are defined below –
Network Model – varying maximum number of nodes but node‘s speed, transmission rate, pause time and maximum connections are kept constant. Speed Model – varying moving speed of nodes but
pause time, maximum connections, Packet sending rate and number of nodes are kept constant.
Simulation Parameters used for these two models are shown in ―Table I‖.
TABLEI SIMULATION PARAMETERS Parameters Values Routing Protocols AOMDV,OLSR Number of Nodes 20,30,40,50,60
Simulation Time 100sec
Pause Time 0
Environment Size 500*500 Transmission Range 250m
Traffic Type CBR(constant bit rate) Packet Size 512 Bytes
Packet Rate 4 Packets/sec Max. Connections 5
Maximum Speed 5,10,15,20,25 m/s Queue Length 50
Mobility Model Random Waypoint Antenna type Omni-Directional
IV. SIMULATION RESULT AND ANALYSIS
Results for the above mentioned simulation is presented here with help of graphs using Matlab. Graphs are
generated for both Load model and Flow model. There are
three graphs generated for each model using performance metrics packet delivery ratio and average end to end delay
.
A. Network Model
International Journal of Emerging Technology and Advanced Engineering
Website: www.ijetae.com (ISSN 2250-2459, Volume 2, Issue 5, May 2012)208
Graphical results are obtained for packet delivery ratio versus maximum number of nodes, Average delay versus maximum number of nodes and Normalized Routing load versus maximum number of nodes.
Packet Delivery Ratio: Here in this Fig.3 it is shown that the packet delivery ratio of OLSR protocol is more than that of AOMDV. Although AOMDV supports multiple paths between a source and destination, it is difficult to recover the packets during the time between the failure of a primary route and the finding of an alternative route. On the other hand, as OLSR nodes always have routes in hand due to its proactive nature, it increases packet delivery ratio significantly.
Values obtained for packet delivery ratio of both protocols after performing simulation are shown in ―Table II‖ below. Based on these values graph is designed.
TABLEIII
PACKET DELIVERY RATIO OF NETWORK MODEL
Number of Nodes
Packet Delivery Ratio
OLSR AOMDV
20 95 93.57
30 95.89 91.67
40 97.92 94.44
50 97.83 93.79
60 87.84 81.24
Figure 3. Number of Nodes Vs.PDR
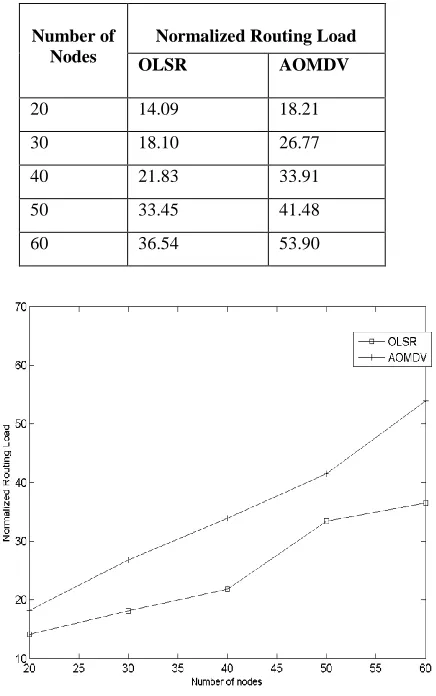
Average Delay: A: In Fig.4 AOMDV shows more delay than the OLSR protocol as the maximum number of nodes is varied. Delay is more in AOMDV due to the fact that if a link break occurs in the current topology, it would try to find an alternate path from among the backup routes between the source and the destination node pairs resulting in additional delay to the packet delivery time.
Values obtained for Average Delay of both protocols after performing simulation are shown in ―Table III‖ below. Based on these values graph is designed.
TABLEIIIII
AVERAGE DELAY OF NETWORK MODEL
Number of Nodes
Average Delay
OLSR AOMDV
20 0.00813 0.17452
30 0.00823 0.00884
40 0.01094 0.01278
50 0.00904 0.01253
60 0.01128 0.04275
[image:5.612.340.555.264.671.2] [image:5.612.65.280.351.701.2]International Journal of Emerging Technology and Advanced Engineering
Website: www.ijetae.com (ISSN 2250-2459, Volume 2, Issue 5, May 2012)209
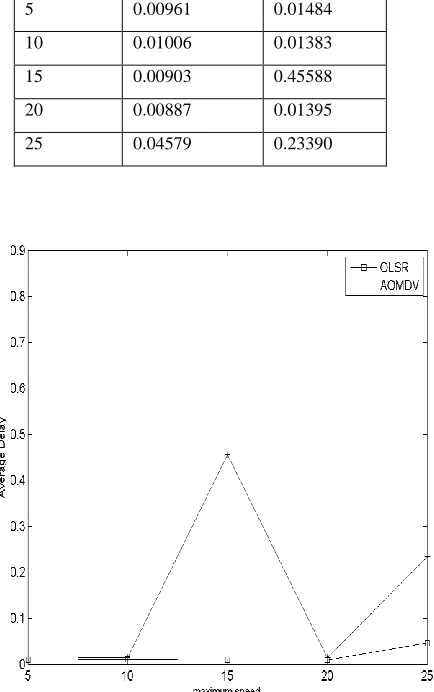
Normalized Routing Load: In Fig.5 AOMDV shows more load than OLSR as the number of nodes are varied. OLSR shows lower load due to its proactive behaviour.Variation in normalized routing load of both the protocols is obtained more.Protocol having low Normalized Routing Load is considered better protocol.Values obtained for Normalized Routing load is shown in ―Table IV‖ for both protocols.
TABLEIVV
NORMALIZED ROUTING LOAD OF NETWORK MODEL
Number of Nodes
Normalized Routing Load
OLSR AOMDV
20 14.09 18.21
30 18.10 26.77
40 21.83 33.91
50 33.45 41.48
60 36.54 53.90
Figure 5. Number of Nodes Vs. Nrl
B. Speed Model
In this model moving speed of nodes is varied and rests of parameters are kept constant. Value of speed is varied from 5 to 25 m/sec and Pause time is kept constant at 0sec.
Graphical results are obtained for packet delivery ratio versus maximum speed ,Average Delay versus maximum speed and normalized routing load versus maximum speed. Packet Delivery Ratio: It is clear from the Fig. 6 that in speed model OLSR shows better packet delivery ratio as compared to AOMDV routing protocol. As the maximum moving speed of node is varied from 5 to 25 m/sec, a lot of variation is determined in protocols, OLSR and AOMDV. Values obtained after performing simulation are shown in ―Table V‖ for both protocols.
TABLEV
PACKET DELIVERY RATIO OF SPEED MODEL
Maximum Speed
Packet Delivery Ratio
OLSR AOMDV
5 96.67 93.10
10 94.00 93.06
15 92.52 90.41
20 91.67 89.86
25 93.06 88.74
[image:6.612.67.285.260.608.2] [image:6.612.348.566.266.672.2]International Journal of Emerging Technology and Advanced Engineering
Website: www.ijetae.com (ISSN 2250-2459, Volume 2, Issue 5, May 2012)210
Average Delay: In case of speed model also delay of AOMDV is noticed more than OLSR in Fig. 7.As the maximum speed of moving node is varied 5 to 25 m/sec the delay shown by AOMDV protocol is higher than the OLSR protocol. So according obtained values OLSR delivers packets faster than AOMDV without having delay. Values obtained for Average delay of both protocols are shown in ―Table VI‖.
TABLEVI
AVERAGE DELAY OF SPEED MODEL
Maximum Speed
Average Delay
OLSR AOMDV
5 0.00961 0.01484
10 0.01006 0.01383
15 0.00903 0.45588
20 0.00887 0.01395
25 0.04579 0.23390
Figure 7. Speed (m/sec) Vs. Delay
Normalized Routing Load: In Fig.8 AOMDV shows more load than OLSR as the maximum speed of nodes is varied.
OLSR shows lower load due to its proactive
behaviour.Variation in normalized routing load of both the protocols is obtained more.Values obtained for Normalized Routing load is shown in ―Table VII‖ for both protocols.
TABLEVII
NORMALIZED ROUTING LOAD OF SPEED MODEL
Maximum Speed
Normalized Routing Load
OLSR AOMDV
5 28.93 42.46
10 29.21 43.11
15 30.06 41.83
20 32.29 44.09
25 29.97 44.35
Figure 8. Speed (m/sec) Vs. Delay
V. CONCLUSION
[image:7.612.342.555.228.644.2] [image:7.612.68.285.306.652.2]International Journal of Emerging Technology and Advanced Engineering
Website: www.ijetae.com (ISSN 2250-2459, Volume 2, Issue 5, May 2012)211
Earlier MANET protocols did not focus on the quality of service but the recent applications like multimedia has impressed the importance of quality of service in MANET. The study has been done by comparing two routing protocols AOMDV and OLSR. The parameters studied include average delay,packet delivery ratio and Normalized Routing Load. The results were analyzed using simulation method and NS-2.34 Simulator was used for the analysis. Simulation was carried on varying number of maximum nodes and varying moving speed of nodes or we name them as network model and speed model. In both the models it was noticed that OLSR shows better result as compared to AOMDV. Average delay is shown less in both models for OLSR than AOMDV,normalized routing load is also less in OLSR so it is better than AOMDV and in case of packet delivery ratio also OLSR gives better result in both models than AOMDV. So it is concluded that OLSR protocol should be preferred over AOMDV. In future other protocols can also be used for simulation to study their performance .
REFERENCES
[1] IETF MANET Charter. Available from:
http://www.ietf.org/html.charters/manet-charter.html.
[2] Elizabeth.M.Royer, C-K.Toh,‖A Review of Current Routing Protocols for Ad-hoc Mobile Wireless networks‖, IEEE personal
communication, pp.46-55, April 1999.
[3] M.K. Marina and S.R. Das, On-demand multipath distance vector routing in ad hoc networks, in: Proceedings of the 9th IEEE International Conference on Network Protocols (ICNP), 2001, pp.14–23.
[4] T. Clausen and P. Jacquet ―Optimized Link State Routing Protocol (OLSR).‖ RFC 3626, IETF Network Working Group, October 2003.
[5] Abolhasam, M., Wysocki, T., & Dutkiewicz, E. (2004). A review of routing protocols for mobile adhoc networks. AdHoc Networks, 2(1), 1-22.
[6] C. E. Perkins, E. M. Royer, and S. Das, "Ad hoc On-Demand Distance Vector (AODV) Routing,‖ RFC 3561, (2003) IETF.
[7] T. Camp, J. Boleng, and V. Davies, A survey of mobility models for ad hoc network research, Wireless Communication and Mobile Computing Special Issue on Mobile Ad Hoc Networking: Research, Trends and Applications. 2 (2002) 483-502.
[8] L.R. Reddy, S. Raghavan, SMORT: scalable multipath on-demand routing for mobile ad hoc networks, Ad Hoc Networks 5 (2) (2007) 162-188.
[9] A. Munaretto, M. Fonseca, Routing and quality of service support for mobile ad hoc networks, Computer Networks 51 (11) (2007) 3142– 3156.
[10]D. Kim, J. Garcia and K. Obraczka, ―Routing Mechanisms for Mobile Ad Hoc Networks based on the Energy Drain Rate‖, IEEE Transactions on Mobile Computing. Vol 2, no 2, 2003, pp.161-173.
[11]H.D.Trung, W.Benjapolakul, P.M.Duc, ―Performance evaluation and comparison of different ad hoc routing protocols‖, Department of Electrical Engineering, Chulalongkorn University, Bangkok, Thailand, May 2007.
[12]VINT Group, ―Network Simulator Ns-2, source codes available: http://www.isi.edu/nsnam/ns.
[13]The ns Manual, formerly ns Notes and Documentation.
[14] V.D. Park and M.S. Corson, A highly adaptive distributed routing algorithm for mobile wireless networks, in: Proc. Of IEEE INFOCOM’97, Kobe, Japan (April 1997) pp. 1405–1413.