Electroencephalography Analysis Using Neural Network
and Support Vector Machine during Sleep
JeeEun Lee1, Sun K. Yoo2
1Graduate School of Biomedical Engineering, Yonsei University, Seoul, Korea
2Corresponding Author, Department of Medical Engineering, College of Medicine, Yonsei University, Seoul, Korea
Email: [email protected], [email protected]
Received 2013
ABSTRACT
The purpose of this paper is to analyze sleep stages accurately using fast and simple classifiers based on the frequency domain of electroencephalography(EEG) signal. To compare and evaluate system performance, the rules of Recht-schaffen and Kales(R&K rule) were used. Parameters were extracted from preprocessing process of EEG signal as fea-ture vectors of each sleep stage analysis system through representatives of back propagation algorithm and support vec-tor machine (SVM). As a result, SVM showed better performance as pattern recognition system for classification of sleep stages. It was found that easier analysis of sleep stage was possible using such simple system. Since accurate es-timation of sleep state is possible through combination of algorithms, we could see the potential for the classifier to be used for sleep analysis system.
Keywords: Sleep; Electroencephalography; Neural Network; Backpropagation Algorithm; SVM
1. Introduction
Sleeping is defined as a behavioral state where sur-roundings cannot be perceived and being non-reactive to stimulus. Study on sleeping is constantly being re-searched since the 1930s starting with the discovery of EEG and currently depending on the depth of sleeping, sleep stage has been divided. From the arousal state where the voluntary adjustment of eye movement is pos-sible, to the shallow sleeping state of phase 1 progressing through phase 4’s deep sleep, then through REM sleep stage to the dreaming state. During the REM sleep the status of the brain includes the low voltage EEG and has similar neural activity as awaken state but body muscles appears helpless. Humans repeat such sleeping state. Such sleeping takes up 1/3 of people’s daily lives and are closely related to biometric activity and countless dis-eases relating to sleeping is being classified.
Sleeping being closely related to biometric activity means that sleeping can be expressed by biomedical sig-nals and such signal can be used to classify the sleep state. In order to analyze the sleep stage, a biomedical signal analysis is being performed based on the rules of Rechtschaffen and Kales, but the calculation process according to this rule has a vast number of sleeping re-cords with time consuming problems [1].
EEG measured for sleep analysis is a technique that records the electrical activity of the brain, which can be best used as an important standard that distinguishes
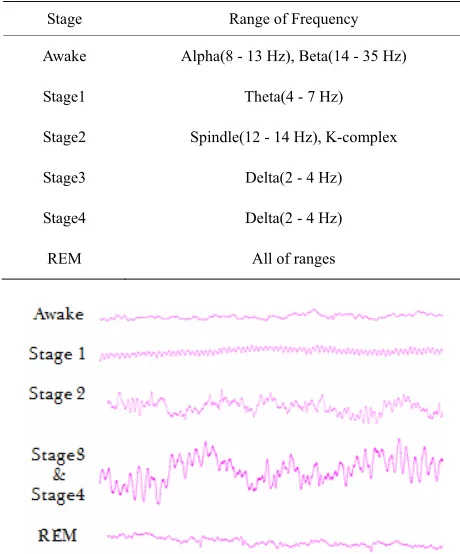
most objective classification of the sleep state. In order to analyze the sleep stage, EEG signal can be best con-firmed at C3 and C4, and the EEG signal’s frequency band is different depending on the sleep stage and this can be used for classifying the sleep stage. EEG fre-quency by the sleep stage shows that during the arousal phase alpha frequency (8 - 13 Hz) and beta frequency (14 - 35 Hz) is active and at stage 1 theta frequency (4 - 7 Hz), stage 2 spindle frequency (12 - 14 Hz) and K- com-plex is shown. At phase 3, 20% - 30% of delta frequency (2 - 4 Hz) is observed per epoch, and at phase 4, delta frequency (2 - 4 Hz) pattern of 50 or more is shown. During the REM sleep, it shows characteristics of pattern that is all mixed frequencies [2]. Table 1 shows a
fre-quency band by the sleep stage and the Figure 1 shows
EEG signal waveform by the sleep stage.
Currently the accuracy of an algorithm to classify the sleep state is poor and the measurement is complex, but in this thesis using the EEG signal as basis through the signal processing, extracting features and analyzing and applying it to the neural networks and SVM can help to accurately classify the patterns according to the sleep stage.
2. Materials and Methods
Table 1. Sleep stage.
Stage Range of Frequency Awake Alpha(8 - 13 Hz), Beta(14 - 35 Hz) Stage1 Theta(4 - 7 Hz) Stage2 Spindle(12 - 14 Hz), K-complex Stage3 Delta(2 - 4 Hz) Stage4 Delta(2 - 4 Hz) REM All of ranges
Figure 1. EEG waveform of different sleep stage.
define the category for the data the rules of Rechtschaf-fen and Kales was used giving epoch per 30 seconds to visually check the arousal state, light sleep (Stage 1 and Stage 2), deep sleep (Stage 3 and Stage 4) and REM state categorized with a total of 4 stage level[3].
Based on the pattern recognition, the analysis algo-rithm for sleep stage undergoes a signal processing of obtained EEG signal data and selects the parameter for the frequency domain which well indicates the sleep stage. A classifier used at such time is backpropagation algorithm for neural network and support vector machine. The test was configured by using well studied classifier to input other data to compare the accuracy of the classi-fier and to evaluate. The overall flow is shown on the
Figure 2.
2.1. Pre-processing and Feature Extraction
The EEG appears due to the chemical changes in the nerve cells and through the detection of the EEG internal details on the activities and functions of the brain can be seen. EEG signals has dozens of μV units, and in the time domain it can be analyzed by the periodic appear-ance of the EEG signal and noise, and in the frequency domain, by separating each band to find the value of the dominant frequency components to classify the quantifi-cation of the signal or types of signal. EEG signal is un-predictable and affected by a microscopic stimulus so
unless the signals are processed it is difficult to interpret the EEG. Accordingly, the original waveform obtained from this study was used for the pre-processing of the EEG signal [4].
First EEG’s largely occur by the movement of the muscle and eyes causing unnecessary signals to form so eliminating the total signal’s average value from the original signal to adjust the baseline. Afterwards in-creasing and dein-creasing of the EEG signals due to the person’s movement can occur so linear detrend was ap-plied to remove the straight constituents then filtering to remove the power noise and high frequency constituents
In this thesis, since the sleep stage has a big correlation with the EEG frequency band, gave frequency analysis of the EEG signal. In order to classify the EEG signal that has completed the filtering by band, a Fast Fourier trans-form was used to separate the EEG frequency band. In order to find the distinct characteristic vector that matches the predetermined data level, divided in the units of 30 seconds, calculating the frequency power per sam-ple to extract the distinct characteristic vector [5]. A fre-quency power can relatively have a different values therefore based on the power value for each band, rela-tive power value of the total power was obtained, and extracted relative power was also normalized to have values of 0 - 1. The Figure3 shows a distinct
character-istic vector of relative power extracted by each frequency for 30 minutes and the Figure4 is an overall flow chart
for the characteristic extraction.
0 10 20 30 40 50 60 0
0.5 1
delta
R/
P
sequence per 30 sec
0 10 20 30 40 50 60
0 0.5 1
theta
R/
P
sequence per 30 sec
0 10 20 30 40 50 60
0 0.5 1
alpha
R/
P
sequence per 30 sec
0 10 20 30 40 50 60
0 0.5 1
beta
R/
P
sequence per 30 sec
0 10 20 30 40 50 60
0 0.5 1
gamma
R/
P
sequence per 30 sec
1 2 3 4 5 6 7 8 9 10
0 0.5 1
total
R/
P
[image:3.595.56.288.86.513.2]sequence per 30 sec
[image:3.595.332.517.523.715.2]Figure 3. EEG relative power per time.
Figure 4. The flow chart of feature extraction.
2.2. Backpropagation Algorithm
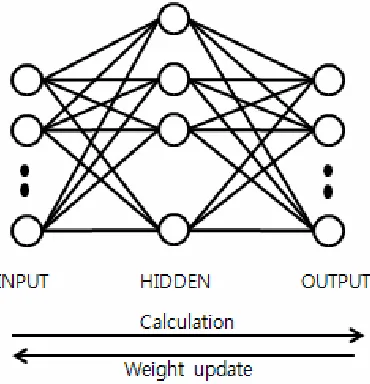
The backpropagation algorithm is a learning algorithm used to study the neural network by imitating the hu-man’s brain structure. A model of the neural network as shown on the Figure 5 consists of the input layer, hidden
layer and output layer. The hidden layer combines the values received from the input layer and transfers the values to the output layer and through such learning process renewing the weighted value to make the classi-fier.
To simply summarize the backpropagation algorithm, first the input date is inserted and calculates the output according to the input. Next, it finds the error between the output according to the input and the desired output to calculate the local error. Next it provides learning by renewing the weighted value for each neuron and repeat-ing such process until the error is reduced to the appro-priate level [6].
In order to structure the multilayer perceptron there are things to be considered. First is to categorize the input variables. Next is to determine what to do with the archi-tecture of the backpropagation algorithm in which the number of nodes, number of layers and define active functions to be used. Besides initial weighted value, learning rate and stop condition should be specified in order for the user to configure as desired [7].
In this study, for effective use of the backpropagation algorithm, as previously mentioned, has undergone a process of categorizing the feature vector. Also for active function a sigmoid function was used, and by selecting and changing the number of the hidden layer and the hidden node, a structure that best accurately analyze the sleep state was selected. The Figure 6 is a graph showing
that a learning process can reduce the error and in epoch after the graph confirms the error rate being maintained.
[image:3.595.123.224.531.721.2]2.3. Suppor
fiers were designed error rate, the SVM
e, for th
t Vector Machine
If previously introduced pattern classi with a purpose of minimizing the
was designed with a purpose of maximizing the gener-alization ability by maximizing the margins between categories. As shown on the Figure 7, two classification
lines are being classified without error. Previous classifi-ers will repeat the process of reducing the error and will stop to operate when no errors are found. But SVM will select the hyperplane having the same distance minimum value for each category from a large number of classified lines and will find the second classified lines with excel-lent generalization ability to maximize the margin.
SVM can solve the conditional optimized problem to obtain and learn the Lagrange multiplier. Therefor
[image:4.595.60.288.416.720.2]e SVM classifier the input vector and the support vec-tor will use nonlinear function to transform into a feature space and at such moment, an introduction of kernel function enabling internal calculation of the vector to simplify the computational difficulties. When a linear separation is impossible, SVM will introduce mitigation variables to allow wrong categories to measure how much margin of range the data has gone out. And by se-lecting the penalty variables and adjusting the width of the margin and the error it can structure an excellent performance classifier [8].
Figure 6. Error decreasing by epoch.
Figure 7. Support vector machine.
In order to structure the SVM, a selection of which ker-nel function to use and how to adjust the penalty variable must be made and explain whether the optimized condi-tion for the terminacondi-tion of the algorithm was satisfied. In this paper, SVM classifier that uses RBF kernel function to adjust the value of the variables that best classify the sleep states was selected.
3. Results
In relation to the extraction of parameter mentioned pre-viously, backpropagation algorithm and SVM was first studied then tested. Using the classifier with 5 subject’s
biometric si on the
Ta-bl
neural network. It had patterns as the neural network but all with r and had accuracy of 80% or higher during gnals studied, the result as shown
e 2 was derived. The Table 2 has expressed the
accu-racy of the classifier by each data.
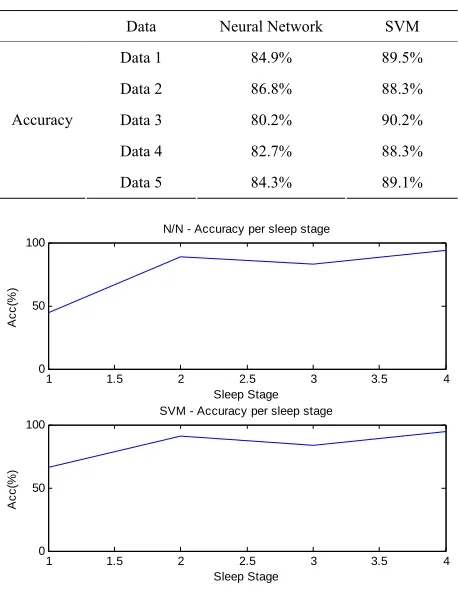
The Figure 8 is an accuracy of the sleep stage. Above
graph have shown accuracies when using the neural net-work and had less than 50% accuracy during the arousal state but in light sleep, deep sleep and REM states it had an accuracy of more than 80%. SVM comparatively had higher accuracy level than the
similar graph 65% or highe
[image:4.595.309.538.426.721.2]all other sleep states except for the arousal state and in light sleep and REM where the accuracy was over 90%.
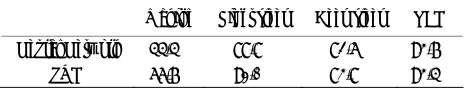
Table 3 is an organized version of the graph.
Table 2. Accuracy of Classifiers.
Data Neural Network SVM Data 1 84.9% 89.5%
Data 2 86.8% 88.3% Data 3 80.2% 90.2% Data 4 82.7% 88.3% Accuracy
Data 5 84.3% 89.1%
1 1.5 2 2.5 3 3.5 4
0 50 100
N/N - Accuracy per sleep stage
)
Sleep
Ac
Stage
c
(%
SV 100
1 1.5 2 2.5 3 3.5 4
0 50
M - Accuracy stage
Sleep Stage
A
cc(
%
)
Figure 8. Accuracy per sleep stage.
Table 3. Accuracy per sleep stage.
Waking Light sleep Deep sleep REM Neural Network 44.4% 88.8% 82.6% 93.7%
SVM 66.7% 91.0% 83.8% 93.4%
4. Discussion and Conclusions
In this paper, in order to classify the sleep state, assess-ment of the pattern classifier’s function using the EEG signal was conducted. Currently, in order to improve the inefficiencies of vast amount of data analysis and the EEG data’s ambiguity which are difficult for eye identi-fication during the sleep analysis, the proposed system from this study was based on the pre-processing of the EEG signal measured during the sleeping and the extrac
tion of par n region.
Using selec rule which
is currently widely used and studying the neural network
and SVM algorith fe e or e
o s lysis of the slee
Using a simple ier hm t e
-ting condition has increased the accuracy of an algorithm result neural
net-olve the ambiguity of biomedical signal can be
EAS-IEW, Vol. 4, No. 2, 2004. i, E. Harris, C. L. Nunn, R. A.
-ameter from the frequency domai
ted categories bases on the R&K
m to ef ctively ass ss the perf manc
f two classifier for ana p state.
classif algorit o chang the set
than classify the sleep state, and as a
work with an average of 83.8%, SVM with an average of 89.1% was confirmed, and based on this result it was confirmed that SVM’s performance was higher. Also in this study, it was confirmed that during the arousal state the accuracy falls significantly compared to other sleep states. And the reason is because the results are extracted during the beginning and the end of the test so it was speculated that many stimulus unrelated to sleeping was inflicted.
In this study, by using the EEG signal’s frequency characteristics it was confirmed that sleep state and EEG signal had a large correlation, and the algorithm used in this study is well known classifier therefore more faster adaptation was expected and this will be convenient and useful to those people who conduct sleep analysis. Also for the future studies, this can be used as a material to improve the algorithm function based on the fundamental algorithm.
But the system proposed by this study was based on the extracted biomedical signals from healthy adults so for the future, the research technique that can normalize
the difference of biomedical signals due to a gender and age group should be researched and the development of more generalized algorithm is necessary. Also besides EEG, using biomedical signals that are easy to measure, as a combination of biomedical signal, an improved ca-pability to res
expected as well as increasing the classification accu-racy for the arousal state. Also for classifiers based on each assessment, through a system combination more faster and stabilized performance should be shown.
5. Acknowledgements
This work was supported by the National Research Foundation of Korea(NRF) grant funded by the Korea government(MEST) (No.2010-0026833)
REFERENCES
[1] K. Šušmáková, “Human Sleep and Sleep EEG,” M UREMENT SCIENCE REV
[2] P. McNamara, I. Capellin
Barton and B. Preston, “The Phylogeny of Sleep Data-base: A New Resource for Sleep Scientists,” The Open
Sleep Journal, Vol. 1, 2008, pp. 11-14.
doi:10.2174/1874620900801010011
[3] S. K. Yoo, C. K. Lee and H. G. Jo, “Chaotic Analysis of
Electroenceph Quality
Meas-n Networks,” IEEE
nals alograic Signal for Sleep
urement,” ISAE 2013, Kitakyushu, 6-8 March 2013.
[4] M. Teplan, “Fundamentals of EEG Measurement,” IEEE
Measurement Science Review, Vol. 2, 2002, pp. 1-11.
[5] P. J. Durka, “Time-Frequency Analyses of EEG,” Insti-tute of Experimental Physics Department of Physics
Warsaw University, August, 1996.
[6] H. –N. F. Girosi, “Counterpropagatio
International Conference on Neural Networks,1987, pp.
19-32.
[7] A. Subasi and E. Erçelebi, “Classification of EEG Sig Using Neural Network and Logistic Regression,”
Com-puter Methods and Programs in Biomedicine,Vol. 78, No.
2, 2005, pp. 87-99.doi:10.1016/j.cmpb.2004.10.009 [8] E. Osuna, R. Freund and F. Girosi, “Support Vector
Ma-chines: Training and Applications,” C. B. C, I. Paper, No.