Teacher Behavior under Performance
Pay Incentives
Jones, Michael D.
University of Cincinnati
25 April 2012
Teacher Behavior under Performance Pay Incentives
Michael Jones* April 25, 2012
ABSTRACT
Over the last decade many districts have implemented performance pay incentives to reward teachers for improving student test scores. Economic theory suggests that these programs could alter teacher work effort, cooperation, and retention. Because teachers can choose to work in a performance pay district that has characteristics correlated with teacher behavior, I use the distance between a teacher’s undergraduate institution and the nearest performance pay district as an instrumental variable. Using data from the 2003 and 2007 waves of the Schools and Staffing Survey (SASS), I find that teachers respond to performance pay incentives by working fewer hours per week at school. Performance pay also decreases participation in unpaid
cooperative school activities, while there is suggestive evidence that teacher turnover decreases. The treatment effects are heterogeneous; male teachers respond more positively to performance pay than female teachers. In Florida, which restricts state performance pay funding to individual teachers or teams, I find that work effort and teacher turnover increase.
JEL Classifications: I21, I28, J33, M5
Keywords: Performance Pay, K-12 Education, Teacher Compensation
* Author contact info:
Michael Jones 323 Lindner Hall
University of Cincinnati, Department of Economics Cincinnati, OH 45221
1 Introduction
Since 1990 the nation’s high school student test scores have shown no improvement on the National Assessment of Educational Progress (NAEP) long-term trend assessments. During this same time period, education expenditures per student increased from $7,500 to over $10,000 in 2007 dollars.1 By 2007, ten percent of school districts had tried to jump start test score gains by explicitly linking a portion of teacher compensation to student performance. These
performance pay programs often provide a financial incentive in the form of a cash bonus or salary increase whenever student test scores achieve particular metrics. The explicit chain of events is that these programs affect teacher behavior, which in turn, affects student academic performance. The empirical evidence of performance pay’s downstream effect on student performance is inconclusive. Some studies show a positive effect (Vigdor, 2009; Figlio and Kenny, 2007; Lavy, 2002), some studies show a negative effect (Eberts et al., 2002), and some studies show little or no effect at all (Fryer, 2011; Springer et al., 2010). In order for
performance pay programs to affect student outcomes, there must be an upstream relationship between incentives and teacher behavior. This research looks inside the “black box” of performance pay programs and investigates the first-order effects on teacher behavior.
Proponents of performance pay argue that an effective incentive structure rewards teachers for their hard work and impact on student achievement. A few empirical studies have shown that teachers respond to these incentives by altering their work effort under performance pay. Ahn (2011) found that teachers have fewer absences from work when the bonus outcome is in doubt but no change in absences when there is either a low or high probability of receiving the bonus. In his evaluation of a Kenyan program that rewarded school teachers whose students
1
achieved higher test scores, Glewwe (2010) reported that there was no increase in teacher absences or homework assignments. He found that the pedagogy did not change, although there was evidence that teachers conducted more test preparation sessions. In a performance pay program in Israel, Lavy (2009) found that teachers increase after-school teaching and change their teaching methods. Fryer (2011) found no effect of performance pay incentives on teacher absences or retention in New York City.
Opponents of performance pay argue that it discourages cooperation and encourages teachers to “teach to the test.” A leader of the United Teachers Los Angeles union wrote “teacher unions have historically resisted performance pay proposals because they undermine
one of the core principles of teaching and learning: collaboration...as teachers we understand teaching is about working together to help our students, not competition for better pay.” 2
Although few, if any, studies specifically examine teacher cooperation under performance pay, Jacob and Levitt (2003) found that teachers responded to high-stakes testing in Chicago public schools by altering student test scores. Neal and Schanzenbach (2010) found strong
improvements in student test scores at the middle of the achievement distribution, but little changes at the ends of the distribution after the introduction of No Child Left Behind standards in Chicago. These findings suggest that teachers respond strategically to incentives, warranting a closer examination of cooperative behavior under performance pay.
This research investigates the impact of performance pay on teacher effort, cooperation, and retention. In particular, how do teacher work hours respond to performance pay incentives? I investigate how the composition of work hours changes in addition to the overall level of work hours. I also explore if teachers respond by participating in fewer cooperative activities outside of the classroom. Such an unintended consequence of performance pay may partially explain the
2
mixed evidence on student performance. In addition, I examine whether performance pay is effective in retaining more teachers in the profession, a claim often made by proponents of the programs. I consider whether awards that incorporate school-level performance produce a different response along these dimensions compared to individual awards based solely on that teacher’s performance in a classroom.
To answer these research questions, I use restricted-use data from the 2003 and 2007 waves of the Schools and Staffing Survey (SASS). The SASS is conducted by the Department of Education every few years and surveys a stratified random sample of teachers who provide information on their background, compensation, attitudes, school activities, and teaching
methods. For example, teachers are asked how many hours they work in a week, if they serve on school committees or sponsor student organizations, and how they feel about the level of
cooperation among the school staff. I also incorporate school district characteristics from the Department of Education’s Common Core of Data (CCD) and Education Week's District Graduation Rate Map Tool.
proximity to a merit pay district so the instrument should provide exogenous variation in the availability of merit pay districts. In the methodology section, I provide evidence to suggest that the exclusion restriction for the instrument is satisfied. For example, if high school seniors make their college choice at least partly in order to be closer to a performance pay district, the
estimates would be biased. However, data from the 2003-2004 Beginning Postsecondary Students Longitudinal Study shows that less than half of Education majors in their third year even had Education as a major when they entered college, suggesting that most high school students are not choosing a university to be close to a performance pay district.
2 Background on Performance Pay
2.1 Overview of Performance Pay Programs
The most common form of teacher compensation today, the single salary schedule, was first introduced in 1921 in Denver and Des Moines school districts (Sharpes, 1987). Under this pay schedule, teachers with the same level of education and teaching experience receive the same amount of pay.3 This form became the standard by the 1950s and remained relatively stable until the release of “A Nation at Risk: The Imperative for Educational Reform” by the National Commission on Excellence in Education in 1983. This report highlighted several areas of failure in the American education system. Partly in response, education reformers proposed alternative methods of teacher compensation that can be classified into two groups: skill-based pay and performance pay (Podgursky and Springer, 2007). Skill-based pay is distributed to an individual teacher for acquiring new skills or certification. This method of compensation presumes that there is a link between acquiring these skills and student outcomes. However, there is little evidence to suggest this link exists (Kane, Rockoff, and Staiger, 2008; Chingos and Peterson, 2011; Hanushek and Rivken, 2004). Under performance pay, teachers are typically rewarded based on student performance on standardized tests. These rewards can be distributed at the school level, where every teacher in a high performing school receives the same award, or they can be rewarded at the individual level. Although performance pay programs were
infrequently employed in the 1980s and 1990s, rapid expansion at the district and state level occurred in the 2000s.
3
For example, in 2006 the Texas legislature allocated $100 million for Texas Educator Excellence Grants (TEEG). Schools that either achieved Exemplary or Recognized performance ratings or were in the top quartile on the Texas Assessment of Knowledge and Skills (TAKS) exam were eligible for up to $295,000 per year. However, schools must also be in the top half of economically disadvantaged student enrollment in order to be eligible. In 2007, Florida
introduced the Merit Award Program (MAP) plan as a replacement for the Special Teachers Are Rewarded (STAR) plan just introduced in the previous year. Since MAP was implemented at the district level, the details of the program vary by district. However, at least sixty percent of a teacher's bonus must be based on student performance, and the award must be distributed to individual teachers or teaching teams. The state of Florida set aside almost $150 million to fund these awards. The Teacher Incentive Fund (TIF) within the US Department of Education was created to support projects that implement performance-based compensation systems. In 2010, $442 million dollars was awarded to 62 programs in 27 states.
Opposition from teacher unions may be one reason why performance pay has only slowly been adopted. The National Education Association (NEA), the largest labor union in the United States, issued resolution F-9 that says “the Association further believes that performance pay schedules, such as merit pay or any other system of compensation based on an evaluation of an education employee’s performance, are inappropriate.4 Resolution F-10 states “any additional compensation beyond a single salary schedule must not be based on education employee evaluation, student performance, or attendance.” This opposition has shown to be somewhat
successful with only 64% of teachers belonging to a union in a performance pay district, compared with 79% of teachers belonging to a union in a non performance pay district.
Despite opposition from the NEA, public support for performance pay is high. In the 2010 Phi Delta Kappa/Gallup Poll of the Public’s Attitude Toward the Public Schools, 75% of
public school parents felt that a teacher’s salary should be very closely tied or somewhat closely
tied to students’ academic achievement. Kathy Christie, the Chief of Staff at the Education Commission of the States (ECS), an interstate organization of state policymakers explains the support for these programs as - "that is the type of component [performance pay] that really, really resonates with the public. If you are not pulling your weight, if you are not getting performance, if you are not tenacious and really trying to learn and all those sorts of things you want to see teachers doing, then you don't move up at all."
2.2 Potential Responses to Performance Pay
Given the differing reduced-form findings concerning the impact of performance pay on test scores, it is logical to step back and ask whether performance pay has any effects on teacher behavior. While the previously cited studies have found either no effect or an increase in teacher
4
effort, there may be several reasons why teacher effort could actually decrease. First,
performance pay incentives may have heterogeneous treatment effects across gender or other groups. Niederle and Vesterlund (2007) show that in experimental situations, men have a stronger preference for performance or tournament-style pay incentives compared to women. Given a choice between tournament pay and piece-rate pay, men were more than twice as likely as women to select tournament pay, although they were no more skilled at the tasks than women. Nevertheless, the authors find that women perform just as well as men when forced to compete in a tournament. If this preference for competition holds true outside of an experimental setting, the decline in effort may be driven by female teachers. New teachers may also respond
differently to performance pay compared to more experienced teachers.
According to the SASS survey, the average teacher in a performance pay district receives a financial bonus of at most $614.5 If improvement in student test scores is not easy or
guaranteed, teachers may decide to reallocate their time to activities where the financial reward is higher. For example, they may decide to earn a guaranteed wage outside of the school system rather than invest extra time in after school teaching sessions. However, how does this
explanation fit the data if teachers had the option of working as a tutor or outside the school system prior to performance pay incentives? Psychologists explain such a phenomenon as the extrinsic motivation (financial reward) displacing the intrinsic motivation (internal desire to teach children). In Lepper and Green (1973), the authors conducted a study with children where they found that subjects who were offered an extrinsic award showed less interest in a coloring activity than subjects who received no award. Gneezy and Rustichini (2000) provided additional
5
evidence of this phenomenon when they found that Israeli children who were not paid any money collected more charitable donations than the group of children who were offered financial compensation. To a teacher, the introduction of performance pay may also increase the saliency of compensation. If a teacher’s awareness of compensation for student test scores increases, a teacher may decide she is better off reallocating her time elsewhere. Chetty et al. (2009) found that when tax-inclusive prices were posted in a grocery store, demand for those products decreased even though consumers were already aware that they must pay taxes.
When financial awards are distributed at the school level rather than to individuals, then teachers have an incentive to free ride on the efforts of high ability teachers. According to data from the Education Commission of the States, the Teacher Incentive Fund website, and the National Center for Teaching Quality TR3 database, few, if any districts outside of the state of Florida, award performance pay solely on individual teacher performance. Many of the school level awards are based on student performance on reading, writing and math skill assessments. One way to test the free riding hypothesis is to observe English and Math teachers’ response to performance pay. If other teachers respond with lower effort relative to English and Math teachers, then free riding is a potential explanation for an overall decline in teacher work effort.
A decline in teacher work effort could also be explained by the “happy worker is a productive worker” hypothesis. Under this hypothesis, teachers who are happy at work will put
Because most performance pay districts distribute awards at the school level, this paper also analyzes how teacher cooperative behavior might change. Arne Duncan, the Secretary of the Department of Education, gave the following remark at the National Press Club in 2010 - “when I was in Chicago, our teachers designed a program for performance pay and secured a $27
million federal grant… every adult in the building…all were rewarded when the school
improved. It builds a sense of teamwork and gives the whole school a common mission.” Using
the SASS, I explore whether this statement generalizes to the larger US teaching population. I not only test if the perception of cooperation changes within a school, but also if actual
cooperative behavior changes.
Finally, within the personnel economics literature, there is empirical evidence that performance incentives can affect worker retention. Lazear (2000) analyzes a large auto glass company that changed its compensation method from hourly wages to piece-rate pay.6 Lazear finds that the productivity increases were partly due to a retention of high output workers. Within education, one-third of teachers leave the profession within the first three years, and almost one-half leave within five years.7 Because performance pay incentives have been proposed as a way to reduce teacher attrition, I test to see if a teacher’s desire to leave the profession changes under performance pay
6
Under piece-rate pay, an individual worker is paid a fixed rate for every unit produced.
7
3 Schools and Staffing Survey (SASS)
Data for this project comes from the restricted-use version of the Schools and Staffing Survey (SASS), conducted by the National Center for Education Statistics. Begun in 1987, the SASS is fielded every three to four years and surveys a stratified random sample of public schools, private schools, and schools funded by the Bureau of Indian Education (BIE).8 The SASS collects data on teacher, administrator, and school characteristics, as well as school programs and general conditions in schools. This study uses the 2003 and 2007 waves of the SASS study, both of which took place after passage of the No Child Left Behind (NCLB)
legislation in 2001. Prior to NCLB, each state decided whether or not to set student achievement standards and if these results were shared with the public. The accountability provisions of NCLB required that all districts achieve Adequate Yearly Progress (AYP) in Reading/Language Arts, Mathematics, and graduation rates. Because of the likelihood that NCLB had a some effect on teacher behavior, analysis was restricted to the survey years after NCLB was passed. In addition to restricting the sample to public school teachers only, teachers who indicated that they received no salary or did not work full time were dropped from the analysis.9 Teachers from career or vocational schools, alternative schools, and special education schools were also removed from the sample.
The SASS sampling frame is built from the Common Core of Data (CCD) census. The CCD represents the universe of primary and secondary schools in the United States. The SASS samples a school first, and then each school is linked to the district in which it is located. The district for that school is also sent a questionnaire. On average, 5 teachers were sampled for each
8
The sample is a stratified probability-proportionate-to-size sample, stratified by state, grade range, and school type.
9
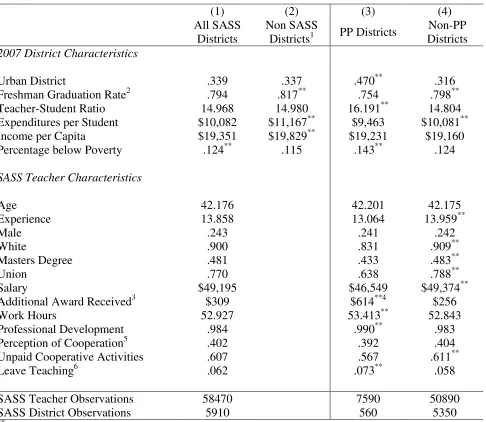
school with the range being 1 to 28. Because the SASS does not represent the entire universe, columns 1 and 2 in Table 1 compare characteristics of the 2007 SASS districts to those districts not in the SASS but in the CCD. We can reject the null that the means in the SASS districts are the same as non-SASS districts for three of six variables but the relative difference in the two sets of means is rather small. The SASS districts have slightly lower graduation rates and income per capita, but nearly identical student-teacher ratios and percentage in urban areas. A comparison of characteristics between SASS and non-SASS districts suggests that districts in the SASS are largely representative of the overall population.
In the bottom half of Table 1, I report descriptive characteristics of teachers in the SASS. Almost 15 percent of teachers work in a performance pay district. The average award among those that receive a pay for performance bonus is approximately $2,000. However, only 30% of teachers in a performance pay district actually receive an award, substantially lowering the additional amount an average teacher could expect to earn. Columns 3 and 4 in Table 1 report the differences in districts with performance pay compared to districts without performance pay. Teachers in a performance pay district are less likely to be white, less likely to have a master's degree, less likely to be in a union, have less teaching experience, and also earn a lower salary. Forty-seven percent of performance pay districts are located in an urban area compared to only 32 percent of non-performance pay districts. Data from Education Week's District Graduation Rate Map Tool and from the Common Core of Data (CCD) reveal that performance pay districts also have a higher percentage of students living below the poverty line, have lower expenditures per student, and graduate fewer students from high school.10 Although these characteristics can
10
I use graduation rate data from Education Week. Rates are calculated in the following way -
be accounted for in a regression equation, I am concerned about unobservable characteristics that may attract certain types of teachers to a particular district, resulting in a biased estimate of the effect of performance pay. I address this concern in more detail in the Identification section of the paper.
In addition to expenditures and graduation rates playing an important role in the decision to implement performance pay, the interaction of the two variables may also drive that decision. E.g. political and parental pressure could be stronger on district officials where expenditures are high and graduation rates are low. Using district's expenditures and graduation rates four years prior to implementation, I code each district as having either above average or below average graduation rates and above average or below average expenditures per student. I identify the four possible combinations as: High Maintenance District (above average expenditures and above average graduation rates), Low Maintenance District (below average expenditures and below average graduation rates), Overachieving District (below average expenditures and above average graduation rates), and Underachieving District (above average expenditures and below average graduation rates).
activities (PD) related to the content of the subjects they teach. Almost every teacher already participates in some form of professional development. The few teachers who are not currently involved in PD but are eligible for a bonus may pursue additional training to improve their ability to teach the subject material to students.
The SASS contains several possible measures of cooperation. Using a four point scale, teachers are asked to what extent they agree or disagree with the statement “There is a great deal of cooperative effort among the staff members.” As the numbers in the bottom of Table 1 indicate, forty percent of teachers indicate that they strongly agree with this statement with no significant differences between performance pay and non-performance pay districts. In addition to this question, teachers are asked if they participate in any of the following activities: serve as a department chair, serve as a lead curriculum specialist, or serve on a school-wide committee. I interpret increased participation in any of these activities as indicative of increased cooperation in the workplace because these are typically unpaid activities within a school. About 60 percent of teachers participate in some form of unpaid cooperative activity in a school, although this number is about 5 percentage points lower for teachers in a performance pay district. I separately examine how teachers participate in activities which are often paid, such as
4 Empirical Model
4.1 OLS
In addition to individual characteristics influencing teacher behavior, the school and district where the teacher works can also significantly affect behavior.11 Because teacher behavior can depend on characteristics of the individual, the school, and the district, the estimating equation is written as follows –
Yisdt= β0+PerformancePaydtβ1+Iisdtβ2+Ssdtβ3+Ddtβ4+vt+ε1isdt (1)
where Y is one of several measures of teacher behavior for individual i, in school s, in district d, at time t. The covariate of interest is the dummy variable PerformancePaydt which equals 1 for respondents that answer yes to the question - “Does this district currently use any pay incentives such as cash bonuses, salary increases, or different steps on the salary schedule to reward
excellence in teaching?” The vector I measures characteristics of the individual and includes the covariates: race, gender, age, age2, experience, experience2, master's degree, and union status. The vector S measures school characteristics and includes covariates that measure whether it is an elementary school, the percent of students on free lunch, school size, and the student-teacher ratio. The vector D measures district covariates including: collective bargaining, free lunch percentage, urban, number of schools, expenditures, graduation rates, district categorization, and other pay incentives.12 Controlling for other types of pay incentives is necessary in order to
11
For example, Mont and Rees (2007) found that increasing class sizes are associated with higher teacher turnover. Gritz and Theobold (1996) found that the environment created by high levels of central office spending in a district will increase the likelihood that a teacher leaves the district.
12
isolate the effect of performance pay. In addition to asking districts about performance pay, the SASS asks districts if they use pay incentives for any of the following: teacher certification, recruitment or retention in a less desirable location, recruitment or retention in a field of
shortage, signing bonus, relocation assistance, and student loan forgiveness. The variable vt is a time effect and ε1isdt is an idiosyncratic error term.
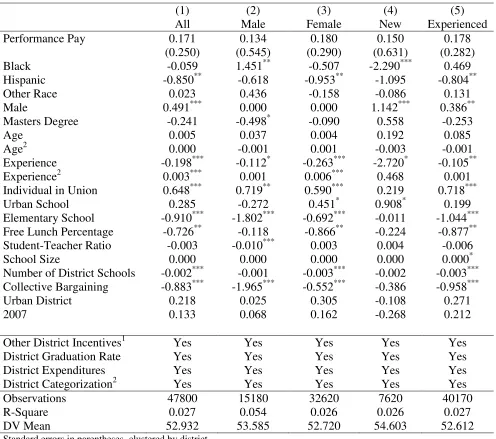
Table 2 presents the results of the OLS estimate of equation 1, excluding data from Florida. Table 2 reveals several important relationships about the nature of teacher work effort. For every five years of experience, teachers work one hour less per week. For each percentage point increase in the percentage of students receiving a free lunch from the school, a teacher works 3/4 of an hour less per week. Female teachers, teachers in an elementary school, and teachers under a collective bargaining agreement all work fewer hours compared to their
respective counterparts. Even after a substantial number of variables are added to the model, the R2is only 0.027, suggesting that it may be difficult to predict a teacher’s work hours based on observable characteristics.
4.2 Identification Strategy
In a January 2010 survey by CareerBuilder.com, 80 percent of recent graduates indicated that they preferred their first job to be within fifty miles of either where they went to school or their permanent address. Moving a long distance can impose significant social costs for many graduates. These students have made significant investments in relationships with friends and family during the time they were in college. Even if a teacher wants to work in a performance pay district, she is unlikely to work there if none are located near the university. Moving too far away from the university might weaken many of the relationships formed during college. In fact, the median teacher is only 64 miles from where she received her undergraduate degree. The instrument for PerformancePay then is the distance, in miles, between the undergraduate
institution and the nearest performance pay district.
The restricted-use SASS contains the university where the teacher obtained her
undergraduate degree. By using the IPEDS ID for each university, I look up the address of the university. The SASS also contains the address for each district. To calculate the distance between these two locations, I wrote a computer program to call Yahoo's Geocoding API to return the longitude and latitude of each address. Then, I calculate the distance, in miles, between the university and every district in the dataset and return the shortest distance to a performance pay district.13
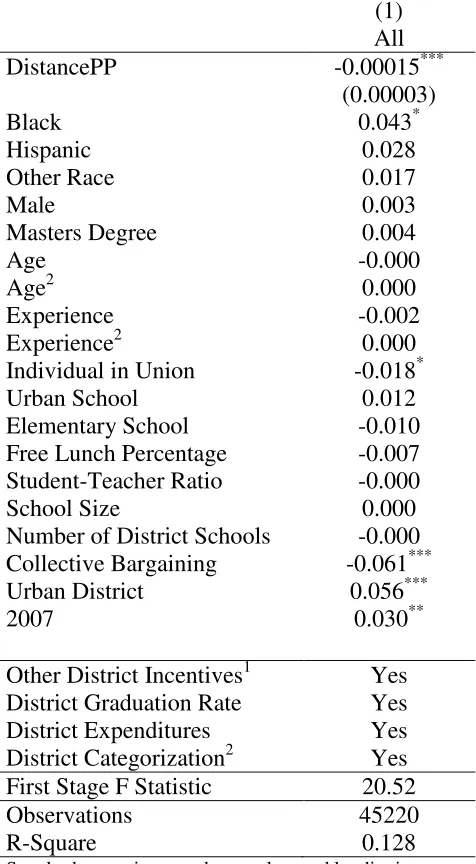
In order to use distance from an undergraduate institution to the nearest performance pay district as an instrumental variable, several conditions must be satisfied. First, the instrument must cause variation in the endogenous variable, PerformancePay. That is, the distance from a university to a performance pay district affects the probability of teaching in a performance pay
13
district. We can verify that this property is satisfied by estimating the following first-stage equation
PerformancePayisdt= π0+ DistancePPisdtπ1+ Iisdtπ2+ Ssdtπ3+ Ddtπ4+ vt+ε2isdt (2)
where DistancePP is the distance, in miles, to the nearest performance pay district from a teacher's undergraduate university. All other variables are the same as equation 1. Table 3
presents the results from equation 2. Increasing the distance from a university to a performance pay district by 10 miles results in a .15 percentage point decrease in the likelihood that a teacher works in a performance pay district. An F Statistic of over 20 confirms that the first condition is satisfied and finite sample bias issues are not a concern.
Next, the second criterion is that the distance instrument cannot be correlated with the error term in equation 1. If either of the following situations is true, then the exclusion restriction is violated: 1) high school seniors choose a university or the teaching profession because of proximity to a performance pay district, or 2) districts choose to implement
performance pay because of their proximity to universities. Although the exclusion restriction cannot be proven to be satisfied, there is evidence that is consistent with the exclusion restriction.
If high school seniors make their college choice at least partly in order to be closer to a performance pay district, they would need to know that they were going to be teachers when they graduated from high school. Data from the 2003-2004 Beginning Postsecondary Students
it is unlikely that high school seniors choose a university to be closer to a performance pay district. In his book, A Place Called School, John Goodlad wrote that 70 percent of teachers primarily chose to be a teacher because they enjoyed teaching or working with children.
A district’s implementation of performance pay is also not random. For example, the state of Texas explored performance pay after the Texas Supreme Court ruled that the education financing system was unconstitutional because of an over-reliance on local property taxes.14 During a special legislative session, state leaders argued how state resources could best improve student outcomes. The Governor’s Educator Excellence Grant (GEEG) incentive program emerged out of these discussions. Adding district expenditures, district graduation rates, and district categorization to the regression equation directly controls for characteristics that may drive both performance pay adoption and teacher behavior. These covariates also control for the situation where teacher labor supply responds to these same characteristics that predict
performance pay.
In Table A1, I report the difference in means of observed characteristics for teachers in the SASS for those teachers currently less than 18 miles from their undergraduate institution to those who are more than 18 miles from their undergraduate institution (18 miles is the median distance between a university and the nearest performance pay district). If selection on the observables into districts close to universities is not very different between the two groups then it suggests that selection on the unobservables may not be very different. In other words, I provide evidence that teachers farther from a performance pay district would not work longer or
cooperate differently, prior to being in a performance pay program, compared with teachers near to a performance pay district. While many of the variables between the two distance groups are
14
statistically significant, few, if any, of the observable characteristics are economically
significant. For example, 90 percent of teachers who are located far from a performance pay district say that they are well prepared in classroom management techniques compared to only 89 percent of teachers who are close to a performance pay district. Although this is a statistically significant result, it is hard to imagine that such a result would lead to meaningful differences in teacher work hours. Finally, I check to see if the instrumental variable acts monotonically in order to interpret my IV estimate as a local average treatment effect (LATE). Table A2 shows that the probability of a teacher working in a performance pay district is a monotonic decreasing function of the distance to the nearest performance pay district.
5 IV Results
5.1 Teacher Effort, Cooperation, and Retention
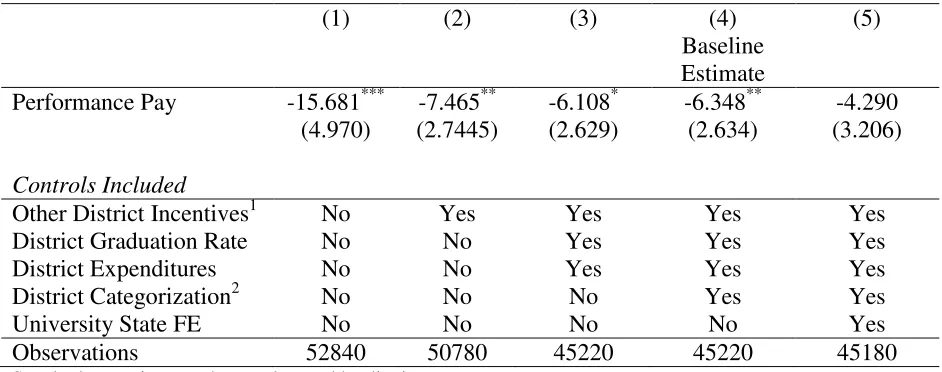
Table 4 shows the effect of performance pay on teacher work hours in all states except Florida estimated from the IV models. Column 1 presents results without including controls for district pay incentives, district graduation rates, or district expenditures. Column 2 demonstrates the importance of including controls for other pay incentives that a district can employ to attract and retain teachers; and column 3 presents estimates with student graduation rates and district expenditures as controls. The interactions of these two terms, i.e. district categorization controls, are included in column 4 to account for the non-randomness of a district’s decision to use
performance pay. Column 5 shows that teacher work hours decline by over four hours when university state fixed effects are included, although this result is not statistically significant. The fourth column, the preferred specification, shows that the enactment of performance pay
hours. With teachers working 53 hours a week, performance pay causes a decline in work hours of twelve percent.
Figure 2 shows a chart where each of the 50 data points represents a simulation with one dropped state from the SASS dataset. I perform this simulation to determine if any particular state was driving the decline in work hours due to performance pay. The plot shows that teachers’ response to performance pay in Florida is unique compared with the other states. Because Florida is unique in that no other state restricts performance pay incentives to individual teachers, I separately analyze the effects in Florida in section 5.3.
Table 5 presents IV estimates of the Performance Pay variable for different measures of work effort and for various subgroups. Each cell in Table 5 is a separate equation where the rows define the dependent variables and the columns define the subgroup. Column 3 in Table 5 shows that the decline in work hours is most pronounced among female teachers. Female work hours drop by a statistically significant 7.12 hours, but male work hours decline by 2.93 hours, a statistically insignificant estimate. Columns 4 and 5 of Table 5 show that teachers with 4 or more years of experience respond negatively to performance pay. Under performance pay,
experienced teachers work seven hours less per week while teachers with less than 4 years of experience report a decline of less than half that amount.
The decline in work hours may be a concern to proponents of performance pay,
teaching these subjects. Since many performance pay bonuses are based on student test scores in Math and English subjects, I investigate if teachers in performance pay districts “teach to the tests.” Row 3 in Table 5 shows that the allocation of the hours between teaching Math / English and other subjects does not significantly change.
The SASS asks teachers the following question –“In the past 12 months, have you participated in any professional development activities specific to and concentrating on the content of the subject(s) you teach?” If teachers have the possibility of earning additional pay based on student test scores, then teachers may have an incentive to pursue professional
development that enables them to become better teachers. Row 4 in Table 5 shows evidence that teachers actually increase their pursuit of professional development activities once performance pay is introduced.
The SASS also asks if teachers earn any additional compensation during the school year. Such a job can come from the school system itself or from outside the school system. For
example, inside the school system, teachers can earn additional compensation by tutoring or coaching a sport. Under performance pay, teachers are significantly more likely to take on an additional job outside of their teaching responsibilities. Since the average teacher receives a performance pay award of at most $614, teachers may feel that their time is more valuable working for a guaranteed wage than receiving a performance pay award.
Table 6 provides evidence for the happy worker / productive worker hypothesis. Teachers are asked if they strongly agree with the following statements “The stress and disappointments
teacher in an eligible school, proponents of performance pay argue that cooperation should not decrease. The SASS contains a question to determine if this hypothesis is correct. Teachers are asked if they strongly agree with the following statement –“There is a great deal of cooperative effort among the staff members.” From row 3 of Table 6, it appears that performance pay has a positive effect on cooperation. However, by only using a four point scale, this question is a rough approximation to measuring cooperation.
The SASS contains several other potential measures of cooperation. Teachers are asked if they participated in any of the following activities during the school year - (1) Serve as a department lead or chair? (2) Serve as a lead curriculum specialist? or (3) Serve on a school-wide or district-wide committee or task force? Row 5 in Table 6 shows a significant decline in
participation in these typically unpaid activities. The differential response among men and women is striking; women are 42 percentage points less likely to participate in these unpaid cooperative activities while men show no decline in participation. The finding that females are much less likely to participate in these cooperative activities after performance pay is introduced may explain some of the decline in female teachers’ work hours. More experienced teachers also show a significant decline in unpaid cooperative activity participation. For paid cooperative activities, there is no significant decline in participation among all teachers.15
One-third of teachers leave the profession within the first three years, and almost one-half leave within five years. Teacher attrition can be costly since hiring new teachers to replace the ones who left can involve recruitment and training costs. There is also some evidence to suggest that inexperienced teachers can be less effective (Rockoff, 2004). Students in high-turnover schools continue to be exposed to new and inexperienced teachers. Some policy makers have
15
advocated that performance pay can act as a retention device to keep quality teachers from leaving the profession.
Hanushek et al. (2004) find that salary differentials exert a modest impact on a teacher's willingness to leave the school. In addition to altering teacher effort and cooperation,
performance pay may also affect teacher retention. When asked “How long do you plan to remain in teaching?”, row 6 in Table 6 shows that performance pay teachers are significantly less likely to say “definitely plan to leave as soon as I can.” In addition to the SASS, the Department of Education also conducts the Teacher Follow-up Survey (TFS) the year following the
administration of the SASS. The purpose of the TFS is to determine how many teachers remained at the same school, moved to another school, or left the profession altogether. The 2008 TFS was administered to a sample of teachers who completed the SASS in the previous year. Using the TFS, I find that only 6 percent of teachers who leave a performance pay district said that performance pay played a very or extremely important role in the decision to leave. When teachers were asked to describe the most important reason for their decision to leave, none of them cited performance pay as the reason. Because the sample consists of only 64 teachers however, caution is urged in interpreting this result.
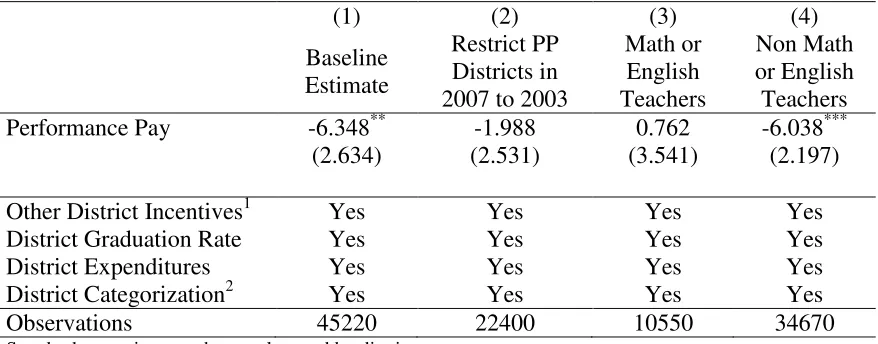
5.2 Robustness Checks
If performance pay districts are merely synonymous with “bad” districts, then this
presents a potential threat to the identification strategy.16 Under this scenario, the effect of performance pay on teacher behavior is not identified; rather, the research would only show that bad teachers are associated with bad districts. One falsification test to provide evidence that the performance pay effect is truly identified is to examine the districts which implemented
16
performance pay incentives in 2007, but not in 2003. Then, restrict the sample to 2003 and treat those districts as if they implemented performance pay in 2003. If the distance instrument is working correctly, the estimation should show that performance pay has no significant effect on teacher work hours. If the falsification test shows that performance pay causes a significant decline in work hours, then it suggests that the effect of performance pay is not completely identified. Column 2 in Table 7 shows that performance pay has no significant effect on work hours under this falsification test.
Next, if the IV estimate of performance pay is just identifying bad teachers or bad districts, then there should not be a differential response by teachers of different subjects. The SASS asks teachers the following question –“this school year, what is your main teaching assignment field at this school?” Using the responses to this question, I divide the teacher
sample into those who teach Math or English and those who teach another subject. I separate the teachers into these two groups since performance pay incentives are often rewarded based on student test scores in these subjects.17 I then estimate the effect of performance pay separately for these two teacher groups. Columns 3 and 4 in Table 7 show that the decline in work hours is driven by teachers who do not teach Math or English. This finding suggests that the instrument is properly identifying the effect of performance pay incentives. Since the performance pay incentives are rewarded at the school level, this finding may also suggest that other teachers are free-riding on the efforts of Math and English teachers.
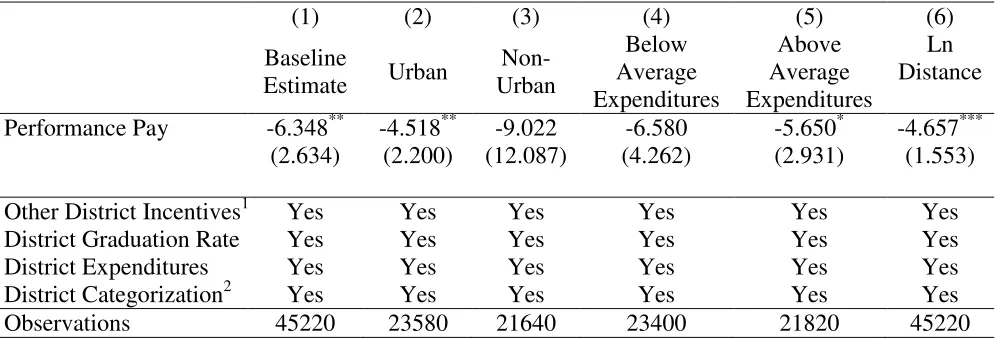
In addition, districts in urban areas are closer to universities and may be influenced as to whether or not performance pay is implemented. To address this concern, Table 8 separates teachers into urban and non-urban districts and separately analyzes the effect of performance pay
17E.g. Alaska’s
Public School Performance Incentive Program rewards teachers based on student test scores on the Standards Based Assessments. These assessments measure student performance in reading, writing, and
on work hours. Columns 2 and 3 of Table 8 show that the point estimate of the decline in teacher work hours within the two subgroups is consistent with the estimate for the full sample. Also, although controlling for district expenditures accounts for the direct effect of expenditures on the decision to implement performance pay, low expenditures could be symptomatic of other underlying problems in the district. These problems may be influencing the decision to
implement performance pay. For example, teachers in performance pay districts earned a salary that was $2,825 less than their counterparts in non-performance pay districts. If districts are using performance pay incentives simply to make their teacher salaries equivalent with those in other districts, then we would not expect performance pay to influence teacher behavior. Columns 4 and 5 in Table 8 still show a decline in teacher work hours for those in districts with below average expenditures and those in districts with above average expenditures. Column 6 in Table 8 shows that the estimate of the decline in teacher work hours is similar to the results in the original IV specification after the data is log transformed. A log transformation addresses the outlier observations where the nearest distance to a performance pay district is thousands of miles away.
Standard errors throughout the paper are clustered at the district level since teachers sampled within a district are not independent observations. One could also consider clustering at the state level as well since much of the variation in the presence of merit pay programs is
by randomly drawing observations (as in some bootstrapping methods), the method of replicate weights incorporates the stratification and clustering information of the SASS. The difference between the point estimate in the full sample and the point estimate using the weights of each of the replicates is used to determine the standard error. The variance of a statistic, Y, is then given as -
( ) ∑( )
where Yr equals the estimate using the rth set of replicate weights and Y is the result using the
full-sample weight.
Table A3 displays the estimate of performance pay on measures of work effort by different standard error calculations, including replicate weights. Table A3 shows that standard errors increase between the OLS estimate and the IV estimate; standard errors are also higher when standard errors are clustered at the state level compared to the district level. Calculations using replicate weights are approximate to clustering at the district level. This finding is consistent with other datasets that use replicate weights, including the 2005-2009 March
supplements of the IPUMS-CPS. Under IPUMS testing of CPS data, “replicate weights usually increase standard errors.”18 Regardless of the method for calculating standard errors, the results for the paper hold.
5.3 Florida
One limitation of the analysis in this study is that performance pay is only defined as a binary variable on the question of a district using financial incentives to reward excellence in teaching. Since not all performance pay programs are created identically, the effect of
18
performance pay could vary by implementation. Teachers may respond differently to an individual award compared to a school award. The state of Florida provides an opportunity to specifically examine how individual-level award distribution contrasts with school-level award distribution.
In 1999, the Florida state legislature passed a statute that required districts to offer a bonus of at least 5 percent of a teacher’s salary as a reward for outstanding individual teaching.19 The bonus could not be based on school level metrics. Because the state did not provide any additional funds for this requirement, many districts failed to implement the policy. In 2006, the state began to distribute additional funds to districts which implemented a performance pay policy. Table 9 provides a description of the four performance pay programs in Florida during the time period of the SASS dataset. Although various details change over time, the distribution of the award to the individual teacher remains constant. The 2007 Merit Award Program (MAP) does make an allowance for a “teaching team”; however, less than 5 percent of teachers in
Florida are members of a teaching team.20
While the individual nature of the performance pay program appears to be driving the result in Florida, I also evaluate the other characteristics of the Florida program relative to programs outside of the state. A performance bonus in Florida must be at least 5% of a teacher’s salary. At an average salary of $43,724, this requirement translates into an award of $2,186. In the SASS, the average amount for a teacher that received an award in Florida was $1,966, consistent with the state mandate. Within the entire SASS dataset, the average award amount was $2,047, suggesting that the award amount in the Florida program is not driving the result. I
19
Florida State Statute, Title XVI, §230.23
20
In the SASS, these teachers affirmed the following statement –“You are one of two or more teachers, in the same class, at the same time, and are jointly responsible for teaching the same group of students all or most of the day
also check to see if the proportion of awarded teachers could be a contributing factor. The proportion of teachers who received an award in a performance pay district in Florida is 40%, compared to 30% of teachers in the SASS dataset. Although the proportion of rewarded teachers is not dramatically different, I cannot rule out that rewarding a higher proportion of teachers is a contributing factor to Florida’s results.
Table 10 shows the effect of performance pay on teacher work effort, cooperation, and retention in Florida compared to the rest of the states. Column 1 in Table 10 shows that teacher work hours increases by a remarkable 13 hours, or 25 percent, in response to performance pay in Florida. Outside of Florida, the baseline results show that teacher work hours decline by more than 6 hours, or 12 percent. Teachers appear to respond much differently to individual- level incentives compared to school-level incentives. Although these changes in effort appear high, they are consistent with and even lower than other estimates in the literature. Lazear (2000) finds a 44 percent increase in productivity when piece-rate compensation is introduced in an auto glass manufacturer. Bandiera et al. (2005) find a twenty-one percent decrease in productivity in a field experiment using relative incentives.21 Florida teachers also report a lower participation rate in unpaid cooperative activities, although the result is not statistically significant. Finally, teachers in Florida under performance pay are significantly more likely to say that they would definitely leave the profession.
6 Conclusion
Using a nationally representative dataset and a novel instrumental variable approach, I find that the enactment of performance pay affects teacher behavior in several ways. Outside of
21
Under relative incentives, if a worker is moved from a group with none of her friends present to a group with 5 or
Florida, teachers respond by working twelve percent fewer hours per week and spend more time pursuing other job opportunities. Participation in unpaid cooperative activities decreases while participation in paid cooperative activities remains unchanged. Teacher turnover also appears to significantly decrease under performance pay.
However, the response to performance pay is not homogeneous. Male teachers show no significant decline in work hours. Female teachers participate less frequently in unpaid
cooperative activities compared to male teachers. Experienced teachers respond with lower work effort compared to new teachers, possibly suggesting the presence of peer effects. The use of individual-level awards in Florida leads to an entirely different response to school-level awards outside of Florida. In Florida, individual effort increased by 25 percent under performance pay; teachers were also much more likely to indicate that they would leave the profession in Florida.
The findings in this paper lead to several future avenues of research. The results suggest that there may be a selection effect for male and female teachers, but does the evidence support this hypothesis? Are men more likely to join the teaching profession if they can be rewarded for their students' performance? Also, how does the proportion of awards affect teacher behavior? If the number of awards are particularly low or high, do teachers respond differently? These questions are all fruitful areas of future research.
References
Ahn, Tom. 2011. The Missing Link: Estimating the Impact of Incentives on Effort and Production Using Teacher Accountability Legislation, Working Paper.
Akerlof, George A. and Janet L. Yellen. 1990. The Fair Wage-Effort Hypothesis and Unemployment, Quarterly Journal of Economics 105: 255-283.
Ballou, Dale. 2001. Pay for Performance in Public and Private Schools, Economics of Education Review 20: 51-61.
Ballou, Dale and Michael Podgursky. 1993. Teachers' Attitudes Toward Merit Pay: Examining Conventional Wisdom, Industrial and Labor Relations Review 47: 50.
Bandiera, Oriana, Iwan Barankay and Imran Rasul. 2005. Social Preferences and the Response to Incentives: Evidence from Personnel Data, The Quarterly Journal of Economics 120: 917-962.
Brian, J. A. 2003. Rotten Apples: An Investigation of the Prevalence and Predictors of Teachers Cheating, The Quarterly Journal of Economics: 843.
Charness, Gary and Peter Kuhn. 2007. Does Pay Inequality Affect Worker Effort? Experimental Evidence, Journal of Labor Economics 25: 693-723.
Chetty, R., A. Looney, and K. Kroft. 2009. Salience and Taxation: Theory and Evidence. The
American Economic Review, 99:4. 1145.
Chingos, Matthew M. and Paul E. Peterson. 2011. It's Easier to Pick a Good Teacher than to Train One: Familiar and New Results on the Correlates of Teacher Effectiveness,
Economics of Education Review 30: 449-465.
Eberts, R., Kevin Hollenbeck, and Joe Stone. 2002. Teacher Performance Incentives and Student Outcomes, The Journal of Human Resources 37: 913.
Fehr, Ernst and Simon Gächter. 2000. Cooperation and Punishment in Public Goods Experiments, The American Economic Review 90: 980-994.
Figlio, David N. and Lawrence W. Kenny. 2007. Individual Teacher Incentives and Student Performance, Journal of Public Economics 91: 901-914.
Fryer, Roland G. 2011. Teacher Incentives and Student Achievement: Evidence from New York City Public Schools, NBER Working Paper 16850.
Glewwe, P. 2010. Teacher Incentives, American Economic Journal: Applied Economics 2: 205. Gneezy, U. and A. Rustichini. 2000. Pay Enough or Don't Pay at all, The Quarterly Journal of
Economics, 115:3.
Gritz, R. M. and Neil D. Theobald. 1996. The Effects of School District Spending Priorities on Length of Stay in Teaching, Journal of Human Resources 31: 477-512.
Hamilton, Barton H., Jack A. Nickerson and Hideo Owan. 2003. Team Incentives and Worker Heterogeneity: An Empirical Analysis of the Impact of Teams on Productivity and
Participation, Journal of Political Economy 111: 465-497.
Hanushek, E. A. 2004. How to Improve the Supply of High-quality Teachers, Brookings papers on education policy.
Hanushek, Eric A., John F. Kain and Steven G. Rivkin. 2004. Why Public Schools Lose Teachers, Journal of Human Resources 39: 326-354.
Hanushek, Eric A. and Richard R. Pace. 1995. Who Chooses to Teach (and Why)? Economics of Education Review 14: 101-117.
Holmstrom, B. and Paul Milgrom. 1991. Multitask Principal-Agent Analyses: Incentive
Contracts, Asset Ownership, and Job Design, Journal of Law, Economics, and Organization
7: 24.
Jackson, C. K. 2010. A Little Now for a Lot Later, The Journal of Human Resources 45: 591. Jacob, Brian A. 2005. Accountability, Incentives and Behavior: the Impact of High-stakes
Testing in the Chicago Public Schools, Journal of Public Economics 89: 761-796. Jacob, B. A. Steven Levitt. 2003. Rotten Apples: An Investigation of the Prevalence and
Predictors of Teacher Cheating, The Quarterly Journal of Economics 118: 843.
Jones, Michael. 2011. Show Who the Money? Does Performance Pay Attract Higher Quality Teachers, Working Paper.
Kane, Thomas J., Jonah E. Rockoff and Douglas O. Staiger. 2008. What Does Certification Tell Us About Teacher Effectiveness? Evidence from New York City, Economics of Education Review 27: 615-631.
Ladd, Helen F. 1999. The Dallas School Accountability and Incentive Program: an Evaluation of its Impacts on Student Outcomes, Economics of Education Review 18: 1-16.
---2009. Performance Pay and Teachers' Effort, Productivity, and Grading Ethics, American
Economic Review 99: 1979-2011.
Lazear Edward, P. 2000. Performance Pay and Productivity, The American Economic Review 90: 1346.
Lazear, Edward P. 1989. Pay Equality and Industrial Politics, Journal of Political Economy 97: 561.
Lazear, Edward P. and Sherwin Rosen. 1981. Rank--Order Tournaments as Optimum Labor Contracts, Journal of Political Economy 89: 841.
Lepper, Mark R., David Greene and Richard E. Nisbett. 1973. Undermining Children's Intrinsic Interest with Extrinsic Reward: A Test of the "Overjustification" Hypothesis, Journal of Personality and Social Psychology 28: 129-137.
Mont, Daniel and Daniel I. Rees. 1996. The Influence of Classroom Characteristics on High School Teacher Turnover, Economic Inquiry 34: 152-167.
Neal, Derek. 2011. The Design of Performance Pay in Education, NBER Working Paper 16710. Neal, Derek and Diane W. Schanzenbach. 2010. Left Behind by Design: Proficiency Counts and
Test-Based Accountability, Review of Economics and Statistics 92: 263-283.
Niederle, Muriel and Lise Vesterlund. 2007. Do Women Shy Away from Competition? Do Men Compete Too Much? Quarterly Journal of Economics 122: 1067-1101.
Podgursky, Michael J. and Matthew G. Springer. 2007. Teacher Performance Pay: A Review,
Journal of Policy Analysis and Management 26: 909-950.
Protsik, Jean. 1995. History of Teacher Pay and Incentive Reform. Conference on Teacher Compensation of the Consortium for Policy Research in Education.
Rockoff, J. E. 2004. The Impact of Individual Teachers on Student Achievement: Evidence from Panel Data, The American Economic Review 94: 247.
Sharpes, Donald K. 1987. Incentive Pay and the Promotion of Teaching Proficiencies, The Clearing House 60: 406-408.
Vigdor, Jacob. 2009. Teacher Salary Bonuses in North Carolina, in M. Springer, ed.,
Performance Incentives: Their Growing Impact on American K-12 Education: Brookings
Table 1: Summary Statistics, All States, Data from SASS & Common Core of Data (CCD)
(1) (2) (3) (4)
All SASS Districts
Non SASS
Districts1 PP Districts
Non-PP Districts
2007 District Characteristics
Urban District .339 .337 .470** .316
Freshman Graduation Rate2 .794 .817** .754 .798** Teacher-Student Ratio 14.968 14.980 16.191** 14.804 Expenditures per Student $10,082 $11,167** $9,463 $10,081** Income per Capita $19,351 $19,829** $19,231 $19,160 Percentage below Poverty .124** .115 .143** .124
SASS Teacher Characteristics
Age 42.176 42.201 42.175
Experience 13.858 13.064 13.959**
Male .243 .241 .242
White .900 .831 .909**
Masters Degree .481 .433 .483**
Union .770 .638 .788**
Salary $49,195 $46,549 $49,374**
Additional Award Received3 $309 $614**4 $256
Work Hours 52.927 53.413** 52.843
Professional Development .984 .990** .983 Perception of Cooperation5 .402 .392 .404 Unpaid Cooperative Activities .607 .567 .611**
Leave Teaching6 .062 .073** .058
SASS Teacher Observations 58470 7590 50890 SASS District Observations 5910 560 5350
**
Mean is significantly higher at a 5% level of significance Financial data are in 2007 dollars
1) Data obtained from 2007 Common Core of Data (CCD). In 2007. there were approximately 18,000 school districts in the United States.
2) The proportion of high school freshman who graduate with a regular diploma 4 years after starting 9th grade 3) The amount comes from this question –“During the current school year, have you earned income from any other sources from this school system, such as a merit pay bonus, state supplement, etc.?”
4) Conditional on having received a performance pay award, the average teacher earned an award of $2,047. 30% of teachers in a performance pay district indicate that they received an award.
5) The proportion of teachers who strongly agree that there is a great deal of cooperative effort among the staff members.
6) I create a dummy variable coded as 1 if teachers respond to the question “How long do you plan to remain in
teaching?” with “Definitely plan to leave as soon as I can” or “Until a more desirable job opportunity comes along.”
The variable is coded as 0 with any other response.
Table 2: OLS Estimate of Performance Pay on Work Hours, Excluding Florida from SASS
(1) (2) (3) (4) (5)
All Male Female New Experienced Performance Pay 0.171 0.134 0.180 0.150 0.178
(0.250) (0.545) (0.290) (0.631) (0.282) Black -0.059 1.451** -0.507 -2.290*** 0.469 Hispanic -0.850** -0.618 -0.953** -1.095 -0.804** Other Race 0.023 0.436 -0.158 -0.086 0.131 Male 0.491*** 0.000 0.000 1.142*** 0.386** Masters Degree -0.241 -0.498* -0.090 0.558 -0.253
Age 0.005 0.037 0.004 0.192 0.085
Age2 0.000 -0.001 0.001 -0.003 -0.001 Experience -0.198*** -0.112* -0.263*** -2.720* -0.105** Experience2 0.003*** 0.001 0.006*** 0.468 0.001 Individual in Union 0.648*** 0.719** 0.590*** 0.219 0.718*** Urban School 0.285 -0.272 0.451* 0.908* 0.199 Elementary School -0.910*** -1.802*** -0.692*** -0.011 -1.044*** Free Lunch Percentage -0.726** -0.118 -0.866** -0.224 -0.877** Student-Teacher Ratio -0.003 -0.010*** 0.003 0.004 -0.006 School Size 0.000 0.000 0.000 0.000 0.000* Number of District Schools -0.002*** -0.001 -0.003*** -0.002 -0.003*** Collective Bargaining -0.883*** -1.965*** -0.552*** -0.386 -0.958*** Urban District 0.218 0.025 0.305 -0.108 0.271
2007 0.133 0.068 0.162 -0.268 0.212
Other District Incentives1 District Graduation Rate District Expenditures District Categorization2
Yes Yes Yes Yes Yes Yes Yes Yes Yes Yes Yes Yes Yes Yes Yes Yes Yes Yes Yes Yes Observations 47800 15180 32620 7620 40170 R-Square 0.027 0.054 0.026 0.026 0.027 DV Mean 52.932 53.585 52.720 54.603 52.612
Standard errors in parentheses, clustered by district
1) Other District Incentives: Certification, Field Shortage, Less Desirable Location, Signing Bonus, Relocation Assistance, Loan Forgiveness
2) District Categorization: High Maintenance, Low Maintenance, Overachieving, Underachieving
*p
< 0.10, **p < 0.05, ***p < 0.01
Table 3: First Stage IV Estimate, Equation 2, Excluding Florida from SASS
(1) All DistancePP -0.00015***
(0.00003)
Black 0.043*
Hispanic 0.028
Other Race 0.017
Male 0.003
Masters Degree 0.004
Age -0.000
Age2 0.000
Experience -0.002 Experience2 0.000 Individual in Union -0.018* Urban School 0.012 Elementary School -0.010 Free Lunch Percentage -0.007 Student-Teacher Ratio -0.000 School Size 0.000 Number of District Schools -0.000 Collective Bargaining -0.061*** Urban District 0.056***
2007 0.030**
Other District Incentives1 District Graduation Rate District Expenditures District Categorization2
Yes Yes Yes Yes First Stage F Statistic 20.52 Observations 45220
R-Square 0.128
Standard errors in parentheses, clustered by district
The dependent variable is the probability that a teacher is employed in a performance pay district.
1) Other District Incentives: Certification, Field Shortage, Less Desirable Location, Signing Bonus, Relocation Assistance, Loan Forgiveness
2) District Categorization: High Maintenance, Low Maintenance, Overachieving, Underachieving
*p
< 0.10, **p < 0.05, ***p < 0.01
Note: Sample sizes rounded to nearest 10 for NCES confidentiality purposes
Table 4: IV Estimate of Performance Pay on Work Hours, Excluding Florida from SASS
(1) (2) (3) (4) (5)
Baseline Estimate Performance Pay -15.681***
(4.970) -7.465** (2.7445) -6.108* (2.629) -6.348** (2.634) -4.290 (3.206) Controls Included
Other District Incentives1 District Graduation Rate District Expenditures District Categorization2
No No No No Yes No No No Yes Yes Yes No Yes Yes Yes Yes Yes Yes Yes Yes University State FE No No No No Yes Observations 52840 50780 45220 45220 45180
Standard errors in parentheses, clustered by district
Individual, school, district, and time controls are included. See Table 2 for further description of these controls. 1) Other District Incentives: Certification, Field Shortage, Less Desirable Location, Signing Bonus, Relocation Assistance, Loan Forgiveness
2) District Categorization: High Maintenance, Low Maintenance, Overachieving, Underachieving
*
p < 0.10, **p < 0.05, ***p < 0.01
Table 5: IV Estimates of Performance Pay on Measures of Work Effort, Excluding Florida from SASS
Dependent Variable (1) (2) (3) (4) (5) All Male Female New Experienced Work Hours -6.348** -2.928 -7.124** -2.818 -7.103***
(2.634) (3.511) (3.066) (4.268) (2.738) Teaching Hours1 3.140 8.127* 1.718 -7.237 5.159**
(2.098) (4.328) (2.047) (5.082) (2.503) Math and English Hours 2.683 7.221 1.696 -2.075 3.741*
(1.901) (4.992) (2.018) (5.990) (2.157) Professional Development 0.049*** 0.092* 0.037** 0.055 0.052**
(0.018) (0.050) (0.017) (0.073) (0.024) Additional Job 0.303* 0.509*** 0.214 0.207 0.318**
(0.177) (0.191) (0.220) (0.505) (0.139) Other District Incentives2
District Graduation Rate District Expenditures District Categorization3
Yes Yes Yes Yes Yes Yes Yes Yes Yes Yes Yes Yes Yes Yes Yes Yes Yes Yes Yes Yes Observations 45220 14400 30820 7260 37960
Standard errors in parentheses, clustered by district Each cell in the table is a separate estimating equation
Individual, school, district, and time controls are included. See Table 2 for further description of these controls. Earnings are in $000s
1) Elementary teachers were asked how many hours they spend teaching the following subjects: Math, English, Science, and Social Studies. Restricting the data to elementary teachers reduces the number of observations to 15,170.
2) Other District Incentives: Certification, Field Shortage, Less Desirable Location, Signing Bonus, Relocation Assistance, Loan Forgiveness
3) District Categorization: High Maintenance, Low Maintenance, Overachieving, Underachieving
*
p < 0.10, **p < 0.05, ***p < 0.01
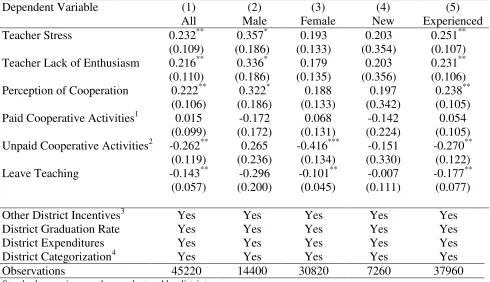
Table 6: IV Estimates of Performance Pay on Job Satisfaction, Cooperation and Retention, Excluding Florida from SASS
Dependent Variable (1) (2) (3) (4) (5) All Male Female New Experienced Teacher Stress 0.232** 0.357* 0.193 0.203 0.251**
(0.109) (0.186) (0.133) (0.354) (0.107) Teacher Lack of Enthusiasm 0.216** 0.336* 0.179 0.203 0.231**
(0.110) (0.186) (0.135) (0.356) (0.106) Perception of Cooperation 0.222** 0.322* 0.188 0.197 0.238**
(0.106) (0.186) (0.133) (0.342) (0.105) Paid Cooperative Activities1 0.015 -0.172 0.068 -0.142 0.054
(0.099) (0.172) (0.131) (0.224) (0.105) Unpaid Cooperative Activities2 -0.262** 0.265 -0.416*** -0.151 -0.270** (0.119) (0.236) (0.134) (0.330) (0.122) Leave Teaching -0.143** -0.296 -0.101** -0.007 -0.177** (0.057) (0.200) (0.045) (0.111) (0.077) Other District Incentives3
District Graduation Rate District Expenditures District Categorization4
Yes Yes Yes Yes Yes Yes Yes Yes Yes Yes Yes Yes Yes Yes Yes Yes Yes Yes Yes Yes Observations 45220 14400 30820 7260 37960
Standard errors in parentheses, clustered by district Each cell in the table is a separate estimating equation
Individual, school, district, and time controls are included. See Table 2 for further description of these controls. 1) Paid cooperative activities: coach a sport, sponsor a student group, club, or organization
2) Unpaid cooperative activities: serve as a department lead or chair, serve as a lead curriculum specialist, and serve on a school-wide or district-wide committee or task force
3) Other District Incentives: Certification, Field Shortage, Less Desirable Location, Signing Bonus, Relocation Assistance, Loan Forgiveness
4) District Categorization: High Maintenance, Low Maintenance, Overachieving, Underachieving
*
p < 0.10, **p < 0.05, ***p < 0.01
Table 7: Falsification Tests, IV Estimate of Performance Pay on Work Hours, Excluding Florida from SASS
(1) (2) (3) (4)
Baseline Estimate
Restrict PP Districts in 2007 to 2003
Math or English Teachers Non Math or English Teachers Performance Pay -6.348**
(2.634) -1.988 (2.531) 0.762 (3.541) -6.038*** (2.197) Other District Incentives1
District Graduation Rate District Expenditures District Categorization2
Yes Yes Yes Yes Yes Yes Yes Yes Yes Yes Yes Yes Yes Yes Yes Yes Observations 45220 22400 10550 34670
Standard errors in parentheses, clustered by district
Individual, school, district, and time controls are included. See Table 2 for further description of these controls. 1) Other District Incentives: Certification, Field Shortage, Less Desirable Location, Signing Bonus, Relocation Assistance, Loan Forgiveness
2) District Categorization: High Maintenance, Low Maintenance, Overachieving, Underachieving
*
p < 0.10, **p < 0.05, ***p < 0.01