0095-1137/01/$04.00⫹0 DOI: 10.1128/JCM.39.12.4264–4268.2001
Copyright © 2001, American Society for Microbiology. All Rights Reserved.
Quantification of Proviral Load of Human Immunodeficiency
Virus Type 2 Subtypes A and B Using Real-Time PCR
FLORENCE DAMOND,
1,2* DIANE DESCAMPS,
1,2ISABELLE FARFARA,
1,2JEAN NOE¨L TELLES,
1,2,3SOPHIE PUYEO,
4PAULINE CAMPA,
1,2ANNIE LEPREˆTRE,
1,2SOPHIE MATHERON,
1,2FRANC¸OISE BRUN-VEZINET,
1,2ANDFRANC¸OIS SIMON
1,2,5Laboratoire de Virologie
1et Service des Maladies Infectieuses et Tropicales A,
2Hoˆpital Bichat-Claude Bernard, Paris,
Biomerieux S.A., 69280 Marcy l’Etoile,
3INSERM, Unite´ de Recherche U330, Universite´ Victor Segalen, Bordeaux,
4and Laboratoire de Virologie, CHU Charles Nicolle, Rouen,
5France
Received 14 March 2001/Returned for modification 14 September 2001/Accepted 20 September 2001
We have developed and evaluated a new method to quantify human immunodeficiency virus type 2 (HIV-2)
proviral DNA based on LightCycler real-time PCR. The assay has a detection limit of 5 copies/10
5peripheral
blood mononuclear cells (PBMC) and is insensitive to HIV-2 strain variability: HIV-2 subtypes A and B are
both recognized and quantified. The intra- and interassay coefficients of variation range from 16 to 40% for
high provirus concentrations (5
ⴛ
10
5copies) and from 41 to 39% for low concentrations (5 copies). We used
this method to compare the proviral DNA load and viral RNA load in plasma with clinical and immunological
status for 29 patients infected by HIV-2 (subtype A in 17 and subtype B in 12). The proviral load (median, 201
copies/10
5PBMC) was similar to that reported for HIV-1 infection. The median proviral loads did not correlate
with the CD4
ⴙcell count categories and were as follows for CD4
ⴙcell counts of >400, 200 to 400, and <200
cells/mm
3, respectively: 121 copies/10
5PBMC (
n
ⴝ
8; range, <5 to 712 copies/10
5PBMC); 114 copies/10
5PBMC (
n
ⴝ
9; range, <5 to 1,907 copies/10
5PBMC); and 285 copies/10
5PBMC (
n
ⴝ
12; range, 53 to 2,524
copies/10
5PBMC). Proviral load did not correlate with plasma HIV-2 RNA positivity. As HIV-2 is considered
to replicate less efficiently than HIV-1, these high proviral loads might be explained by the proliferation of
infected cells.
Human immunodeficiency virus type 2 (HIV-2) was first
isolated in 1986 from peripheral blood mononuclear cells
(PBMC) from patients in the Cape Verde Islands and
Guinea-Bissau (7). Heterosexual and vertical HIV-2 transmission rates
are lower than those of HIV-1 (4, 21, 24). HIV-2-infected
patients exhibit a longer clinical latency period and progress
more slowly toward AIDS (17, 22). The origins of these viruses
have been clearly linked to cross-species transmission events
between mangabeys (
Cercocebus atys
, small West African
mon-keys) and humans (23). Six HIV-2 subtypes have so far been
described (6, 14). Only HIV-2 subtypes A and B are prevalent,
the others being considered self-limiting infections at the
epi-demiological level. HIV-2 infection is mostly confined to West
Africa (12).
The CD4
⫹cell count correlates negatively with clinical
sta-tus in both HIV-2 and HIV-1 infections (3, 33). In contrast,
HIV-2 is more difficult to detect in plasma than HIV-1 (3, 28).
This fact has led us and others to consider HIV-2 poorly
replicative, at least early in the infection (3, 12, 28, 33). This
factor could explain the epidemiological and clinical
differ-ences between HIV-2 and HIV-1 infections. The reasons for
this poorer fitness of HIV-2 in humans is unclear. The animal
counterpart of HIV-2, SIVsm (infecting mangabeys), is highly
replicative in its natural host, with high cellular and plasma
viral loads, but is nonpathogenic (30). The reason for this lack
of replicative robustness remains unclear.
For HIV-1 infection, it has been demonstrated that proviral
load correlates with disease progression (32). Previous
quan-titative assessments of HIV-2 proviral load have proposed, as
for HIV-1, an inverse correlation with the CD4
⫹cell count and
clinical outcome (2, 27, 31). However, recent reports have
suggested that HIV-2 proviral load does not correlate with the
CD4
⫹cell count (15, 29).
The development of new quantitative methods using
real-time PCR technology has led us to evaluate those methods for
proviral HIV-2 DNA quantitation in 29 HIV-2-infected
pa-tients living in France. We also tested plasma RNA detection
and compared the findings with immunological and clinical
status.
MATERIALS AND METHODS
Study population and sample collection. The study group consisted of 29 patients (17 males and 12 females) who had been enrolled since 1991 in the French National HIV-2 Cohort. These patients originated from various countries in West Africa, North Africa, and Europe. The infecting strains had been pre-viously sequenced in theenvregion: 17 were subtype A, and 12 were subtype B (11). The epidemiological and clinical characteristics of the patients are summa-rized in Table 1.
According to Centers for Disease Control and Prevention criteria (5), 23 patients were in stage A and 6 were in stage C. Eight patients had CD4⫹cell counts above 400⫻106/liter (median, 511; range, 413 to 832), 9 had counts
between 200⫻106and 400⫻106/liter (333; 210 to 391), and 12 had counts below
200⫻106/liter (68; 13 to 199). Fourteen patients were receiving antiretroviral
treatment at enrollment in this study (one drug for 9, two drugs for 3, and three drugs for 2).
Sample preparation and DNA extraction. Whole blood was collected in EDTA-containing Vacutainer tubes, and PBMC were isolated by
Ficoll-* Corresponding author. Mailing address: Laboratoire de Virologie,
Hoˆpital Bichat-Claude Bernard, 46 Rue Henri Huchard, 75877 Paris
Cedex 18, France. Phone: 00 33 1 40 25 88 96. Fax: 00 33 1 40 25 67 69.
E-mail: [email protected].
4264
on May 15, 2020 by guest
http://jcm.asm.org/
Hypaque density gradient centrifugation. Plasma was clarified and stored at
⫺80°C until viral RNA assays were done. DNA was extracted using a QIAamp DNA mini kit (QiAgen) and quantified spectrophotometrically. Cellular and plasma viral culturing was performed as previously described (33).
Preparation of HIV-2 DNA and RNA assay standards.DNA templates were derived from a PCR-amplified region of thegaggene of HIV-2 strain ROD. HIV-2 ROD DNA in fresh PBMC was amplified by nested PCR with a first round of long PCR. The LTR1-5⬘–LTR2-3⬘primer pair was used for the first amplification step as previously described (10). Nested PCR was done using the following primers containing enzyme restriction sequences at their 5⬘extremities: QC1Bam, 5⬘-GATTGCGGATCCGTGGGAGAATGGGCGCGAGA-3⬘, and GAG OG AS1 Hind, 5⬘-CTGCATAAGCTTGCCTTCTGAGAGTGCCTGAA ATCC-3⬘(Genset, Paris, France). The resulting PCR product was cloned into vector pGEM3Z (Promega, Madison, Wis.). Plasmids were purified on columns with a Qiagen kit and quantified byA260measurements. To control the validity of our primers, the amplified product was sequenced.
RNA transcripts were obtained from the linearized templates by using a Riboprobe in vitro transcription system according to the manufacturer’s instruc-tions (Promega). RNA was quantified spectrophotometrically at 260 nm. Tran-scripts were diluted to 106copies/l, divided into aliquots, and stored at⫺80°C.
Subsequent dilutions were made in a solution containing carrier tRNA (from
Escherichia coli; 30g/ml; Sigma, St. Louis, Mo.).
Plasma RNA detection.Viral RNA was extracted from 1 ml of plasma and ultracentrifuged for 1 h at 4°C using an HCV specimen preparation kit (Roche Diagnostics Systems). RNA was amplified by a one-step procedure using a Titan one-tube RT-PCR kit (Roche) with primers located in thegagregion (GAG OG S1 and GAG OG AS1). Amplified products were subjected to nested PCR with primers GAG OG S2 and GAG OG AS2 as previously described (16, 19). The efficiency and sensitivity of qualitative reverse transcription-PCR for detection of viral RNA isolated from plasma were determined by using a transcript standard diluted in 200l of RPMI medium to obtain 5,000, 1,000, 500, and 250 copies (seven replicates each). The standard was extracted and processed as described above. The sensitivities of reverse transcription-PCR were 100% at 5,000, 1,000, and 500 copies/ml and 66% at 250 copies/ml.
PCR primers and labeled hybridization probe.In order to avoid major mis-matches due to HIV-2 variability, the primers and probe were designed using specific software from TibmolBiol (Berlin, Germany), on the basis of all HIV-2 subtype A and B sequences so far published, according to the Los Alamos National Laboratory database (26). Primers used for amplification were located in the highly conservedgagregion: U3, 5⬘-GGGAGATGGGCGCGAGA-3⬘, and L140, 5⬘-TCCAACAGGCTCTCTGCTAATCC-3⬘. Probe S65GAG2 had the se-quence 5⬘-R-TAGGTTACGGCCCGGCGGAAAGA-Q-3⬘, where reporter R indicates a 6-carboxyfluorescein group and quencher Q indicates a 6-carboxytet-ramethylrhodamine group conjugated through a linker arm nucleotide as de-scribed previously (35). The specificity of the primers was evaluated with refer-ence samples (11).
Proviral load quantitation.Real-time quantitative PCR was performed using an LC Fast Start DNA master mix hybridization probe kit (Roche Molecular Diagnostics). Each PCR mixture (20-l total volume) contained the follow-ing: 2l of DNA master mix, 2.4l of 25 mM MgCl2, primers U3 and L140 (0.8M each), TaqMan probe S65 (100 nM), and 20l of H2O qsp. Cycling
parameters were as follows: denaturation for 8 min at 95°C, followed by 45 cycles of 10 at 95°C and 40 at 60°C. For each run, a standard curve was generated from purified HIV-2gagplasmid ranging from 5⫻105to 5 copies.
Fresh dilutions of the control were prepared with salmon sperm DNA (100 ng/ml) before each experiment from a stock stored at⫺20°C. Five hundred nanograms of DNA from each patient was analyzed. Results were expressed in copies per 105PBMC.
[image:2.587.44.541.83.377.2]Reproducibility of DNA quantitation with the LightCycler system.To assess the inter- and intra-assay reproducibilities of the LightCycler system, we first analyzed two- and fivefold differences in the starting copy number using 25,000 to 50,000 and 5,000 to 25,000 copies per capillary (12 replicates each). Calcula-tions were determined with the cycle threshold (CT). We also tested 10-fold differences in copy number with a broader concentration range: from 5 to 50 copies (10 replicates each), 500 to 5,000 copies (6 replicates), and 50,000 to 500,000 copies (4 replicates). The last experiment was used to assess the inter-assay reproducibility (10 runs at each point from 5 to 5⫻105copies).
TABLE 1. Epidemiological, clinical, and virological characteristics of the 29 HIV-2-infected patients
Patient Age (yr) Sexa Geographic
origin Subtype Stage Treatmentb CD4
⫹cell count
(106cells/liter) Cell cultureresultc detectionRNA c DNA viral load (copies)/105PBMC
1
45
M
Mali
A
C
AZT
54
⫹
⫹
199
2
41
M
Mali
A
C
AZT-3TC
24
⫹
⫹
2,524
3
46
F
Mali
A
C
DDC
25
⫹
⫹
1,287
4
43
M
France
A
C
AZT
31
⫹
⫹
369
5
42
M
Burkina Faso
A
A
AZT-3TC
37
⫹
⫹
2,342
6
45
M
Ivory Coast
B
A
D4T-3TC-IDV
83
⫹
⫹
69
7
47
M
Senegal
B
C
AZT
120
⫹
⫹
161
8
63
M
France
B
A
AZT-3TC-IDV
13
⫺
⫺
53
9
39
M
Ivory Coast
B
A
AZT-DDI
153
⫹
⫹
80
10
32
F
Martinique
B
A
AZT
178
⫹
⫹
791
11
57
F
France
A
A
AZT
189
⫹
⫹
457
12
31
M
Guinea-Bissau
A
A
DDC
199
⫹
⫹
201
13
43
F
Senegal
A
A
NT
210
⫹
⫺
1,907
14
25
F
Ivory Coast
A
A
NT
240
⫹
⫺
1,730
15
36
F
Cape Verde Islands
A
A
NT
333
⫺
⫺
⬍5
16
45
M
Mali
B
C
AZT
283
⫹
⫺
92
17
57
M
France
B
A
NT
328
⫺
⫺
⬍5
18
64
F
Cape Verde Islands
A
A
NT
339
⫹
⫹
354
19
27
F
Ivory Coast
B
A
NT
347
⫹
⫺
5
20
35
M
Guinea-Bissau
A
A
NT
375
⫹
⫹
709
21
39
M
Morocco
A
A
NT
391
⫹
⫺
114
22
37
M
Mali
A
A
NT
540
⫺
⫹
⬍5
23
34
F
Ivory Coast
A
A
NT
644
⫺
⫺
223
24
41
M
France
A
A
AZT
474
⫺
⫺
⬍5
25
33
F
Ivory Coast
B
A
NT
799
⫺
⫺
712
26
33
F
Senegal
A
A
NT
832
⫹
⫹
334
27
62
F
France
B
A
NT
418
⫹
⫹
390
28
27
M
Ivory Coast
B
A
NT
413
⫹
⫹
19
29
55
M
Congo
B
A
NT
483
ND
⫺
⬍5
aM, male; F, female.
bAZT, zidovudine; 3TC, lamivudine; DDC, dideoxycytidine; IDV, indinavir; NT, no treatment; DDI, didanosine; D4T, stavudine. c⫹, positive;⫺, negative; ND, not done.
on May 15, 2020 by guest
http://jcm.asm.org/
RESULTS
Reproducibility of the LightCycler system for HIV-2 DNA
quantitation.
DNA concentrations of 5,000, 25,000, and 50,000
copies were distinguished with high confidence. The
coeffi-cients of variation (CVs) ranged between 0.31 and 0.56% for
the CT and between 7.5 and 12.9% for the copy number (Table
2). At a high virus concentration (mean, 534,340 copies per 10
5PBMC), the intra-assay CV was 16%. At a mean copy number
of 586,692 per 10
5PBMC, the interassay CV was 40%. At the
lowest concentration (five copies), the intra-assay CV was 41%
and the interassay CV was 39%. Intra- and interassay CVs are
summarized in Table 3.
Sensitivity of the LightCycler system for HIV-2 DNA
quan-titation.
The sensitivities of the assay on the basis of repeated
testing (eight replicates) of the lower concentrations of our
plasmid standard were 100% at 5 copies, 62% at 2.5 copies,
and 75% at 1 copy. Consequently, we set the detection limit of
the assay at five copies.
HIV-2 proviral DNA detection according to subtype.
DNA
viral load, expressed as copies per 10
5PBMC, was determined
for the 29 HIV-2-infected patients. DNA was detected in 24
(83%) of the 29 patients and was consistently below five copies
in the other 5 patients. The lack of HIV-2 provirus
amplifica-tion was not linked to the subtype, three subtype A and two
subtype B samples being below the cutoff. This result indicates
that the selected primers and probes cover a wide range of
HIV-2 diversity.
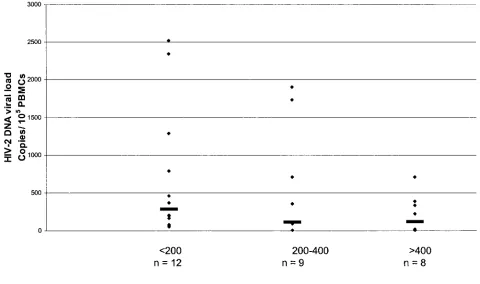
HIV-2 proviral load is high whatever the CD4
ⴙcell count.
[image:3.587.300.544.85.189.2]Levels of proviral DNA ranged from 5 to 2,524 copies per 10
5FIG. 1. HIV-2 proviral load according to CD4
⫹cell count category. Horizontal lines represent median values in each category. Samples below
[image:3.587.43.283.93.157.2]the limit of detection were given a value of four copies/10
5PBMC. The number of samples in each category is shown. There is no correlation among
the three groups (
2⫽
3.071;
P
⬍
0.3; Kruskal-Wallis test).
TABLE 2. CVs for quantitation of standards of 5,000, 25,000,
and 50,000 copies
Copies % CV for:
CT Copy no.
5,000
0.5
11.8
25,000
0.31
7.5
50,000
0.56
12.9
TABLE 3. Intra- and interassay precision of the LightCycler system
Copies
Reproducibility
Intra-assay Interassay
% CV Meana % CV Meana
5
41
11
39
9
50
31
82
35
44
500
34
727
39
430
5,000
11.8
2,363
32
3,951
50,000
12.9
39,880
30
44,559
5,000,000
16.3
534,340
40
586,692
aValues are in copy numbers per milliliter.
on May 15, 2020 by guest
http://jcm.asm.org/
[image:3.587.51.531.391.675.2]PBMC, with a median of 201 copies/10
5PBMC. These values
are similar to those previously reported for both HIV-2 and
HIV-1 (1, 2, 8, 15, 27, 29, 31). DNA viral load in these 29
patients was then examined according to the following CD4
⫹cell count categories:
⬍
200/mm
3(all these patients being on
antiretroviral therapy), 200 to 400/mm
3, and
⬎
400/mm
3. The
respective median proviral loads per 10
5cells were 285 (12; 53
to 2,524 [
n
, range]), 114 (9;
⬍
5 to 1,907), and 121 (8;
⬍
5 to
712). This trend toward increasing proviral load according to
CD4
⫹cell count was not significant. All the samples with
negative provirus amplification were from patients with CD4
⫹cell counts above 328
⫻
10
6cells/liter. Viral load did not differ
significantly among these three categories of CD4
⫹cell count
(
2⫽
3.071;
P
⬍
0.3; Kruskal-Wallis test) (Fig. 1).
HIV-2 proviral load does not influence plasma RNA
detec-tion.
There was no significant relationship between the level of
HIV-2 proviral load and the rate of plasma RNA detection
(
U
⫽
61;
P
⬍
0.07, Mann-Whitney test). All but one of the
patients with a CD4
⫹cell count below 200
⫻
10
6/liter were
positive for plasma RNA; the remaining patient was receiving
antiretroviral tritherapy (Table 4). A correlation was found
between positive cell culture and viral DNA load (
U
⫽
26;
P
⬍
0.02; Mann-Whitney test).
DISCUSSION
We evaluated a real-time PCR assay with the LightCycler
system for HIV-2 proviral DNA quantitation in clinical
spec-imens. The LightCycler system is simple and rapid and offers a
standardized approach to HIV-2 DNA quantitation. It also
avoids false-positive results due to PCR contamination.
In our experiments, the reproducibility of the system was
similar to that of commercial viral load kits (9, 25). The high
sensitivity of our assay (detection limit, 5 DNA copies/10
5cells) must be emphasized, as it provides ample opportunities
for further clinical studies. Given the importance of HIV-2
genetic diversity, we first tried to select conserved and efficient
segments of the viral genome to use as primers. During a
previous evaluation (data not shown) with different
gag
primers
(U5, 5
⬘
-GAGAATGGGCGCGAGAAACT-3
⬘
, and L130, 5
⬘
-AATTCATTCGCTGCCCACAC-3
⬘
), we successfully
ampli-fied all the A subtypes but failed to amplify any B subtypes.
This result convinced us of the underlying importance of
primer and probe design in genome-based detection assays.
Previous studies of HIV-2 quantitation were performed in
West Africa, where only subtype A circulates (1, 2, 31). In
contrast, subtype B is frequent in HIV-2-infected patients
liv-ing in France (11) and probably in other Western countries as
well (18), creating the need to assess a large panel of
repre-sentative HIV-2 strains.
The levels of HIV-2 proviral DNA found in the 29 patients
tested here were high and similar to those observed in studies
of HIV-2 subtype A infections (1, 2, 15). We found no
signif-icant differences in the amount of proviral DNA according to
subtype. Likewise, we found no correlation between proviral
DNA level and CD4
⫹cell count or viral RNA positivity. These
results for DNA quantitation are similar to those recently
reported by Popper et al. (29) and Gomes et al. (15), although
other studies have shown a correlation between these
param-eters (2, 27, 31). Popper et al. also reported a lack of
correla-tion between levels of viral RNA and proviral DNA (29).
Because of the low pathogenicity of HIV-2 compared to that
of HIV-1, we were intrigued in find low HIV-2 proviral loads
but relatively large amounts of HIV-2 DNA in our patients. A
selection bias can be ruled out, as the majority of the patients
were symptom free and the CD4
⫹cell count distribution was
normal. In a community-based study, Ariyoshi et al. found
similar high levels of HIV-2 DNA, regardless of the percentage
of CD4
⫹cells (1). Although not statistically significant, we
tended to find higher levels of HIV-2 DNA and a trend toward
lower CD4
⫹cell counts with more advanced stages of
infec-tion. The effect of antiretroviral treatment in patients with
CD4
⫹cell counts of
⬍
200/
l could explain the lack of
corre-lation between proviral loads and CD4
⫹cell counts.
Alterna-tively, our results could be due to a high rate of defective
integrated virus. Low cellular pathogenicity of HIV-2 in the
early stages of infection, together with the long duration of the
symptom-free period, could explain the high proviral loads. As
with human T-cell leukemia virus type 1 infection, where high
proviral loads have been reported (13, 20, 34), normal
prolif-eration of infected cells could explain the large number of
PBMC harboring proviral DNA. This discordance between
high proviral loads and inefficient replication of HIV-2 might
help to explain the roles of viral replication and immune
re-sponses in HIV-2 disease.
ACKNOWLEDGMENT
This study was supported by French National Agency on AIDS
Research (A.N.R.S.) grant 98015.
REFERENCES
1.Ariyoshi, K., N. Berry, A. Wilkins, D. Ricard, P. Aaby, A. Naucler, P. T. Ngom, O. Jobe, S. Jaffar, F. Dias, R. S. Tedder, and H. A. Whittle.1996. Community-based study of human immunodeficiency virus type 2 provirus load in rural village in West Africa. J. Infect. Dis.173:245–248.
[image:4.587.43.543.85.156.2]2.Berry, N., K. Aryoshi, O. Jobe, P. T. Ngum, T. Corrah, A. Wilkins, H. Whittle, and R. Tedder.1994. HIV type 2 proviral load measured by quan-titative polymerase chain reaction correlates with CD4⫹lymphopenia in
TABLE 4. Relationships among the CD4
⫹cell count, HIV-2 proviral load, cell culture positivity, and plasma RNA positivity
CD4⫹cell count
(no./mm3) patients testedNo. of
Median (range) No. positive/no. tested (%) for: CD4⫹cell count,
106/liter copies/10Viral DNA load,5PBMC Cell culture Plasma RNA
⬍200
12
a68 (13–199)
285 (53–2,524)
11/12 (92)
11/12 (92)
200–400
9
b333 (210–391)
114 (⬍5–1,907)
2/9 (22)
7/9 (78)
⬎400
8
b511 (413–832)
121 (⬍5–712)
3/7 (43)
4/8 (50)
aEleven patients were treated. bOne patient was treated.
on May 15, 2020 by guest
http://jcm.asm.org/
HIV type 2 infected individuals. AIDS Res. Hum. Retrovir.10:1031–1037. 3.Berry, N., K. Ariyoshi, S. Jaffar, S. Sabally, T. Corrah, R. S. Tedder, and H. A. Whittle.1998. Low peripheral blood viral HIV-2 RNA in individuals with high CD4⫹percentage differenciates HIV-2 from HIV-1 infection. J. Hum. Virol.1:457–468.
4.Bruker, G., F. Brun-Ve´zinet, M. Rosenheim, M. A. Rey, C. Katlama, and M. Gentilini.1987. HIV-2 infection in two homosexual men in France. Lancet
i:223.
5.Centers for Disease Control and Prevention.1992. 1993 Revised classifica-tion system for HIV infecclassifica-tion and expanded surveillance case definiclassifica-tion for AIDS among adolescent and adults. Morb. Mortal. Wkly. Rep.41:1–19. 6.Chen, Z., A. Luckay, D. L. Sodora, P. Telfer, P. Reed, A. Gettie, J. M. Kanu,
R. F. Sadek, J. A. Yee, D. D. Ho, L. Zhang, and P. A. Marx.1997. Human immunodeficiency virus type 2 (HIV-2) seroprevalence and characterization of a distinct HIV-2 genetic subtype from the natural range of simian immu-nodeficiency virus-infected sooty mangabey. J. Virol.71:3953–3960. 7.Clavel, F., D. Guetard, F. Brun-Ve´zinet, S. Chamaret, M. A. Rey, M. O.
Santos-Ferreira, A. G. Laurent, C. Dauguet, C. Katlama, C. Rouzioux, D. Klatzmann, J. L. Champalimaud, and L. Montanier.1986. Isolation of a new human retrovirus from West African patients with AIDS. Science233:343– 346.
8.Clementi, M., S. Menzo, P. Bagnarelli, A. Valenza, S. Paolucci, R. Sam-paolesi, A. Manzin, and P. E. Varaldo.1996. Clinical use of quantitative molecular methods in studying human immunodeficiency virus type 1 infec-tion. Clin. Microbiol. Rev.9:135–147.
9.Coste, J., B. Montes, J. Reynes, M. Peeters, C. Segarra, J. P. Vendrell, E. Delaporte, and M. Segondy.1996. Comparative evaluation of three assays for the quantitation of human immunodeficiency virus type 1 RNA in plasma. J. Med. Virol.50:293–302.
10.Damond, F., I. Loussert-Ajaka, C. Apetrei, D. Descamps, S. Souquie`re, A. Lepreˆtre, S. Matheron, F. Brun-Ve´zinet, and F. Simon.1998. Highly sensi-tive method for amplification of human immunodeficiency virus type 2 DNA. J. Clin. Microbiol.36:809–811.
11.Damond, F., C. Apetrei, D. L. Robertson, S. Souquie`re, A. Lepreˆtre, S. Matheron, F. Brun-Ve´zinet, and F. Simon.2001. Variability of human im-munodeficiency virus type 2 infecting patients living in France. Virology
280:19–30.
12.De Cock, K., and F. Brun-Ve´zinet.1989. Epidemiology of HIV-2 infection. AIDS3(Suppl. 1):S89–S95.
13.Gabet, S. A., F. Mortreux, A. Talarmin, Y. Plumelle, I. Leclercq, A. Leroy, A. gessain, E. Clity, M. Joubert, and E. Wattel.2000. High circulating proviral load with oligoclonal expansion of HTLV-1 bearing T cells in HTLV-1 carriers with strongyloidiasis. Oncogene19:4954–4960.
14.Gao, F., L. Yue, D. L. Robertson, S. C. Hill, H. Hui, R. J. Biggar, A. E. Neequaye, T. M. Whelan, D. D. Ho, G. M. Shaw, P. M. Sharp, and B. H. Hahn.1994. Genetic diversity of human immunodeficiency virus type 2: evidence for distinct sequence subtypes with differences in virus biology. J. Virol.68:7433–7447.
15.Gomes, P., N. C. Taveira, J. M. Pereira, F. Antunes, M. O. Ferreira, and M. H. Lourenco.1999. Quantitation of human immunodeficiency virus type 2 DNA in peripheral blood mononuclear cells by using a quantitative-com-petitive PCR assay. J. Clin. Microbiol.37:453–456.
16.Grankvist, O., U. Bredberg-Raden, A. Gustafsson, J. Albert, P. Albino, P. A. Andreasson, A. Naucler, G. Biberfeld, and G. Wadell.1992. Improved de-tection of HIV-2 DNA in clinical samples using a nested primer based polymerase chain reaction. J. Acquir. Immune Defic. Syndr. Hum. Retrovi-rol.5:286–293.
17.Kanki, P. J., K. U. Travers, S. Mboup, C. C. Hsieh, R. G. Marlink, A. Gue`ye-Ndiaye, T. Siby, I. Thior, M. Hernandezavila, J. L. Sankale, I. Ndoye, and M. E. Essex.1994. Slower heterosexual spread of HIV-2 than HIV-1. Lancet343:943–946.
18.Ku¨hnel, H., H. Von Briesen, U. Dietrich, M. Adamski, D. Mix, L. Biesert, R. Kreutz, A. Immelmann, K. Henco, C. Meichsner, R. Andreesen, H. Gelder-blom, and H. Ru¨bsamen-Waigmann.1989. Molecular cloning of two West African human immunodeficiency virus type 2 isolates that replicate well in macrophage: a Gambian isolate, from a patient with neurologic acquired immunodeficiency syndrome, and a highly divergent Ghanian isolate. Proc.
Natl. Acad. Sci. USA86:2383–2387.
19.Loussert-Ajaka, I., F. Simon, I. Farfara, D. Descamps, G. Collin, and F. Brun-Ve´zinet.1995. Detection of circulating human immunodeficiency virus type 2 in plasma by reverse transcription polymerase chain reaction. Res. Virol.146:409–414.
20.Manns, A., W. J. Miley, R. J. Wilks, O. S. Morgan, B. Hanchard, G. Wharfe, B. Cranston, E. Maloney, S. L. Welles, W. A. Blattner, and D. Waters.1999. Quantitative proviral DNA and antibody levels in the natural history of HTLV-1 infection. J. Infect. Dis.180:1487–1493.
21.Marlink, R.1996. Lessons from the second virus, HIV-2. AIDS10:689–699. 22.Marlink, R. G., D. Ricard, S. Mboup, P. J. Kanki, J. L. Romet-Lemonne, I. N. Doye, K. Diop, M. A. Simpson, F. Greco, M. J. Chou, V. Degruttola, C. C. Hsieh, C. Boye, F. Barin, F. Denis, M. F. McLane, and M. Essex.1988. Clinical, hematologic and immunologic cross-sectional evaluation of individ-uals exposed to human immunodeficiency virus type 2. AIDS Res. Hum. Retrovir.2:137–148.
23.Marx, P. A., Y. Li, N. W. Lerche, S. Sutjipto, A. Gettie, J. A. Yee, B. H. Brotman, A. M. Prince, A. Hanson, R. G. Webster, and R. C. Desrosiers.
1991. Isolation of a simian immunodeficiency virus related to human immu-nodeficiency virus type 2 from a West African pet sooty mangabey. J. Virol.
65:4480–4485.
24.Matheron, S., C. Courpotin, F. Simon, H. Di Maria, S. Balloul, S. Bartzack, D. Dormont, F. Brun-Ve´zinet, A. G. Saimot, and J. P. Coulaud.1990. Ver-tical transmission of HIV-2. Lancet335:1103–1104.
25.Murphy, D. G., P. Gonin, and M. Fauvel.1999. Reproducibility and perfor-mance of human immunodeficiency virus type 1 RNA in plasma. J. Clin. Microbiol.37:812–814.
26.Myers, G., B. Foley, J. W. Mellors, B. Korber, K. T. Jeang, and S. Wain-Hobson. 1996. Human retroviruses and AIDS 1996. A compilation and analysis of nucleic acid and amino-acid sequences. Los Alamos National Laboratory, Los Alamos, N.Mex.
27.Norrgren, H., S. Marquina, T. Leitner, P. Aaby, M. Melbye, A. G. Poulsen, O. Larsen, F. Dias, D. Escanilla, S. Andersson, J. Albert, and A. Naucler.
1997. HIV-2 genetic variation and DNA load in asymptomatic carriers and AIDS cases in Guinea-Bissau. J. Acquir. Immune Defic. Syndr. Hum. Ret-rovirol.16:31–38.
28.Popper, S. J., A. D. Sarr, K. U. Travers, A. Gueye-Ndiaye, S. Mboup, M. E. Essex, P. J. Kanki.1999. Lower human immunodeficiency virus (HIV) type 2 viral load reflects the difference in pathogenicity of HIV-1 and HIV-2. J. Infect. Dis.180:1116–1121.
29.Popper, S. J., A. D. Sarr, A. Gueye-Ndiaye, S. Mboup, M. E. Essex, and P. J. Kanki.2000. Low plasma human immunodeficiency virus type 2 viral load is independent of proviral load: low virus production in vivo. J. Virol.74:1554– 1557.
30.Rey-Cuille´, M. A., J. L. Berthier, M. C. Bomsel-Demontoy, Y. Chaduc, L. Montagnier, A. G. Hovanessian, and L. A. Chakrabarti.1998. Simian im-munodeficiency virus replicates to high levels in sooty mangabeys without inducing disease. J. Virol.72:3872–3886.
31.Sarr, A. D., S. Popper, I. Thior, D. J. Hamel, J. L. Sankale, T. Siby, R. Marlink, M. E. Essex, S. Mboup, and P. J. Kanki.1999. Relation between HIV-2 proviral load and CD4⫹lymphocyte count differs in monotypic and dual HIV infections. J. Hum. Virol.2:45–51.
32.Schechter, M. T., P. W. Neumann, M. S. Weaver, J. S. Montaner, S. A. Cassol, T. N. Le, K. J. Craib, and M. V. O’Shaughnessy.1991. Low HIV-1 proviral DNA burden detected by negative polymerase chain reaction in seropositive individuals correlates with slower disease progression. AIDS
5:373–379.
33.Simon, F., S. Matheron, C. Tamalet, I. Loussert-Ajaka, S. Bartzack, J. M. Pe´pin, C. Dever, E. Gamba, C. Elbim, J. A. Gastaut, A. G. Saimot, and F. Brun-Ve´zinet.1993. Cellular and plasma viral load in patients infected with HIV-2. AIDS7:1411–1417.
34.Wattel, E., M. Cavrois, A. Gessain, and S. Wain-Hobson. 1996. Clonal expansion of infected cells: a way of life for HTLV-1. J. Acquir. Immune Defic. Syndr. Hum. Retrovirol.13(Suppl. 1):S92–S99.
35.Wittwer, C. T., K. M. Ririe, R. V. Andrew, D. A. David, R. A. Gundry, and U. J. Balis.1997. The LightCycler: a microvolume multisample fluorimeter with rapid temperature control. BioTechniques22:176–181.