3270
AN IMPROVED PERIPHERAL ENHANCEMENT OF
MAMMOGRAM IMAGES BY USING FILTERED REGION
GROWING SEGMENTATION
1NIRASE FATHIMA ABUBACKER, 2AZREENAZMAN*, 3MASRAH AZRIFAH AZMI MURAD,
3
SHYAMALA DORAISAMY 1
Lecturer, Asia Pacific University of Technology and Innovation, Technology Park Malaysia, Bukit Jalil, 57000 Kuala Lumpur, Malaysia
2
Senior Lecturer, Universiti Putra Malaysia, Faculty of Computer Science and Information Technology, 43400 Serdang, Selangor, Malaysia
3
Associate Professor, Universiti Putra Malaysia, Faculty of Computer Science and Information Technology, 43400 Serdang, Selangor, Malaysia
E-mail: [email protected], 2,3{azreenazman,masrah,shyamala}@upm.edu.my
ABSTRACT
During the mammographic acquisition, the breast is compressed with a tilting compression paddle; hence the breast thickness is non-uniform across the mammogram and thinner in the peripheral area and therefore over exposing this area. In Computer Aided Detection systems, peripheral enhancements were used as a pre-processing stage for the enhancement of peripheral visibility of the uncompressed region of the projected breasts. A correction function is required to expand the perceptibility of the peripheral area that necessitates a better-segmented output of the peripheral region. This paper aims to improve the peripheral enhancement technique by using region growing segmentation method combined with an average filter that scales the grey level of the border regions to brighten the mammogram image. The filter enhances the details of those images and helps to obtain a better segmentation output, which is used as an input to the peripheral enhancement process. In the evaluation, a total of 600 images that consists of 300 normal, 170 benign and 130 malignant mass images, which are obtained from the Digital Database Screening Mammography (DDSM) dataset of the University of South Florida are used. The quality of an image after the peripheral enhancement process is evaluated subjectively and objectively, by using visual illustrations and the peak signal-to-noise ratio (PSNR), respectively. The results obtained show that the filtered region growing segmentation method outperforms the Otsu and the K-means segmentation methods.
Keywords: Mammography Image Processing, Radiographic Image Enhancement, Computer-assisted
Diagnosis, Image Quality
1. INTRODUCTION
The advancement in digital images has created a new breakthrough in every field. Medical imaging has developed into one of the most important fields due to its continuous growth in computerized medical image visualization and advances in analysis methods. Current improvements in computer innovation have enormous effect on medical imaging. The latest development in breast disease screening is the results of advancements in cutting edge imaging innovation. As such, digital mammography has become the most excellent gold standard screening method for breast cancer detection in its early stage [1].
3271 physicians as abnormal, which lead to more stressful tests and unnecessary diagnostic procedures for the normal patient. Moreover, the misinterpretation of abnormal mammograms can result in the high rate of death [7].
Computer-aided diagnosis (CADx) has gained significant attention in helping radiologists interpreting mammograms in order to assist in diagnostic decision-making [8]. A more effective CADx invariably increases the probability of cure. In particular, an automated mammogram detection/classification system could provide the second opinion that could improve the chances of detecting tumours and also reduce the human workload associated with the diagnosis. Such a system is capable to classify and suggest the pathological terms for a new mammography image [9]. These suggested terms can be presented to doctors as additional information to assist them in the diagnosis of breast cancer.
However, in order to effectively classify mammogram for CADx, there are some limitations in the process of breast mass diagnosis [10]. Accurate segmentation of a breast region is an important step for processing of the mammogram image. The mammogram may contain some labels namely the background and that must be removed before conducting subsequent tasks such as feature extraction and classification. The background region of a digital mammogram is totally black and uniform. Therefore, the background is composed of all pixels with an intensity equal to zero. However, mammogram contains many artefacts [11] and due to this nature the dark regions of the border may be set to background which are likely to be ignored during the segmentation process. As such some parts of the peripheral region may be missed by the segmentation techniques. Hence, an effective peripheral enhancement method is required to enhance the image to obtain a better segmentation output.
In general, the mammogram uses a machine that takes a lower dose x-ray by flattening the breast between 2 plates to look at only the breast tissues that spread apart. However, this flattening of the breasts is subject to deformation due to the heavy force applied during compression. This deformation leads to a difference in the thickness of the breast for about two centimetres from the breast margin to the chest wall that will affect image analysis [12]. Hence, a smooth varying correction function is required to expand the perceptibility of the peripheral area as it has less thickness tissues and looks darker as compared to the interior part of the
mammogram. The peripheral equalization is applied to the estimated darkening area that will transform the image to have similar grey level values for tissues in the interior and the peripheral area of the mammogram. Thus, very less manual contrast adjustments are required for viewing the skin line details due to the effect of peripheral enhancement [13].
In the proposed approach, an average filter is used that scales the grey level of the border regions to brighten the mammogram image. As a result, the details of the images will be enhanced and it will help to obtain better segmentation output. The main contribution of this paper is to investigate the effectiveness of the region growing segmentation technique with an average filter for the peripheral enhancement problem. The segmented region is provided as an input to the peripheral enhancement process to further enhances the breast region by using the filtered region growing segmentation method.
This paper is organized as follows. In Section 2, an overview of related work is provided. The peripheral enhancement method is explained in Section 3. Then, the experimental results are discussed in Section 4. Finally, the conclusion is presented in Section 5.
2. RELATED WORK
Segmentation is the method of breaking up a digital image into non-overlapping segments that separate the suspicious abnormal regions from its background. The segmentation process extracts a specific segment of an image, based on a set of pre-defined criteria [14, 15]. The process is applied to the digital mammogram to identify the homogeneous regions of an image. These similar regions are used to separate the brighter region (breast) from the darker region (background). The representation of an image can be changed with the help of segmentation technique to support easy image analysis. The well-known image segmentation techniques such as thresholding, clustering and region growing have been used to analyze and interpret medical images that have complex intensity distribution [16, 17]. Other common segmentation methods such as wavelet, mathematical morphology, Fuzzy c-means clustering, fractals and boundary-based methods are often used for mass and micro calcification segmentation.
3272 depending on its intensity values [14, 17]. The Otsu’s method, named after Nobuyuki Otsu, automatically performs clustering-based image thresholding. This method involves finding the measure of spread for the background and foreground pixels. The optimum threshold value is calculated to partition image pixels into a number of distinct classes so that their combined spread is minimized. In contrast, the region growing method uses the idea of starting with some seed pixels and then gathering similar pixels with the same properties to form a region. At each growth step, the rule checks the regions homogeneity and describes the growth mechanism. It starts from an initial seed pixel and the grown regions are appended to each point with similar neighbouring pixels. The clustering technique, on the other hand, is a process of grouping pixels that belong together based on image characteristics like texture, colour, size, etc. The K-means clustering technique partitions a collection of objects into K clusters [18]. Initially, the points are assigned randomly to the clusters. The Euclidean distance is used to measure the closeness of each pixel to the cluster that it belongs to and every pixel is assigned to the corresponding cluster. In the course of the iterations, the mean of each cluster is calculated and this process is repeated until no significant changes on the mean of each cluster.
The techniques that are based on global information are called global thresholding [19, 20]. Global thresholding is one of the familiar methods for image segmentation [21]. The information about surrounding tissues that is less bright than the abnormalities are used to discover the global threshold value. As such, the brighter abnormality regions can be separated from its background with the help of global threshold value. Better results can be obtained when global thresholding is used as preliminary step for other pre-processing techniques. The local thresholding is a locally defined threshold value based on intensity values for each pixel and its neighbour. Multiple pixels in the mass periphery and mass centre that belong to the same group are heterogeneous with dissimilar feature values. Patil et al. [22] reviewed both local thresholding and mathematical morphology implementation methodologies to segment the breast tumour from digital mammograms. The two algorithms, local thresholding and mathematical morphology, were successfully implemented in MATLAB 7.0. The algorithms were tested for approximately 50 digital mammogram images. It was observed that the results of mathematical morphology-based breast tumour segmentation
were better as compared to the local thresholding-based segmentation for almost all of the mammogram images. Furthermore, segmentation of the breast tumour from mammogram images by using mathematical morphology was much faster than that of local thresholding method. Hence, it can be concluded that mathematical morphology is a better segmentation algorithm for breast tumour demarcation as compared to the local thresholding. Authors in [23] and [21] converted the grayscale images into binary and carried out segmentation of regions by using multiple threshold levels.
In [24], the mammogram images are segmented by using local adaptive thresholding and the results are refined by using an adaptive clustering. Varela
et al. [25] and Zheng et al. [26] performed image enhancement with iris filter and used an adaptive threshold level for segmenting the suspicious regions. An adaptive grey-level thresholding was used followed by Markov random field model in [24] and [27] to perform abnormal region segmentation. Depending on the density of the tissues, [20] and [24] used an adaptive thresholding technique to partition mammogram images according to its different categories.
Region growing and region clustering are two segmentation techniques that depend on pixel classification. For the region growing segmentation [28, 29], the initial seed point is selected and similar pixels that have the same properties as seed pixel are grouped. Yuan et al. [30] made use of two different segmentation methods, the region-based and the radial gradient index (RGI), to initialize and to evolve the contours closer to the lesion boundary. The K-means clustering algorithm was used by [27] to group the pixels into clusters depending on its relative location and intensity values. Sahiner et al.
3273
al. [35] used the region growing method and dynamic programming for the segmentation of two different sets of breast mass counter. An adaptive topographic region growth algorithm was adopted by [26] for defining the initial boundary of the mass regions and an active contour algorithm for modifying the final boundary. A total of 90% of the lesions were segmented by using this approach. In the proposed research, an improved region growing technique with a filter is used and it is suitable for breast area segmentation [36].
In Computer Aided Detection systems, the peripheral enhancement is used as a pre-processing stage for the enhancement of peripheral visibility of the uncompressed region of the projected breasts. Byng et al. [37] proposed a nonparametric filter based method to display an enhanced mammogram. It is the first attempt to use filtering for obtaining a mammogram’s blurred vision that represents tissue thickness. Due to variations in the breast thickness and tissue density, a filtering method is used to acquire a blurred mammogram version. Then, the threshold that determines the grey values at the border of the breast is used to apply the thickness equalization in the breast periphery. The new threshold value is determined by taking the means of the small regions around the border point and it is evaluated with digitized screen-film mammograms. Rico et al. [38] used two different methods for computing the thickness map at the breast periphery to obtain enhanced accuracy in the volumetric breast density measurement. The first method is used to model the radiation profile based on breast phantom that simulates the image thickness changes and the other method to perform direct thickness calibration that uses a tissue with the use of thin-plate spline interpolation. In [39], the film and film digitizer characteristic curve were combined and corrected the pixel values for its non-linearity. Then, they measured the thickness as a distance function and adjusted these pixel values that reflect the distance from the skin line. A model-driven density equalization technique was proposed by Stefanoyiannis et al. [40] and they used thresholding for the segmentation of the breast region from the background. Then, the pixels density of the breast periphery was equalized with the mammary gland density by using wavelet-based fusion. They were able to equalize the density of mammographic images that improved the contrast at the breast periphery.
Recently, Al-Najdawi et al. [41] successfully investigated an optimal combination of various combination of various enhancement methods and
to segment breast region in order to obtain better visual interpretation. Alternatively, Ibrahim et al.
[42] proposed a method that enhances the contrast of mammogram images using the Band Limited Histogram Equalization (BLHE) method for easier detection of lesions or tumors. This algorithm segments the images using Otsu's N thresholding method to detect the region of interest in mammogram images. An approach called the Dual Stage Adaptive Thresholding (DuSAT) is proposed by Anitha et al. [43], which based on applying global thresholding on the Histogram Peak Analysis (HPA) of the entire image and the threshold is obtained by maximizing the proposed threshold selection criteria. A precise segmentation result is obtained by applying local thresholding is carried out for each pixel in a defined neighborhood window. Makandar et al. [44] proposed segmentation algorithm that detects clearly defined a region of mass using a morphological threshold based segmentation technique. Thus, the proposed method is compared with traditional Otsu thresholding method, to prove the effectiveness of segmentation results using the proposed method.
However, for all of the above methods, in order to compensate for possible acquisition limitations during mammograms, which cannot be solved by modifying the typical contrast parameters that viewers provide (window width and window centre) [45], a correction of the presence of an overexposed boundary area in the majority of mammograms is required to enhance the visualization of the digital mammograms.
3. PERIPHERAL ENHANCEMENT USING
SEGMENTATION WITH FILTER
In this paper, the peripheral enhancement technique used in [46] is improved with the use of filtered segmentation process and it is described in the following steps:
• First, the filtered segmentation technique that is using the region growing method is applied in order to separate the breast regions from the background. During the segmentation process, the value of ones and zeros are assigned to the breast regions and the background, respectively, to generate the segmented image, SI.
3274 order to set the pixels that are out of the breast, SI is multiplied by BI.
• After that, an enhanced multi-threshold segmentation method is used to obtain the normalized thickness profile, NTP, from the blurred image, BI. These multi threshold values Tn, are calculated based on Equation 1.
n avg
n
I
F
T
=
×
(1)where, Iavg is the average intensity of BI and Fn = 0.8, 0.9, 1.0, 1.1 and 1.2, respectively. The BI is rescaled for every threshold values Tn. As a result, the pixel value V is adjusted to
V
T
n if V ≤ Tn or 1, otherwise.• Finally, by averaging the multi threshold rescaled images, the NTP will be obtained. Furthermore, the peripheral equalisation (PE) is calculated by using Equation 2.
r
NTP
AI
PE
=
(2)where, AI is an average rescale image and
[image:5.612.90.302.172.676.2]r ranges from 0.7 to 1.0 [46]. The enhancement of the peripheral area of the breast image can be accomplished without changing the central area. The process of peripheral enhancing is illustrated in Figure 1.
Figure 1: The Stages of Peripheral Enhancement
4. RESULTS AND DISCUSSION
Experiments are conducted to evaluate the effectiveness of using the filtered region growing segmentation method for peripheral enhancement of mammogram images. A set of 600 images from DDSM dataset acquired from the University of South Florida [47] is used for evaluation. The dataset consists of 300 images of normal cases, 170 images of benign cases and 130 images of malignant cases. The quality of those images the peripheral enhancement process is evaluated by using visual illustrations (for subjective evaluation) and the peak signal-to-noise ratio (PSNR) measure (for objective evaluation) in which higher PNSR score indicates better quality of the peripheral enhancement technique. The results obtained based on the proposed filtered region growing segmentation method are compared with the Otsu method and the K-means segmentation methods.
4.1 Subjective Evaluation of the Peripheral
Enhancement
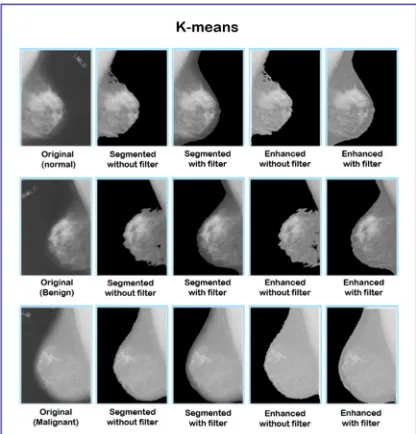
Figure 2, 3 and 4 shows the sample images of the mammogram in the peripheral enhancement process for the K-means segmentation method, the Otsu method and the region growing segmentation method, respectively. Each figure consists of the images for normal, benign and malignant cases.
Figure 2: Peripheral enhancement by using the K-means method
[image:5.612.313.521.426.643.2]3275 the breast images as compared to the segmentation method without the filter in all normal, benign and malignant cases.
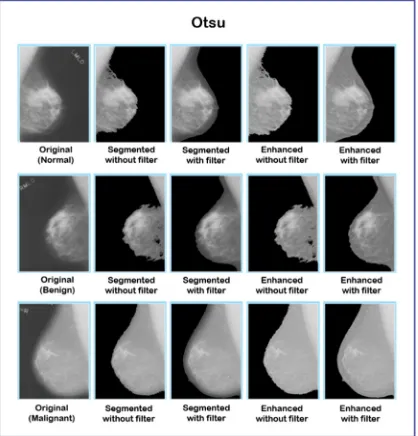
[image:6.612.91.299.396.616.2]Figure 3: Peripheral enhancement by using the Otsu method
Figure 4: Peripheral enhancement by using the region growing method
Similar observation can be seen for the Otsu method as shown in Figure 3. Based on the figure, the combination of filter to the Otsu method has enhanced the peripheral region of those images in all cases as compared to the method without the filter. Moreover, the combination of filter has the same effect on the region growing method as shown
in Figure 4 where then peripheral region of those images are enhanced. Therefore, it can be analyzed that through visual observation, the combination of filter with the segmentation methods has improved the peripheral region of the breast images.
4.2 Peak Signal Noise Ratio (PSNR)
In the previous section, a subjective comparison is performed through visual observation of the images. It shows that the use of filter for segmentation improves the visual for peripheral regions of the breasts. In order to compare the outcomes objectively, the PSNR measure is used in the evaluation. The peak signal-to-noise ratio (PSNR) is popularly used to measure the objective quality of an image after the pre-processing stage [39, 48]. The PSNR is derived from a logarithmic scale of Mean Squared Error (MSE) of the original and the enhanced image [48]. Higher PSNR values of the enhanced image show high closeness similarity to the original image, which indicates an improved quality. It is essential to attain a high PSNR value for the image after the enhancement stage [49]. The PSNR value is measured in decibels (dB’s) and is expressed as in Equation 3.
(
)
MSE
PSNR
n
dB
2
10
1
2
log
10
−
=
(3)where n is the number of bits per image sample and MSE is the mean squared error.
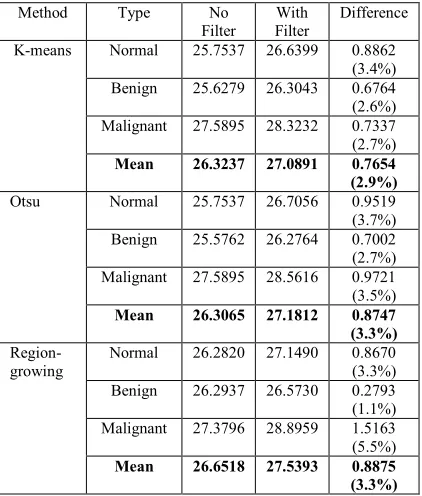
The PNSR values for different segmentation methods and peripheral enhancement are shown in Table 1 and 2, respectively. In Table 1, the PSNR results of the segmentation methods with and without filter for normal, benign and malignant cases are depicted. The mean value for those cases is calculated for each segmentation method. The mean difference is the difference between the mean for the segmentation method with and without filter.
3276 Table 1: PSNR values for three segmentation methods.
Method Type No
Filter
With Filter
Difference
K-means Normal 25.7537 26.6399 0.8862 (3.4%) Benign 25.6279 26.3043 0.6764 (2.6%) Malignant 27.5895 28.3232 0.7337 (2.7%)
Mean 26.3237 27.0891 0.7654
(2.9%) Otsu Normal 25.7537 26.7056 0.9519 (3.7%) Benign 25.5762 26.2764 0.7002 (2.7%) Malignant 27.5895 28.5616 0.9721 (3.5%)
Mean 26.3065 27.1812 0.8747
(3.3%)
Region-growing
Normal 26.2820 27.1490 0.8670 (3.3%) Benign 26.2937 26.5730 0.2793 (1.1%) Malignant 27.3796 28.8959 1.5163 (5.5%)
Mean 26.6518 27.5393 0.8875
[image:7.612.89.300.391.642.2](3.3%)
Table 2: PSNR values for three enhancement methods
Method Type No
Filter
With Filter
Difference
K-means Normal 25.7537 26.6540 0.8753 (3.4%) Benign 25.6103 26.3166 0.7063 (2.8%) Malignant 27.6286 28.3423 0.7137 (2.6%)
Mean 26.3392 27.1043 0.9390
(2.9%) Otsu Normal 25.7537 26.7177 0.9390 (3.6%) Benign 25.6103 26.2901 0.6798 (2.7%) Malignant 27.5895 28.5799 0.9667 (3.5%)
Mean 26.3341 27.1959 0.8618
(3.3%)
Region-growing
Normal 26.2998 27.1628 0.8630 (3.3%) Benign 26.3105 26.5852 0.2747 (1.0%) Malignant 27.3998 28.8968 1.497
(5.5%)
Mean 26.6701 27.5483 0.8782
(3.3%)
Table 2 shows the PSNR results of peripheral enhancement for the three cases of normal, benign and malignant. Similarly, based on the table, the PSNR results obtained by using an enhancement method with three filtered segmentation methods are better than using the unfiltered segmentation
methods. A similar pattern can be observed that the mean difference of the enhancement by using region growing method is comparatively higher than the other methods.
4.3 Visibility Using Gray Level Values
The peripheral area has a reduced gray level (low-contrast) that causes the difference from the other breast regions and brings more errors to the classification process. Manual adjustments in window settings are required to view the low contrast lesions. Using peripheral enhancement algorithms that effectively facilitate mammogram visibility in a clinical environment can minimize these manual adjustments. The enhancement process of the mammogram increases the gray level in the peripheral areas to compensate the reduced gray level values.
Table 3,4 and 5 shows the gray level results of peripheral enhancement for three cases of normal, benign and malignant by using region growing segmentation method in 64-grey level, 128 grey-level and 192-grey grey-levels, respectively.
Table 3: Gray level values for the original and enhanced image by using the region growing method (64 gray
level)
Type Original Image
Enhanced Image
Difference
Normal 0.1251 0.1340
0.0089 (7.1%)
Benign 0.0261 0.0383
0.0122 (46.7%)
Malignant 0.1302 0.1443
0.0141 (10.8%)
Mean 0.0938 0.1055
0.0117 (12.5%)
3277 Table 4: Gray level values for the original and enhanced
image by using the region growing method (128 gray level)
Type Original Image
Enhanced Image
Difference
Normal 0.5385 0.6377
0.0992 (18.4%)
Benign 0.3302 0.4057
0.0755 (22.9%)
Malignant 0.8066 0.9858
0.1792 (22.2%)
Mean 0.5585 0.6764
[image:8.612.93.297.282.400.2]0.1179 (21.1%)
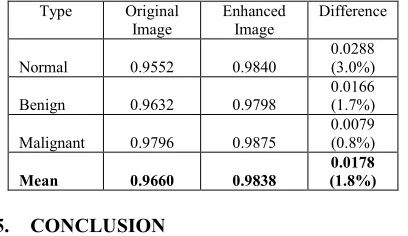
Table 5: Gray level values for the original and enhanced image by using the region growing method (192 gray
level)
Type Original Image
Enhanced Image
Difference
Normal 0.9552 0.9840
0.0288 (3.0%)
Benign 0.9632 0.9798
0.0166 (1.7%)
Malignant 0.9796 0.9875
0.0079 (0.8%)
Mean 0.9660 0.9838
0.0178 (1.8%)
5. CONCLUSION
Due to the presence of an overexposed boundary area in the majority of mammograms, a peripheral correction is required to enhance the visualization of digital mammograms in order to compensate for possible acquisition limitations. This peripheral correction that necessitates a better segmentation output was improved by using an average filter combined with the segmentation method. The paper evaluated the results by using subjective and objective methods and the performance is compared against the well-known segmentation techniques, the region growing, and the Otsu and K-means methods. Both the subjective and objective results showed that the region growing segmentation method with filter outperforms the other two segmentation methods and provide better input for the peripheral enhancement process. The peripheral enhancement using the filtered region growing segmentation method improves the image quality and provides better visualization for better assessment. Hence, the peripheral enhancement is shown to improve visualization and will play an important role in further development of CAD systems in mammography.
REFERENCES:
[1] Vainio, H., and Bianchini, F.: ‘IARC handbooks of cancer prevention’ (Iarc, 2002. 2002)
[2] Costantino, J.P., Gail, M.H., Pee, D., Anderson, S., Redmond, C.K., Benichou, J., and Wieand, H.S.: ‘Validation studies for models projecting the risk of invasive and total breast cancer incidence’, Journal of the National Cancer Institute, 1999, 91, (18), pp. 1541-1548
[3] Harvey, J.A., Fajardo, L.L., and Innis, C.A.: ‘Previous mammograms in patients with impalpable breast carcinoma: retrospective vs blinded interpretation. 1993 ARRS President's Award’, AJR. American journal of roentgenology, 1993, 161, (6), pp. 1167-1172
[4] Beam, C.A., Layde, P.M., and Sullivan, D.C.: ‘Variability in the interpretation of screening mammograms by US radiologists: findings from a national sample’, Archives of internal medicine, 1996, 156, (2), pp. 209-213
[5] Elmore, J.G., Wells, C.K., Lee, C.H., Howard, D.H., and Feinstein, A.R.: ‘Variability in radiologists' interpretations of mammograms’, New England Journal of Medicine, 1994, 331, (22), pp. 1493-1499 [6] Knutzen, A.M., and Gisvold, J.J.:
‘Likelihood of malignant disease for various categories of mammographically detected, nonpalpable breast lesions’, in Editor (Ed.)^(Eds.): ‘Book Likelihood of malignant disease for various categories of mammographically detected, nonpalpable breast lesions’ (Elsevier, 1993, edn.), pp. 454-460
[7] Jackson, V.P., Hendrick, R.E., Feig, S.A., and Kopans, D.B.: ‘Imaging of the radiographically dense breast’, Radiology, 1993, 188, (2), pp. 297-301
[8] Yusof, N.M., Isa, N.A.M., and Sakim, H.A.M.: ‘Computer-aided detection and diagnosis for microcalcifications in mammogram: a review’, International Journal of Computer Science and Network Security, 2007, 7, (6), pp. 202-208
3278 ‘Book Correlation-based feature selection for association rule mining in semantic annotation of mammographic medical images’ (Springer, 2014, edn.), pp. 482-493 [10] Philpotts, L.E.: ‘Can computer-aided
detection be detrimental to mammographic interpretation? 1’, Radiology, 2009, 253, (1), pp. 17-22
[11] Hogge, J.P., Palmer, C.H., Muller, C.C., Little, S.T., Smith, D.C., Fatouros, P.P., and de Paredes, E.S.: ‘Quality assurance in mammography: artifact analysis’, Radiographics, 1999, 19, (2), pp. 503-522 [12] Kallenberg, M., and Karssemeijer, N.:
‘Comparison of tilt correction methods in full field digital mammograms’, Digital Mammography, 2010, pp. 191-196
[13] Snoeren, P.R., and Karssemeijer, N.: ‘Thickness correction of mammographic images by means of a global parameter model of the compressed breast’, IEEE transactions on medical imaging, 2004, 23, (7), pp. 799-806
[14] Gopal, G., and Kanaga, E.G.M.: ‘A Study on Enhancement Techniques for Mammogram Images’, International Journal of Advanced Research in Electronics and Communication Engineering, 2013, 2, (1), pp. pp: 036-039 [15] Mohan, S., and Ravishankar, M.: ‘Optimized
histogram based contrast limited enhancement for mammogram images’, Short Paper, ACEEE International Journal on Information Technology, 2013, 3, (1) [16] Hassanien, A.E., and Ali, J.M.: ‘Feature
extraction and rule classification algorithm of digital mammography based on rough set theory’, in Editor (Ed.)^(Eds.): ‘Book Feature extraction and rule classification algorithm of digital mammography based on rough set theory’ (edn.), pp. 463-104
[17] Sankur, B., and Sezgin, M.: ‘Image thresholding techniques: A survey over categories’, Pattern Recognition, 2001, 34, (2), pp. 1573-1607
[18] Hartigan, J.A., and Wong, M.A.: ‘Algorithm AS 136: A k-means clustering algorithm’, Journal of the Royal Statistical Society. Series C (Applied Statistics), 1979, 28, (1), pp. 100-108
[19] Brzakovic, D., Luo, X., and Brzakovic, P.: ‘An approach to automated detection of tumors in mammograms’, IEEE Transactions on Medical Imaging, 1990, 9, (3), pp. 233-241
[20] Matsubara, T., Fujita, H., Kasai, S., Goto, M., Tani, Y., Hara, T., and Endo, T.: ‘Development of new schemes for detection and analysis of mammographic masses’, in Editor (Ed.)^(Eds.): ‘Book Development of new schemes for detection and analysis of mammographic masses’ (IEEE, 1997, edn.), pp. 63-66
[21] Dominguez, A.R., and Nandi, A.K.: ‘Enhanced multi-level thresholding segmentation and rank based region selection for detection of masses in mammograms’, in Editor (Ed.)^(Eds.): ‘Book Enhanced multi-level thresholding segmentation and rank based region selection for detection of masses in mammograms’ (IEEE, 2007, edn.), pp. I-449-I-452
[22] Patil, S., Udupi, V., and Bhogle, P.M.: ‘Implementation of Breast Tumor Demarcation in Digital Mammograms using Local Thresholding and Mathematical Morphology’, International Journal of Computer Applications, 2013, 66, (24) [23] Székely, N., Tóth, N., and Pataki, B.: ‘A
hybrid system for detecting masses in mammographic images’, IEEE Transactions on Instrumentation and Measurement, 2006, 55, (3), pp. 944-952
[24] Li, H.-D., Kallergi, M., Clarke, L.P., Jain, V.K., and Clark, R.A.: ‘Markov random field for tumor detection in digital mammography’, IEEE transactions on medical imaging, 1995, 14, (3), pp. 565-576 [25] Varela, C., Tahoces, P.G., Méndez, A.J.,
Souto, M., and Vidal, J.J.: ‘Computerized detection of breast masses in digitized mammograms’, Computers in Biology and Medicine, 2007, 37, (2), pp. 214-226
[26] Zheng, B., Mello-Thoms, C., Wang, X.-H., and Gur, D.: ‘Improvement of visual similarity of similar breast masses selected by computer-aided diagnosis schemes’, in Editor (Ed.)^(Eds.): ‘Book Improvement of visual similarity of similar breast masses selected by computer-aided diagnosis schemes’ (IEEE, 2007, edn.), pp. 516-519 [27] Pappas, T.N.: ‘An adaptive clustering
algorithm for image segmentation’, IEEE Transactions on signal processing, 1992, 40, (4), pp. 901-914
3279 algorithms’, Computerized medical imaging and graphics, 1992, 16, (5), pp. 323-331 [29] Bankman, I.N., Nizialek, T., Simon, I.,
Gatewood, O.B., Weinberg, I.N., and Brody, W.R.: ‘Segmentation algorithms for detecting microcalcifications in mammograms’, IEEE Transactions on Information Technology in Biomedicine, 1997, 1, (2), pp. 141-149
[30] Yuan, Y., Giger, M.L., Li, H., and Sennett, C.: ‘Correlative feature analysis of FFDM images’, in Editor (Ed.)^(Eds.): ‘Book Correlative feature analysis of FFDM images’ (International Society for Optics and Photonics, 2008, edn.), pp. 69151L-69151L-69156
[31] Sahiner, B., Hadjiiski, L.M., Chan, H.-P., Paramagul, C., Nees, A., Helvie, M., and Shi, J.: ‘Concordance of computer-extracted image features with BI-RADS descriptors for mammographic mass margin’, in Editor (Ed.)^(Eds.): ‘Book Concordance of computer-extracted image features with BI-RADS descriptors for mammographic mass margin’ (International Society for Optics and Photonics, 2008, edn.), pp. 69151N-69151N-69156
[32] Wirth, M.A., and Stapinski, A.: ‘Segmentation of the breast region in mammograms using active contours’, in Editor (Ed.)^(Eds.): ‘Book Segmentation of the breast region in mammograms using active contours’ (International Society for Optics and Photonics, 2003, edn.), pp. 1995-2006
[33] Docusse, T.A., Pereira, A.S., and Marranghello, N.: ‘Microcalcification border characterization’, IEEE Engineering in Medicine and Biology Magazine, 2009, 28, (5)
[34] Bassant, M., El-Horbaty, E.-S.M., and Salem, A.-B.M.: ‘A new intelligent telemedicine system based on service-oriented for cancer image classification’, in Editor (Ed.)^(Eds.): ‘Book A new intelligent telemedicine system based on service-oriented for cancer image classification’ (2013, edn.), pp. 1-11
[35] Domínguez, A.R., and Nandi, A.K.: ‘Toward breast cancer diagnosis based on automated segmentation of masses in mammograms’, Pattern Recognition, 2009, 42, (6), pp. 1138-1148
[36] Sampat, M.P., Markey, M.K., and Bovik, A.C.: ‘Computer-aided detection and
diagnosis in mammography’, Handbook of image and video processing, 2005, 2, (1), pp. 1195-1217
[37] Byng, J.W., Critten, J.P., and Yaffe, M.J.: ‘Thickness-equalization processing for mammographic images’, Radiology, 1997, 203, (2), pp. 564-568
[38] Rico, D., Yang, J., Augustine, B., Mawdsley, G., and Yaffe, M.: ‘Peripheral thickness correction for volumetric breast density estimation’: ‘Digital Mammography’ (Springer, 2003), pp. 187-191
[39] Wang, Z., Bovik, A.C., Sheikh, H.R., and Simoncelli, E.P.: ‘Image quality assessment: from error visibility to structural similarity’, IEEE transactions on image processing, 2004, 13, (4), pp. 600-612
[40] Stefanoyiannis, A., Costaridou, L., Sakellaropoulos, P., and Panayiotakis, G.: ‘A digital density equalization technique to improve visualization of breast periphery in mammography’, The British journal of radiology, 2000, 73, (868), pp. 410-420 [41] Al-Najdawi, N., Biltawi, M., and Tedmori,
S.: ‘Mammogram image visual
enhancement, mass segmentation and classification’, Applied Soft Computing, 2015, 35, pp. 175-185
[42] Ibrahim, N.S.A., Soliman, N.F., Abdallah, M., and El-Samie, F.E.A.: ‘An algorithm for pre-processing and segmentation of mammogram images’, in Editor (Ed.)^(Eds.): ‘Book An algorithm for pre-processing and segmentation of mammogram images’ (IEEE, 2016, edn.), pp. 187-190
[43] Anitha, J., Peter, J.D., and Pandian, S.I.A.: ‘A dual stage adaptive thresholding (DuSAT) for automatic mass detection in mammograms’, Computer methods and programs in biomedicine, 2017, 138, pp. 93-104
[44] Makandar, A., and Halalli, B.: ‘Threshold based segmentation technique for mass detection in mammography’, J Comput, 2016, 11, (6), pp. 472-478
[45] Stefanoyiannis, A.P., Costaridou, L., Skiadopoulos, S., and Panayiotakis, G.: ‘A digital equalisation technique improving visualisation of dense mammary gland and breast periphery in mammography’, European journal of radiology, 2003, 45, (2), pp. 139-149
3280 method and apparatus for digital mammography and breast tomosynthesis’, in Editor (Ed.)^(Eds.): ‘Book Multi-threshold peripheral equalization method and apparatus for digital mammography and breast tomosynthesis’ (Google Patents, 2010, edn.), pp.
[47] Heath, M., Bowyer, K., Kopans, D., Moore, R., and Kegelmeyer, W.P.: ‘The digital database for screening mammography’, in Editor (Ed.)^(Eds.): ‘Book The digital database for screening mammography’ (Medical Physics Publishing, 2000, edn.), pp. 212-218
[48] Schafer, R., and Sikora, T.: ‘Digital video coding standards and their role in video communications’, Proceedings of the IEEE, 1995, 83, (6), pp. 907-924