ISSN Online: 2379-1551 ISSN Print: 2379-1543
On a Standard Parametric Modeling Method of
Micro-Structure of Plain Woven Composite
Shanli Wang
Information Center, Tianjin Polytechnic University, Tianjin, China
Abstract
A new standard parametric modeling method of the micro-structure of plain woven composite is proposed. It is based on good analysis of the mechanical property of the yarn, weaving law of plain woven, and other factors. The me-thod implements a woven fabric composite visual engineering modeling pro- cess standardization, and it gives five steps to calculate the key micro-struc- tural parameters of the yarn including the cross-section and the trajectory of the central Line. On the basis, the digital model of a plain woven composite has been constructed. The experimental result shows that the forecast for the mechanical property of the model using finite-element simulation analysis is consistent with the actual value. The shape and the structure of the model are also consistent with the solid.
Keywords
Plain Woven Composite, Micro-Structure, Parametric Modeling, Standardization Process
1. Introduction
Plain woven composite material is an important branch of the development of composite material. The mechanical property of it in weft direction and warp direction are similar and the surface of it is of high strength and high rigidity. It is widely used in aeronautics, astronautics, car engineering, architecture, traffic and many other fields. Also, it is a kind of designable material in structure and mechanical property. To identify the inner structure before production and pre-dict the mechanical property are significant to improve efficiency. The modeling is the prerequisite of designing and prediction of mechanical property. The mi-cro-structure visualization is the basis of optimization of the structure and the How to cite this paper: Wang, S.L. (2016)
On a Standard Parametric Modeling Me-thod of Micro-Structure of Plain Woven Composite. Journal of Textile Science and Technology, 2, 56-66.
http://dx.doi.org/10.4236/jtst.2016.23008
Received: July 28, 2016 Accepted: August 27, 2016 Published: August 30, 2016
Copyright © 2016 by author and Scientific Research Publishing Inc. This work is licensed under the Creative Commons Attribution International License (CC BY 4.0).
micro-structure can be modified according to local performance requirement. A plain weave model is the basis of other fabric. Therefore, the model of a plain weave is important for the model of other 2D and 3D fabric. Many scholars have been carried out related valuable studies [1][2]. The micro-structural modeling of plain woven composite material is the key point for design and manufacture.
The modeling method of plain woven composite material can be divided into two categories. The first one pays more attention to visualization. According to the pattern, each yarn can be recognized by the model, but it can’t be used for mechanical property analysis. The second one pays more attention to mechani-cal analyzation, while it can’t be easily observed. Once the model needs amend-ing, it has to be reworked from beginning.
The proposed modeling method is based on specific modeling software, but few references give a standard modeling process. The modeling process is com-pletely dependent on experience and assumption of key parameters. The model-ing component cannot be reused and the modelmodel-ing process can’t be copied. Therefore, it is difficult to design fast and flexible. The algorithm can’t prevent the loss of the detail, but to repair any detail is very difficult. Because of the plain fabric performance prediction research is at the initial stage; determine the key parameter of it is difficulty. It has not formed the standardized modeling process and operation method. There are few reference documentation on the modeling method of the plain woven composite material, but found no woven composite standard modeling method is introduced [3].
In this paper, a standard parametric modeling method of micro-structure of plain woven composite is proposed. It can realize visual engineering modeling, and the standard of modeling process. The new model can not only be used for mechanical analyzation, but also for the visualization of a plain woven compo-site material surface design. Then fast design and knowledge sharing of model-ing can be realized.
2. Methodology
2.1. Summary
cross-section are decided by many factors. So, the identifications of the two pa-rameters are discussed in the following section.
In this paper, some key factors such as characteristic of the component ma-terial of the yarn, the spatial structure of the interlaced yarn, the axis curve of the yarn, the cross-section shape of the yarn and the loom tension are given due at-tention. The calculation method of the micro-structural parameter is proposed in this paper. The method can be described by the following five-steps: 1) Set the primary shape of the central line trajectory of the yarn. 2) Deform the cross-sec- tion. 3) Set the common tangent of the adjacent inter-weave yarn. 4) Surround and deform. 5) Fit and fix the shape. The detail of the method will be described as follows.
Assume the yarn of the plain woven fabric reinforcement is twist-less glass fi-ber, the fiber fineness of warp is expressed as Nj, the fineness of weft is expressed as Nw, the loom tension is expressed as F, the warp density of reinforcement is expressed as Dj, the weft density of reinforcement is expressed as Dw, the vertical Poisson ratio is expressed as ν, and the vertical elastic modulus is expressed as E. The original cross-section of glass fiber yarn is circular. The original radius of yarn can be computed out when the cross-section area is known. The cross-sec- tion radius of warp and weft are denoted as Rj and Rw respectively. Because of the change of the warp trajectory is obvious, the trajectory of the warp in a re-peat unit is discussed in details.
2.2. Procedures of the Method
1) Identify original form of the central line of yarn
The reinforcement of a plain woven composite is usually glass fiber or carbon fiber. In this paper, glass fiber is taken for example. Glass fiber is fixed together into yarn using tow collecting technology. So, the appearance of the yarn is slender long cylindrical, and the original cross-section of the yarn can be as-sumed to be circle. The radius of original cross-section is expressed as R, and it satisfies Equation (1):
2
1000
π σρ
R =T (1) where T is the mass of 1000 meters long yarn, ρ is the mass density of glass fiber,σ is the volume fraction of fiber. That is, R can be expressed as Equation (2)
1000 T R
πρσ
= (2)
arc. The transitional part trajectory is the combination of arc and segment. Primarily, the yarn is interlaced into arc. In the rectangular coordinate system
XOY, the centers of the three adjacent wefts cross-section are O1, O2 and O3 re-spectively. Draw three circles with a same radius of Rj+Rw and with their
center points O1, O2 and O3 named O1, O2 and O3 respectively. Dw is the distance between O1 and O2 or O2 and O3. If Dw<Rj+Rw,
1 O
and O2 or O2 and O3 are intersect with each other, as shown in Figure 1. The trajectory of the warp central line is the curve which is smooth joined by line segment and arc, as shown in Figure 2. If Dw =Rj+Rw, the
rela-tive situation of the central line trajectory and the weft is described as shown in Figure 3. The warp central line trajectory is shown in Figure 4. If Dw>Rj+Rw,
the warp central line trajectory is shown in Figure 5 and Figure 6. 2) Deformation of the yarn cross-section
The cross-section shape of the yarn will be changed on the effect of the loom
Figure 1. Dw<Rj+Rw yarn relative position.
Figure 2. Dw<Rj+Rw the trajectory of warp central line.
Figure 3. Dw=Rj+Rw yarn relative position.
Figure 4. Dw=Rj+Rw the trajectory of warp central line.
F
E D C
B
A intersection
O3 O2
O1
O1 O2 O3
F E
D C
B A
intersection
D C
B A
O1 O2 O3
contact
D C
B A
O1 O2 O3
tension. The deformation is obvious on the interlacing section and it will decide the shape of the transitional part trajectory. Therefore, it is important to analyze the yarn shape and cross-section of interlacing section part. The geometrical property is decided by stress situation which is effected by the micro-structure, the loom tension and the interlacing type. They decide the deformation of inter-lacing yarn.
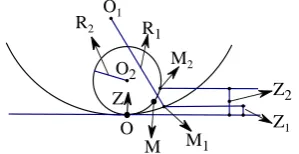
In the elastic range, most materials obey Hooke’s law in the elastic range ac-cording to the reference [4]. In the range of small deformation, the simulation of the interlacing yarn can be regarded as the contacting problem of two elastic solid in material mechanics. If the warp and the weft yarn are in close contact with each other and the stress is P, as shown in Figure 7.
M1 is a point on the warp and M2 is a point on the weft yarn, M is the middle point in segment M1M2, r is the distance between M1 and M. M1 and M2 will be moved ω1 and ω2 away in Z-axis direction respectively. α is the distance between M1 and M2. z1 is the distance between a point which is very near to the contact point on the warp and the contact point. z2 is the distance between a point which is very near to the contact point on the weft yarn and the contact point. R1 is the radius of contact circle that is formed by the warp encircles the weft. R2 is the ra-dius of the weft cross-section. So, the Distance between M1 and M2 is shortening as
α
−(
ω ω
2− 1)
. After local deformation, point M1 and point M2 superpose each other to point M. q0 is the force exerted on contact surface. ar is the radius of contact surface. There is Equation (3),Figure 5. Dw>Rj+Rw yarn relative position.
[image:5.595.299.449.612.689.2]Figure 6. Dw>Rj+Rw the trajectory of warp central line.
Figure 7. Yarn deformation by force. F
E D C
B A
O1 O2 O3
separation
F
E D C
B A
O1 O2 O3
separation
Z1 Z2
R2 R1
Z
M1 M2
(
)
(
)
(
)
2 1 2
2 1 1 2
1 2 0 2 2 0 1 2 2
0 1 2
1 2 1 2 2 3 2 2 4 2 r r r R R
Z Z r
R R
q F
a
q a
k k
q R R
k k
a R R
ω ω α α
π π α π − − = − − = − = + = − + = (3)
The distance of successive approximations between the warp and the weft is expressed as Equation (4):
(
) (
2)
12 2 3
1 2 1 2
1 2 9
16
F k k R R
R R π
α = + +
(4)
where, 12 22
1 2 1 2 1 1 , k k E E υ υ π π − −
= = , υ υ1, 2 is the vertical Poisson ratio of the warp and the weft yarn respectively. E is the vertical Young’s modulus. R1 is the sum of the warp original radius and the weft original radius. That is, R1=Rj+Rw, R2
is the weft original radius.
A yarn is composed of hundreds of glass fiber. The cross-section is similar with a circle. In the process of interweaving, the circle cross-section is stressed by F, and the inner fiber will float to two sides. Finally, the cross-section shape is changed into oval. The depressed distance of warp or weft is acquired according to Equation (4).
The cross-section area is invariant after the yarn is deformed [5]. Take weft yarn for example, the cross-section area is S. The long axis of the cross-section is
a and the short axis is b. The aligned distance between two interlacing yarns can be calculated out using Equation (5). If the weft and warp are of the same ma-terial, plain fabric reinforcement is stressed by equal and opposite in direction force. The radius of warp or weft is decreased to half of α. So, there is Equation (5). 2 2 w w S R s ab b R π π α = = = − (5)
Then, a and b can be expressed as Equation (6)
2 2 2 , 2 2 w w w R R a b R α α − −
= = (6)
3) Determine the common tangent
semi-major axis, which is denoted as bt. Draw two identical ellipses named in-terlacing part trajectory control ellipses whose semi-minor axis are at and semi-major axis are bt. The distance between the two ellipses is Dw. Under the force of the loom tension, the central line of warp approaches the inner common tangent of the adjacent trajectory control ellipse of the interlacing yarn. The ner common tangent is called as interlacing common tangent. Next, critical in-fluence factors are further discussed.
In the planar rectangular coordinate system the two ellipses are expressed as Equation (7) and Equation (8) respectively. The slope of the two ellipses com-mon tangent is denoted as λ. The equation of the tangent is denoted as Equation (9). Where, c is an unknown parameter. Substitute the tangent equation into the two ellipse equations respectively, according to the equation of tangent property, the equation has repeat roots. So, the outer common tangents are meaningless. The slope of the inner common tangents is described as Equation (10)
2 2
2 2 1
t t
x y
a +b = (7)
2 2
2 2
( )
1 w
t t
x D y
a b
−
+ = (8)
y=
λ
x c+ (9)(
)
2 2 2 2 2 2
2 2
2 4
4
mn a n b m a b
a m
λ
=− ± + −− (10)
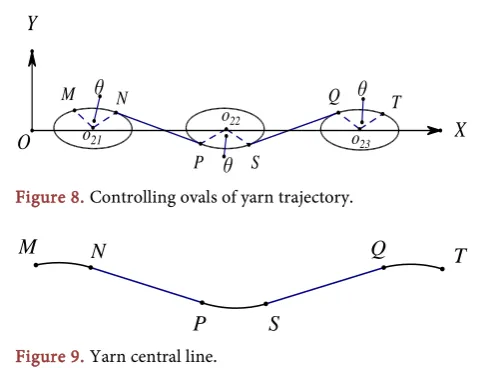
4) Determine the wrap around angle
The trajectory of interlacing section is the two segment arc on the adjacent trajectory control ellipse, which corresponds with the wrap around angle be-tween two inner common tangents. The around angle can be figured out ac-cording to the ellipse arc. On the basis of the symmetry of woven fabric, any gradient of the two warp cross-section common tangents can be written as Equ-ation (9), substitute λ for λ1, λ2 respectively. The wrap around angle θ can be computed out according to Equation (11):
1 2
1 2 arctan
1
λ λ θ
λ λ
−
=
+
(11)
5) Central line trajectory of the yarn
Fig-ure 9.
The central line trajectory of plain yarn is acquired. The yarn model can be constructed by the cross-section sweeps along the central line trajectory. Ac-cording to enhancement structure, assemble the weft and warp, the enhance-ment model is set up. A visual model of a plain woven composite can be set up while the enhancement solid model is immersed in the matrix resin.
3. Experiments and Conclusion
3.1. Fabric Modeling and the Mechanical Property Prediction
In this part, a plain woven composite will be made, and its specific parameters are as follows. Warp and weft are made in 60 tex alkali free glass fiber. The warp density is 98 per 100 mm and the weft density is 70 per 100 mm. The yarn is stressed by 40 g (That is 0.0392 N.) loom tension in weaving process. The me-chanical properties of the plain woven fabric are shown in Table 1. Experiments were done to test the mechanical property of the plain woven composite. The tensile modulus of the plain woven composites in warp direction is 7.74 GPa. Tensile modulus of the plain woven composites in weft direction is 6.21 GPa.
According to the above data, the visualization of enhancement model is shown as Figure 10.
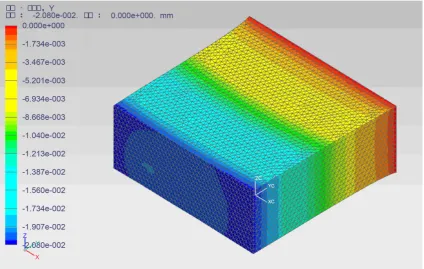
The cycle unit size is 1.9 mm × 1.6 mm × 0.7 mm. Import the model into the fi-nite element analysis software. The searching distance between two adjacent curves is 0.01 mm. A force of 100 N is added in the warp direction (Y-axis). Its defor-mation is shown in Figure 11. In accordance with the displayed displacement
[image:8.595.252.503.426.610.2]Figure 8. Controlling ovals of yarn trajectory.
[image:8.595.210.539.642.706.2]Figure 9. Yarn central line.
Table 1. The mechanical property of plain woven fabric.
glass fiber resin tensile modulus (MPa) 2.77 × 10⁴ 3.01 × 10³
cutting modulus (MPa) 1.065 × 10⁴ 1.10 × 10³
Poisson ratio 0.3 0.36
T Q
S P N
M
o23
o22
o21
O
Y
X
θ
θ
θ
T
Q
S
P
Figure 10. Visualization of enhancement mode 1.
Figure 11. Visualization of loading when 100 N tensile load is used in y-axis.
2.080e-002, and tensile modulus in warp direction can be computed using Equa-tion (12).
(
)
2
100 2
8.16 GPa
1.6 0.7 2.08 10
F l E
A l −
= × = × ≈
∆ × × (12)
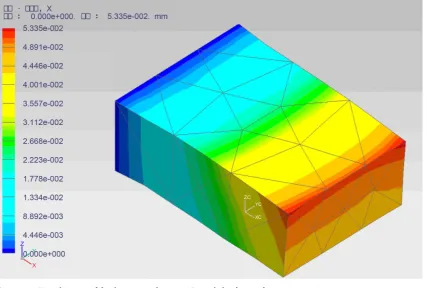
Figure 12. Visualization of displacement when 300 N tensile load is used in x-axis.
(
)
2
300 1.6
6.77 GPa
1.9 0.7 5335 10
F l E
A l −
= × = × ≈
∆ × × (13)
3.2. Conclusion
In the experiment, the lateral tensile modulus of elasticity is 7.74 GPa; the trans-verse tensile modulus of elasticity is 6.21 GPa. By the model analysis, the lateral tensile modulus of elasticity is 8.16 GPa. The transverse tensile modulus of elas-ticity is 6.77 GPa. It is identical to compare the answer by the model analysis with the data of the experiment. The deviation of lateral tensile modulus is 5.43%. The deviation of transverse tensile modulus is 8.94%. The prediction re-sult is little larger than the experimental rere-sult. The major reason is the two ad-jacent units are considered. Therefore, the result is accepted. The visualization is consistent with observation. The result is consistent with the reference [6].
References
[1] Guo, Q.W. and Wu, X.Q. (2008) Compressibility of Plain-Woven Fabrics in Com-posite. Journal of Textile Research, 29, 42-45.
[2] Li, J.J. and Zhao, M.Y. (2015) Mechanical Analysis of Plain Woven Composite Ma-terials. Mechanical Science and Technology for Aerospace Engineering, 34, 1294- 1297.
[3] Zhang, X.J., Zheng, T.Y. and Chen, Z.H. (2013) Research on Flattening of Yarn’s Cross-Sections in Low and Medium Desity Plain Woven Fabrics. Journal of Textile Research, 34, 50-54.
[4] Yang, L.H., Chen, L. and Wang, S.L. (2012) Geometric Modeling of 3D Woven Composite with Warp and Fill Mutual Imitation. Acta Materiae Composite Sinica, 29, 208-213.
[5] Yang, L.H. and Li, J. (2008) Study on Tow Cross-Section Deformation in Three- Demensional Woven Composites. Acta Materiae Composite Sinica, 25, 198-204. [6] Zuo, Z.E, Wang, R. and Xu, L. (2009) Mechanical Strength Prediction of Plain
Wo-ven Fabric Composite: 1. Finite Element Model of Composite RVE. Journal of Tex-tile Research, 30, 45-49.
Submit or recommend next manuscript to SCIRP and we will provide best service for you:
Accepting pre-submission inquiries through Email, Facebook, LinkedIn, Twitter, etc. A wide selection of journals (inclusive of 9 subjects, more than 200 journals)
Providing 24-hour high-quality service User-friendly online submission system Fair and swift peer-review system
Efficient typesetting and proofreading procedure
Display of the result of downloads and visits, as well as the number of cited articles Maximum dissemination of your research work