© 2018, IRJET | Impact Factor value: 7.211 | ISO 9001:2008 Certified Journal | Page 3151
EFFICIENT CROP YIELD PREDICTION USING MACHINE LEARNING
ALGORITHMS
Arun Kumar
1, Naveen Kumar
2, Vishal Vats
31M. Tech Student, JPIET, Meerut, Uttar Pradesh 2Assistant Professor, JPIET, Meerut, Uttar Pradesh 3Big Data Analytics, Delbris Technology, Chandigarh, Punjab
---***---
Abstract: Descriptive analytics is the initial state of analytics. It is a process in which we can know what happened in the past. And we know that past is the best predictor of the future. In this research paper we apply descriptive analytics in the agriculture production domain for sugarcane crop to find efficient crop yield estimation. In this paper we have three datasets like as Soil dataset, Rainfall dataset, and Yield dataset. And we make a combined dataset and on this combined dataset we apply several supervised techniques to find the actual estimated cost and the accuracy of several techniques. In this paper three supervised techniques are used like as K-Nearest Neighbor, Support Vector Machine, and Least Squared Support Vector Machine. It is a comparative study which tells the accuracy of training proposed model and error rate. The accuracy of training model should be higher and error rate should be minimum. And the proposed model is able to give the actual cost of estimated crop yield and it is label like as LOW, MID, and HIGH.
Keywords- Crop Yield Estimation, Support Vectors, Least Squared Support Vector machine, Data Analytics, Agriculture analytics.
Introduction
Agriculture is one of the important industrial sectors in India and the country’s economy is highly dependent on it for rural sustainability. Due to some factors like climate changes, unpredicted rainfall, decrease of water level, use of pesticides excessively etc. The level of agriculture in India is decreased. To know the level of production we performed descriptive analytics on the agriculture data. The main objective of this research work is to provide a methodology so that it can perform descriptive analytics on crop yield production in an effective manner. Although, some studies revealed statistical information about the agriculture in India, few studies have investigated crop prediction based on the historic climatic and production data. ANNs accept been acclimated for assorted purposes including classification, clustering, agent quantization, arrangement association, action approximation, forecasting, ascendancy applications and optimization. Using ANN predictions accept been acclimated for banking industry and altitude prediction. In this work an ANN is used to predict crop yields based on the data provided from the Telangana State in India. During review of the several research papers. We found that there are several models exist like as- Principal component regression, Partial least squares, Adaptive forecasts, ARIMA model etc. But the similarity between these models that either they are based on regression or classification. Now we are developing a system which is supervised based model. And it will work as mixed approach it means classification technique as well as regression technique.
© 2018, IRJET | Impact Factor value: 7.211 | ISO 9001:2008 Certified Journal | Page 3152
Related Work
J. Ramirez-Villegas and A. Challinor 2012 [1]Environmental change is relied upon to generously diminish rural yields, as revealed in the by the Intergovernmental Panel on Climate Change (IPCC). In Sub-Saharan Africa and (to a lesser degree) in South Asia, restricted information accessibility and
institutional systems administration compel horticultural innovative work. Here they played out a survey of applicable perspectives in connection to coupling agriculture–climate expectations, and a three-stage examination of the significance of atmosphere information for agrarian effect appraisal. To start with, utilizing meta-information from the logical writing they analyzed patterns in the utilization of atmosphere and climate information in agrarian research, and they found that notwithstanding farming specialists' inclination for field-scale climate information (50.4% of cases in the collected writing), vast scale datasets combined with climate generators can be helpful in the rural setting. Utilizing surely understood introduction procedures, they then evaluated the sensitivities of the climate station system to the absence of information and discovered high sensitivities to information misfortune just over bumpy regions in Nepal and Ethiopia (arbitrary evacuation of information affected precipitation assesses by ±1300 mm/year and temperature gauges by ±3 °C). At last, they numerically looked at IPCC Fourth Assessment Report (4AR) atmosphere models' portrayal of mean atmospheres and inter annual inconstancy with various observational datasets. Atmosphere models were discovered insufficient for field-scale farming reviews in West Africa and South Asia, as their capacity to speak to mean atmospheres and atmosphere changeability was restricted: over half of the nation display blends demonstrated <50% modification for yearly mean precipitation (mean atmospheres), and there were huge precipitation predispositions in GCM yields (1000–2500 mm/year), in spite of the fact that this shifted on a GCM premise (atmosphere fluctuation).
C. O. Stockle.,1994 [2] In agribusiness, water andnitrogen are two basic assets for growing a harvest. Be that as it may, their administration can't be broke down autonomously of climate, soil qualities, field hydrology, trim attributes, edit turn, and administration elements. This paper portrays the water, nitrogen, and harvest development segments of CropSyst, a complete editing frameworks reenactment demonstrate, and gives preparatory confirmation of these segments. The water spending plan of the model appropriately portrays edit water utilize. Anticipated nitrogen substance all through the dirt profile did not precisely coordinate the deliberate qualities from filtering tests, yet they followed the general patterns of the information. The assertion amongst recreated and watched biomass and yield of corn, winter wheat and spring wheat developed in two areas with a sum of 77 information focuses was great as appeared by a few factual pointers.
X. K. Chen and C.H. Yang 2002 [3] this paper talks about the normal for horticultural complex mammoth framework and advances Systematic Integrated Prediction Method of national grain yield expectation, the key strategy of which is info inhabitance yield procedure of complex framework, non-direct forecast technique and least entirety of total esteem method.
J. Dean and S. Ghemawat 1989 [4] MapReduce is aprogramming model and a related execution for preparing and producing vast datasets that is managable to an expansive assortment of genuine undertakings. Clients determine the calculation as far as a guide and a diminish work, and the hidden runtime framework consequently parallelizes the calculation crosswise over substantial scale groups of machines, handles machine disappointments, and timetables between machine correspondence to make effective utilization of the system and plates. Software engineers discover the framework simple to utilize: more than ten thousand particular MapReduce programs have been actualized inside at Google over the past their years, and a normal of one hundred thousand MapReduce employments are executed on Google's groups each day, handling an aggregate of more than twenty petabytes of information for each day.
Durbin 2004 [5] the paper displays a wide broadsurvey of the state space way to deal with time arrangement examination. It starts with a prologue to the direct Gaussian state space show. Applications to
© 2018, IRJET | Impact Factor value: 7.211 | ISO 9001:2008 Certified Journal | Page 3153
Wu X, Kumar V, Quilan JR, Ghosh J, Yang 2008
[6] This paper shows the main major mining calculations distinguished by the IEEE International Conference on Data Mining (ICDM) in December 2006: C4.5, k-Means, SVM, Apriori, EM, PageRank, AdaBoost, kNN, Naive Bayes, and CART. These main 10 calculations are among the most persuasive information mining calculations in the examination group. With every calculation, they give a depiction of the calculation, examine the effect of the calculation, and audit ebb and flow and further research on the calculation. These 10 calculations cover order, grouping, factual learning, affiliation examination, and connection mining, which are all among the most imperative subjects in information mining innovative work.
Abdullah, A 2004 [7] Initial move towards seeing any agrarian framework is the cognizance of connections between the framework and various physical, concoction and organic elements impacting it. Any choice with respect to such frameworks requires expository investigation of the included information. The investigation undertaking is to be upheld by a productive information stockpiling and recovery instrument. In this paper they have displayed the instance of an Agri information stockroom for this reason. We have quickly talked about the procedure they received for setting up the information stockroom incorporating vermin, pesticide and metrological information.
Abdullah, A., Brobst, S, Pervaiz.I., Umer M 2004
[8]Late reviews by horticulture scientists in Pakistan have demonstrated that endeavors of product yield boost through genius pesticide state arrangements have prompted a perilously high pesticide utilization. These reviews have announced a negative connection between pesticide use and product yield in Pakistan. Subsequently exorbitant utilize (or mishandle) of pesticides is hurting the agriculturists with antagonistic budgetary, natural and social effects. In this work they have demonstrated that how information mining incorporated rural information including bug exploring, pesticide utilization and meteorological recordings is valuable for enhancement (and diminishment) of pesticide use. The information utilized as a part of this work has never been used in this way ever some time recently.
Factors Affecting the Crop Production
There are several factors which affect the production of agriculture very highly.
1. Variation of Crop Yield with Rainfall
The rainfall is a major factor of agriculture production. Dissimilarity of rainfall can affect the crop production. If it is highly rainfall, then it can lead the low production. The rainfall should be moderate. The ideal rainfall is between 300mm-600mm it may lead the highly production or average production.
2. Variation of Humidity Factor
The metrological parameters play an important role in agriculture production. The humidity is one of the most important factor of metrological parameter. Humidity conditions helps into the growth of any crop.
3. Impact of Climate Change on Agriculture Climate is an important aspect of agriculture. Changes in climate drastically affect the agriculture system. Precipitation plays an important role in agriculture. Due to change in climate the rainfall patterns has been changed. Due to this causes most of the crops which needs water. These crops are taking more cost as compare to earliest time. Because lack of rainfall increases the usage of tube well etc. so the irrigation process has become costly.
Impact of Climate Change in Global Context
Effect of elevation change can be ordered through outright and revoking viewpoints. Less cold winters and greenery in top altitudinal territories can be exhorted as some total effects because of all-around temperature rise. Be that as it may, the antagonistic (negative) effects are clear genuine top in contrasted with the supreme effects. A portion of the unfavorable effects procured by elevation change unusually going with to sanctify through water taking all things together around and Asian vibe can be arranged as takes after. And some causes are listed below:
Due to global warming nature has been affected.
Pollution and excessive use of digital things like air-condition, fridges etc.
© 2018, IRJET | Impact Factor value: 7.211 | ISO 9001:2008 Certified Journal | Page 3154
Pollution into the lakes and this is the main causes of sea pollution.
Blindly usage of fuel at the world wide level.
The glaciers are melted at very high rate. And this is the main cause the sea level increased.
1. Principal component regression
Principal component regression is a two steps method. Firstly, in PCR method stores the variables and reduce the dimensionality of the data and again stores in the structure of table. It extracts the most variation of data and perform feature selection so that dimensionality could be reduced. And find the first factor in the direction maximize the dispersion of the observation, and other factor should be also maximizing in the dispersion of diagonal of the first factor. And then we can rotate the factor perpendicular and for more dimensional data we can continue in a combined approach. The result of PCR is the representation of the variation of the sample of less dimensional data. Secondly we try to fit a linear regression between the samples on the factors which are mostly correlated with factors. PCR solves the multidimensional space problem and collinearity problem in an efficient manner.
2. PARTIAL LEAST SQUARE
PLS is an economic or statistic based approach which have relation to principal component regression. And it is a component based approach rather than covariance based. The working model of PLS try to find the minimum variance between response and independent features. And then it finds the linear regression by the projection of predictor and observer variables to the new space or plane. It uses the discriminant analysis when the response or dependent variable is nominal. In this approach two matrices are used one for X’s and other for Y’s. It tries to find the multi-dimensional direction in the predictor’s space that elaborate the maximum multi-dimensional variance in the response space. It is well suited when matrices of predictors have more variables than the observation and multi-collinearity. Whereas the classic regression failed to solve it.
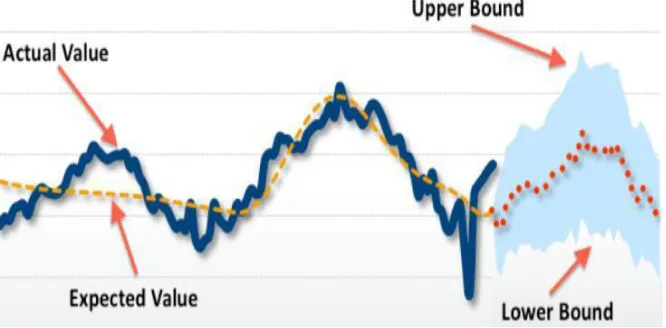
3. ARIMA model
[image:4.612.123.456.489.653.2]ARIMA model is stands for autoregressive integrated moving average. Basically it is the combination of autoregressive and moving average models. An autoregressive model, in which response variabledepends on its previous values. Whereas the moving average is the error rate includes of its values. ARIMA model is best suited for non-stationarity i.e. the series has trends and these are not equal means variance is different. To find the solution of non-stationarity problems we try to find the lower and upper bound by the differentiation of equation of interval values. It try to convert non-stationarity to stationarity by numeric analysis of differentiation method.
© 2018, IRJET | Impact Factor value: 7.211 | ISO 9001:2008 Certified Journal | Page 3155
Problem Formulation
The production of agriculture is affected by several climate factors. Like as metrological parameters (Humidity, wind speed, temperature, and moisture), precipitation parameters (rainfall, region wise rainfall, irrigation etc.), and soil parameters (PH, organic carbon, phosphorus, fiber etc.). And due to continuously change in climate condition everything is messed.
In India farmers still follow the traditional technology which they adopted from their ancestor. But the problem is that in earliest time climate was very healthy everything was happened on time. But now most of the things have been changed due to global warming and many other factors. The main problem with agriculture in India is lack of rainfall in seasonal time. Humidity is also necessary for crops but it has been excessive, it also converts as drawback. Winter season is been affected so Rabi crops are widely affected. Since few years the rainfall in winter season was high as expected.
To overcome these above issues we need to develop a system which will able to find the hidden facts or results, patterns and insights. The farmer can predict which crop should sow so that he/she can get more benefit. In proposed system we are applying data analytics techniques on agriculture production baseddatasets and find the insights so that it can help to the farmers and their decision making.
In this research work, we are proposed a system which is based on descriptive analytics. By which farmers can know what happened in past time and what is going to happen. So here we collect several data from agriculture production, rainfall and soil data and prepare their respective datasets.
In this approach we are using supervised learning to train the model and it will give the estimated cost of crop yield production and respective production class.
Support Vector Machines
SVM is a machine learning (Supervised learning) technique. Which is nonlinear in nature, and it is used for classification as well as regression problem. There are other nonlinear techniques like artificial neural network, CART etc. Linear classification is somehow easy to implement as compare to nonlinear classification. Because in linear technique we can find decision boundary and support vectors easily. Whereas in nonlinear technique hard to find the straight line of decision boundary and support vectors. So to handle this issue we use the hyperplane.
LS-SVM based Crop Yield Estimation
Linear square support vector machine is the extension of support vector machine. The extra functionality is given in LS-SVM as compare to Support vector machine. This technique is used to solve classification as well as regression problems. When the dataset is complex and large then we usually go for linear version of support vector machine as compare to Support vector machine.
Basically the reason is that suppose we are solving a problem of classification or regression by using support vector machine and dataset is complex and as well as large then the implementation logic of svm will solve the problem or classify the data points in quadratic time. Whereas in Linear square support vector machine solve the problem in linear time. Because svm works with each and every data points whereas lssvm works in range or intervals.
Model training complexity of support vector machine in O (n3), whereas the training time of data points in least square support vector machine is the number of intervals or ranges i.e. O(n). This is the reason why are we using less in our proposed approach.
© 2018, IRJET | Impact Factor value: 7.211 | ISO 9001:2008 Certified Journal | Page 3156
[image:6.612.101.510.563.672.2](Sugarcane specific) and Rainfall data. humidity, potassium, sodium, phosphorous abundance appropriate for sugarcane crop, minimum and best temperature for crop, RH ethics morning and evening), Clay parameter(depth of soil, PH, comestible agreeable acclimated for crop see table below), acclimate forecast, date of sawing, diseases attacked & pesticides/fertilizers acclimated for sugarcane crop, crop in tones/acres,
Table 1: Soil Characteristics for Yield Prediction
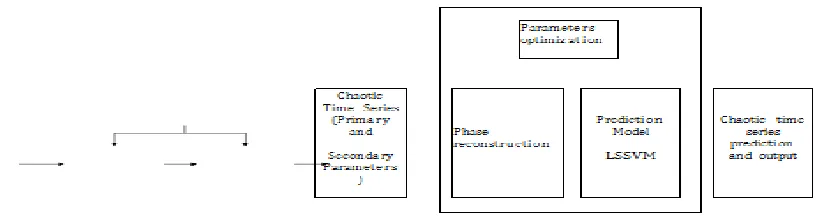
Anticipation Model: This Step will focus on Creation of crop crop anticipation model; the anticipation will accomplish a corruption archetypal to anticipation a crop of the crop in the abreast approaching based on assorted parameters. This clay action consists of assorted stages starting with the adding of altered statistical features. These affected appearances will not be specific to the acreage of crop anticipation but an advanced array of altered measures that advice acknowledge the dynamics of the arrangement by anticipation new advice from the abstinent values. At this point the ambition is to ascertain as abounding affected appearance as accessible to accommodate abundant advice for the next stages of the method.
1. LSSVM Crop Prediction Model
With the contempo development in anarchy theory, abundant nonlinear systems accept been articular to be anarchic admitting their accidental behaviors, in which the bounded archetypal is an important adjustment for anarchic time series; the adjustment projected anarchic time alternation into a multidimensional appearance space, which is again disconnected into several subspaces area the mapping action is approximated by agency of bounded approximation. Anarchic time alternation anticipation based on nonlinear systems shows in accepted above achievement over the adequate statistical applicative methods.
© 2018, IRJET | Impact Factor value: 7.211 | ISO 9001:2008 Certified Journal | Page 3157
As addition another in ambidextrous with nonlinear systems, abutment agent apparatus (SVM) was proposed in based on the attempt of the statistical VC (Vapnik Chervonenkis) dimensional approach and structural accident minimization. SVM can bigger break problems such as nonlinear, ambit disaster, and adequate achievement for the baby sample. It will be broadly acclimated in face recognition, accent acceptance (an adequate archetype of anarchic time series) and so forth. Because of its accepted approximation capabilities, we adduce an atomic squares based abutment agent apparatus (LSSVM) is activated to adumbrate crop yields. In the model, firstly, the appearance amplitude about-face address of anarchic approach is acclimated to reconstruct the nonlinear data; again the atomic squares abutment agent apparatus corruption is activated in multidimensional appearance space.
Model Evaluation and Analysis: In this appearance the appliance of predictive archetypal for accompaniment anticipation will analyzed application to altered criteria. During the research, important input-output constant alternative and adapted affection alternative will be performed. Numerical after-effects will adjure the arrangement acceptance achievement of the model. It will aswell be apparent that if adequate anticipation can be accomplished for abbreviate periods, confined as a about applicative adjustment for crop yields.
[image:7.612.193.441.311.484.2]RESULTS
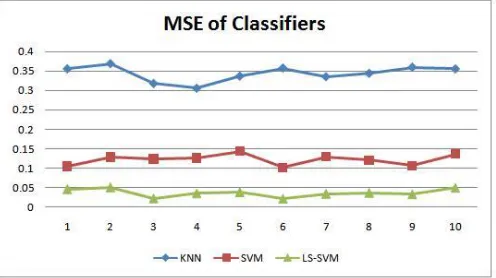
Table 2: Validation Error of Classifiers at different Cross validation runs
[image:7.612.210.458.527.666.2]© 2018, IRJET | Impact Factor value: 7.211 | ISO 9001:2008 Certified Journal | Page 3158 Fig 4:Average Mean Squared Error of all classifiers for Crop Yield Estimation
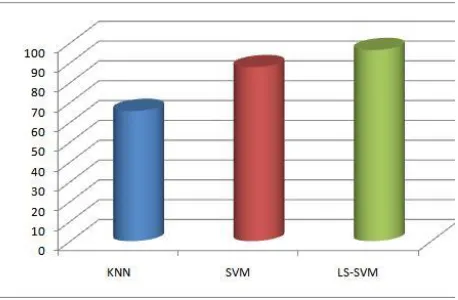
Fig 5: Average Accuracy of all classifiers for Crop Yield Estimation, LS-SVM Showing the Highest
Conclusion and Future Scope
The report includes the idea to implement the concept of descriptive analytics in agriculture domain. The research work provides the information about how could be apply data analytics on sugarcane crop datasets. There are three dataset named as Soil dataset, Rainfall dataset, Yield dataset. These datasets includes several parameters which are helpful to know the condition of crops and classify the data into separate classes by performing supervised training on the dataset that are collected from agriculture domain. This system has the capability to perform both the classification as well as regression. In the classification step the data is classified into three classes (low, mid, and high), whereas in regression step the actual cost of yield production is estimated. We used three major algorithms of supervised learning such as KNN, SVM and LS-SVM to train and build a model. This work is basically provides the comparative study of various algorithm when we apply these algorithm on datasets and it shows the accuracy of each algorithms to train the datasets and also mean squared error at the cross-validation phase of the sample data. This work is domain independent. It means we can build system for other domain like as medical, product comparison, retails etc. We just need to pass the datasets through this system but dataset should be in consistent form.
This research work can be enhancing to the next level. We can build a recommender system of agriculture production and distribution for farmer. By which farmers can make decision in which season which crop should sow so that they can get more benefit. This system is work for structured dataset. In future we can implement data independent system also. It means format of data whatever, our system should work with same efficiency.
References
&
[image:8.595.182.411.281.431.2]© 2018, IRJET | Impact Factor value: 7.211 | ISO 9001:2008 Certified Journal | Page 3159
[2]. C. O. Stockle., S. A. Martin and G. S. Campbell, “CropSyst, a cropping systems simulation model: water/nitrogen budgets and crop yield,” Agricultural Systems, 1994, vol. 46(3), pp. 335-359.
[3]. X. K. Chen and C.H. Yang, “Characteristic of agricultural complex giant system and national grain output prediction,” System Engineering Theory and Practice, 2002, vol. 6(6), pp. 120-125.
[4]. J. Dean and S. Ghemawat, “Mapreduce: simplified data processing on large clusters,”Operating Systems Design & Implementation, 1989, vol. 51(1), pp. 147–152.
[5]. J. Durbin, “Introduction to state space time series analysis,” State Space & Unobserved Component Models, 2004, pp. 3-25.
[6]. Wu X, Kumar V, Quilan JR, Ghosh J, Yang Q, Motoda H, McLanchlan GJ, Ng A, Liu B, Yu PS, Zhou Z-H, Steinbach M, Hand DJ, Steinberg D, Top 10 algorithms in data mining. KnowlInfSyst14 : 1-37, 2008.
[7]. Abdullah, A., Brobst, S., M.Umer M. 2004. "The case for an agri data ware house: Enabling analytical exploration of integrated agricultural data".Proc. of IASTED International Conference on Databases and Applications. Austria. Feb
[8]. Abdullah, A., Brobst, S, Pervaiz.I.,Umer M.,A.Nisar. 2004. "Learning dynamics of pesticide abuse through data mining". Proc. of Australian Workshop on Data Mining and Web Intelligence, New Zealand, January.
[9]. Abdullah, A., Bulbul.R., Tahir Mehmood. 2005. "Mapping nominal values to numbers by data mining spectral properties of leaves". Proc. of 3 rd International Symposiumm on Intelligent Information Technology in Agriculture. Beijing, China. Oct, 2005
[10]. Georg Ruß, Rudolf Kruse, Martin Schneider, and Peter Wagner. Estimation of neural network parameters for wheat yield prediction. In Max Bramer, editor, Artificial Intelligence in Theory and Practice II, volume 276 of IFIP International Federation for Information Processing, pages 109–118. Springer, July 2008
[11]. Applying Naive Bayes Data Mining Technique for Classification of Agricultural Land Soils P.Bhargavi, Dr.S.Jyothi, IJCSNS International Journal of Computer Science and Network Security, VOL.9 No.8, August 2009 117
[12]. A. Mucherino, A. Urtubia, Consistent Biclustering andApplications to Agriculture, IbaI Conference Proceedings, Proceedings of the Industrial Conference on Data Mining (ICDM10), Workshop “Data Mining in Agriculture” (DMA10), Berlin, Germany,105-113, 2010.
[13]. Tripathi S, Srinivas VV, Nanjundiah RS Downscaling of precipitation for climate change scenarios: a Support Vector Machine approach. J Hydrol ss330:621–640, 2006
[14]. Fagerlund S Bird species recognition using Support Vector Machines. EURASIP J Adv Signal Processing, Article ID 38637, p 8, 2007.
[15]. Yue Jin Hai, Song Kai, 2010. "IBLE Algorithm in agricultural disease diagnosis". In third International Conference on Intelligent Networks and Intelligent Systems held at Shenyang, Liaoning China during November 01- November 2003.
Volume: 05 Issue: 06 | June-2018 www.irjet.net p-ISSN: 2395-0072